ADA/USDT 1DAY UPDATE BY CRYPTO SANDERSHello, welcome to this ADA/USDT update by CRYPTO SANDERS.
CHART ANALYSIS:- Cardano (ADA) plunged to a three-month low on Thursday, as traders remained nervous, following the recent U.S. Securities and Exchange Commission (SEC) lawsuits.
After a high of 0.3376 on Wednesday, ADA/USD dropped to a bottom at 0.3196 earlier in today’s session.
The drop pushed the token to its lowest level since March 15, when price was at a bottom of 0.3166.
this decline came as the relative strength index (RSI) moved deep into oversold territory, falling to a low below 30.00.
The index has since rebounded, and is tracking at 34.21, which is marginally above a key level of resistance at the 33.00 mark.
Should this upward momentum continue, bulls will look to recapture the 0.3500 level.
I have tried to bring the best possible outcome to this chart.
Hit the like button if you like it and share your charts in the comments section.
Thank you
Adausd

Cardano non popular chart 💔Update:
Cardano non popular chart 💔
I HODL ADA for long-term
Looking on weekly chart without emotion and bias...
ADA might correct🔻much lower dear Crypto Nation
Even $0.095 or $0.053 would not be the end of future price gains - just Log-Fib
Let me know your thoughts in the comments🤗
⬇️⬇️⬇️
Likes and Follow for updates appreciated🤗
Disclaimer:
Not financial advice
Do your own research before investing
The content shared is for educational purposes only and is my personal opinion

ADAUSD Rejected Three Attempts to Break Key Support#ADAUSD bulls holding strong at the $0.38 demand zone after three consecutive attempts to break below. But that's not all, a recent breakout above the downtrend trendline has added fuel to the bullish pattern. This is a clear indication of complete bullish domination, and we're excited to see where it goes from here.
But we're not jumping in just yet. We need to see a daily close above the current resistance before making our move. And when that happens, we'll be on the lookout for a buy trade setup, targeting a potential 10-15% profit.
Stay tuned for updates on #ADA and other exciting coins as we continue to monitor the market for potential trading opportunities. This is a time to be bullish, and we're ready to ride the wave!

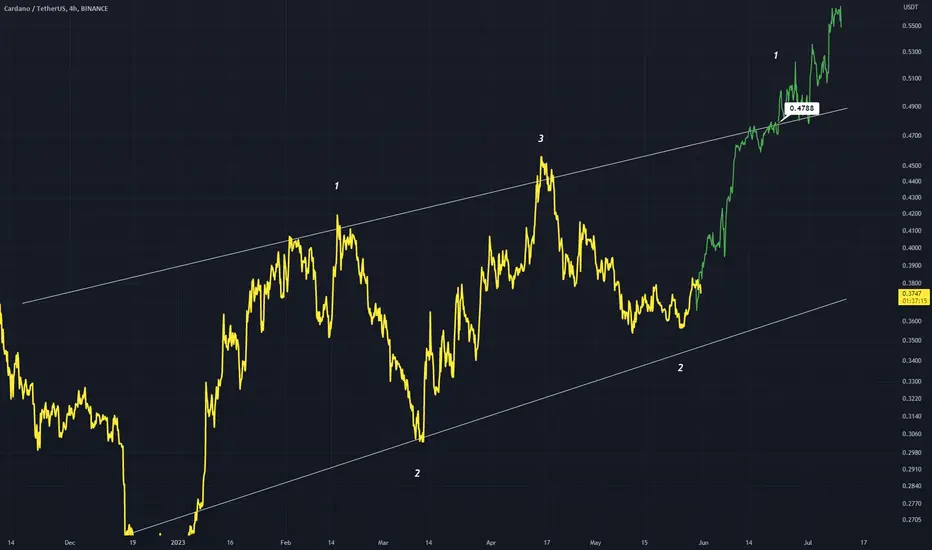
CARDANO - Catch This BIG Impulse!Cardano is setting up for a big impulse. We've recently seen the completion of wave 2 correction and broken out of that correction. We are now in bullish waters and seeing a nice deep retracement which is great news for us as we've got the bottom in place. This means the lower it goes, the better.
Trade idea:
- Safe entry on break of red trendline
- Stops below the bottom
- Targets: 1, 3, actively manage rest
Goodluck and as always, trade safe!

ADA 1D inverse H&SIn 1D chart, ADA has an inverse H&S pattern.
-
ADA broke through the neckline of 0.4218 and then fell back to the support trend line, and the EMA was entangled, which means that ADA is in a state of consolidation.
Before ADA falls below 0.2973, there is still a chance to reach the upper target:
0.4916
0.5131
0.5347
0.6045
-
Look at the 4 hr chart:
There are two bottoms near the support trend line, and if the price closes above 0.3801, the double bottom pattern is established.
Follow the goals above:
0.3924
0.3962
0.3999
0.4122
-

ADAUSD 4June2023although in the last few weeks it looks sideways, but the price formed a new HH and responded well to the bullish trendline area. there is a positive possibility that the price will return to bullish if you look at the character of the price that occurred.

ADAUSD [D] Pivot isles !!!First ~0.54 then ~0.74 (inside polyline) almost nothing else between them ;)
Be advice yourself...

Cardano ADA and the US Debt CeilingNegotiators from Democratic and Republican parties finalized an agreement on Sunday night.
Instead of raising the limit to a specific level, they have opted to suspend it entirely until 2025. This strategic move ensures that their bills can be paid until that date, while also guaranteeing that the next battle to raise the ceiling will not coincide with the upcoming presidential election.
The resolution of the debt ceiling issue brings optimism and stability to the financial landscape, which has a positive ripple effect on the cryptocurrency market.
Bitcoin and the broader crypto market stand to benefit from increased investor confidence, reinforced safe-haven status, enhanced institutional adoption, regulatory clarity, and the overall positive impact on global markets.
ADA/USDT short
Entry Range: $0.35 - 0.37
Take Profit 1: $0.40
Take Profit 2: $0.43
Take Profit 3: $0.46
Stop Loss: $0.32

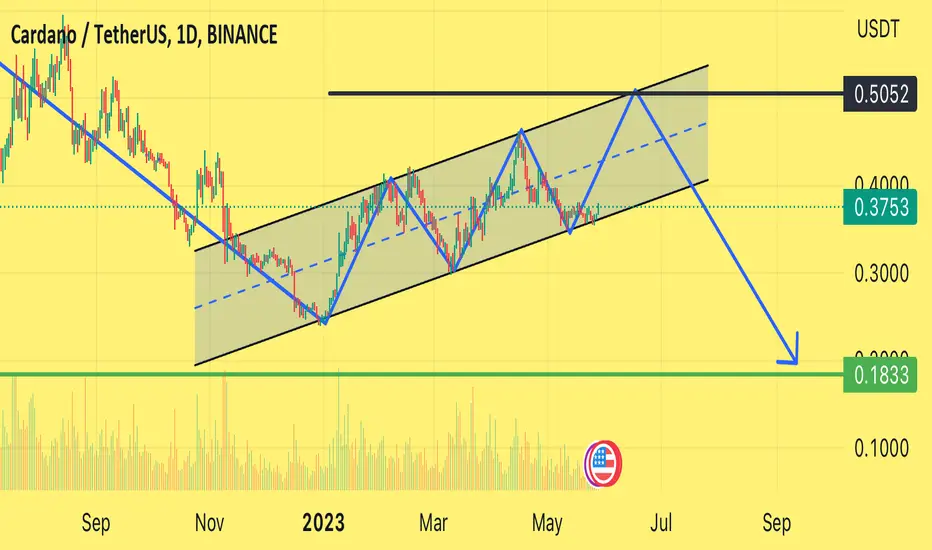
ADA to 0.09$ - Keep it Simple Hello again
I don't see any reason to buy ADA unless it goes to 0.786 Fib level which is around 0.09$
Also its a major monthly support Don't be fooled by the bear bounces here and there
Good luck

ADAUSDT - W Pattern Within ChannelADA is within a channel with a higher high top formed. A W pattern can form right now allowing a move up to (1) This is a bullish forecast with the price label attached. Lets see what happens.

Cardano- i read many peoples complain about ADA on Twitter.
- Like the project is bad and going to nowhere.
- As Trader my job is only to do the Math and check pourcentages.
- i care about what peoples speak but i verify and deduct.
-----------------------------------------------------------------------------------------------------
So let me do Little Math for Cardano :
-----------------------------------------------------------------------------------------------------
- in 2018 if u bought ADA at Bottom ( 0.017$) you could have made +6500%
-- So if u invested 10k$ you could have returned $660,000
-----------------------------------------------------------------------------------------------------
- in 2020 ADA returned the same bottom level ( 0.017$) then made +16160%
-- So if u invested 10k$ you could have returned $1,626,000
-----------------------------------------------------------------------------------------------------
- So Now i don't think we gonna see again 0.017$ in entire Cardano Life.
- So haters gonna hate but Cardano made the Job.
- Just have to buy at the good time and be patient.
- if you bought the TOP, it's not Cardano fault, but your own fault!
- Next Target could be around 7.5$ (+3000%)
Happy Tr4Ding !

#ADAUSDT- Another Bullish Impulse to Occur? Dear Traders, hope everyone having a great week, we are expecting strong bullish impulse to occur in coming days on this crypto pair.
comment down your views!!

Ada going as predicted on 29 April last ideaAda price came down to 0.34 from 0.40 as predicted in last idea 29 April. Now its going up by following our arrow. If it keep following this arrow and rising channel then Target is 0.50
If any daily candle closed below 0.36 then price will not pump soon. It will keep dumping…
ADA analysis (4H)Hi, dear traders. how are you ? Today we have a viewpoint to BUY/LONG the ADA symbol.
For risk management, please don't forget stop loss and capital management
When we reach the first target, save some profit and then change the stop to entry
Comment if you have any questions
Thank You

ADA/USDT 1DAY UPDATE BY CRYPTO SANDERSHello, welcome to this ADA/USDT update by CRYPTO SANDERS.
CHART ANALYSIS:- Cardano (ADA), was also in the green to start the weekend, with prices moving further away from a recent support level.
ADA/USD hit an intraday high of 0.3667 earlier in today’s session, which comes following a low of 0.3564 on Friday.
The move has resulted in Cardano climbing to its strongest point since Wednesday, moving away from the aforementioned floor at 0.3550 in the process.
ADA has begun to consolidate, with the price now retreating from its earlier highs, following a collision with a ceiling on the RSI.
Price strength has failed to move past a point of resistance of 44.00 which has pushed the token to a current reading of 0.3638.
I have tried to bring the best possible outcome to this chart.
Hit the like button if you like it and share your charts in the comments section.
Thank you

ADA will Lag and then catch up in a hurryEverything in crypto appears to be in a diagonal. Ada is no different. The angle of ADA's diagonal is less than BTC and most other cryptos. This means that ADA will probably not break 50cents before BTC has its first major correction of the cycle. But when BTC corrects ADA should actually fair better. After the correction, ADA will have its moment. I am short term long.

adausdt are you rdy ?🧨😉Well, well, well
We are analyzing my favorite cryptocurrency, but I don't like its creator at all, because in my view, he is nothing more than a fool.
First of all, I must say that from the point I marked, there should be a drop to the price of $0.1858, then when it reaches this price, it will be the entry point for taking a long position. Now I will tell you how far.
The first target is $0.5866, then the second target is $1.2248. Now, whether you want to accept it or not, this is what you see.

ADA: Shining Bright ☀️ Will BTC, ETH Catch the Updraft? 🌩️🚀🤔The weather is 🌴 tropical – very bullish with some upside potential – for Cardano today. However, stormy weather is ahead for the rest of the global crypto market. ⛈️ This translates into a very bearish market with some downside risk for cryptocurrencies like Bitcoin, Ethereum, Binance Coin, and Polkadot.
Over a one-week horizon, ☁️ cloudy weather with some ☀️ sun is likely for Bitcoin, signaling a slightly bearish market with downside risk. The outlook is a bit brighter for Ethereum, Ripple, Cardano, and Dogecoin, where ATTMO signals a slightly bullish mood with 🚀 upside potential.
Follow us to stay updated with more crypto weather insights and reports!🌩️⛅🌈

ADAUSD ❕ tests the supportThe ADA has reached the support level.
The price formed a rising lows.
The chart will resume rising if the asset fixes above the current support level.

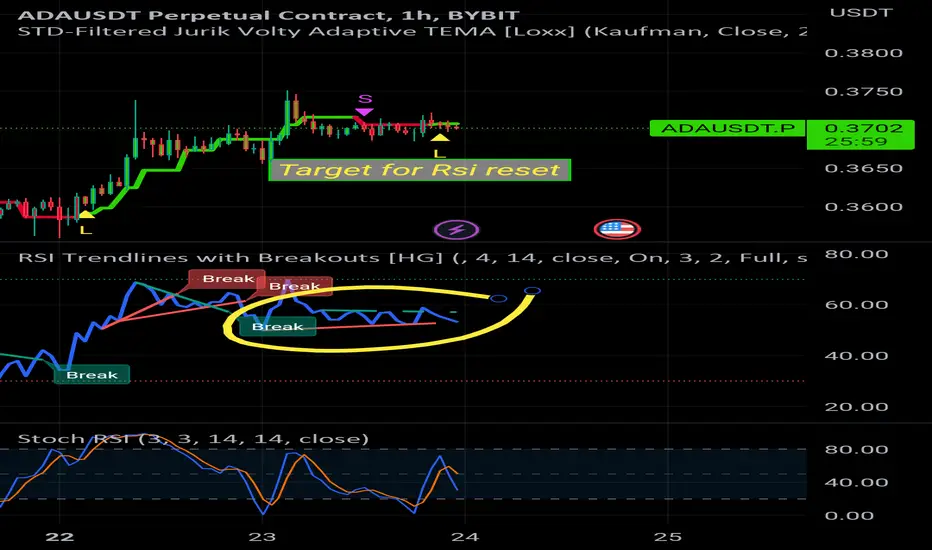
Ada consolidation Rsi is consolidated up high stochastic is halfway down
Looking for rsis to reset at bottom and long to local resistance
ADAUSD 23May2023if you see that the price responds positively to the trendline, chances are that the price will return to bullish. Broadly speaking, I still believe ADA is in a bullish trend which is currently in a correction period. This bullish trend fails if the price drops further than the red line below. whereas in the short term, the bullish trend fails if the price falls more than the blue line (1)

ADA/USD LongLooks pretty prime to break out of this massive falling wedge any day now. Looking for low to mid .40's target.
