Cardano, on a rising trend line Ada moves in an upward trend. If it breaks the secondary trend line, further upside is expected, until the next resistances.
Good trading!
If you find it useful, like, follow, share!
Adausd

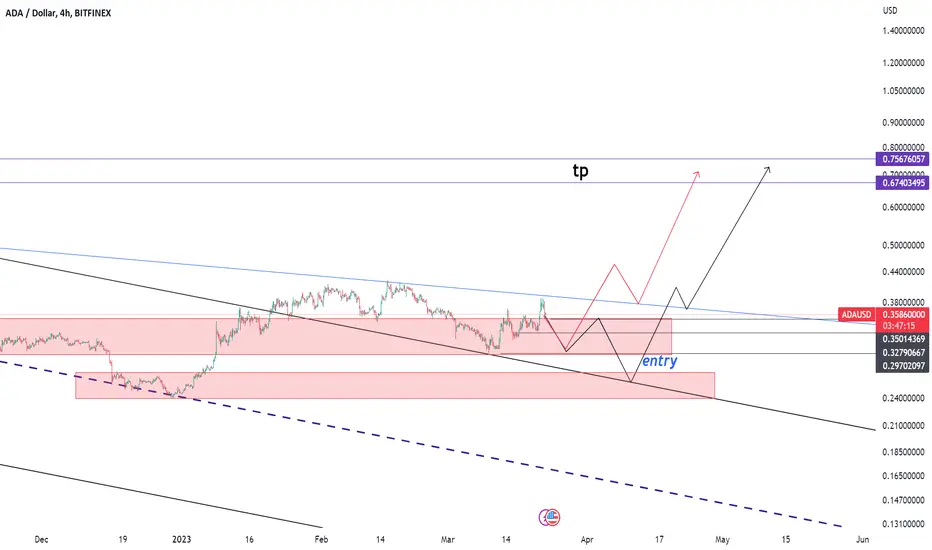
ADAUSDT Daily: 25/03/2023: 🔴It's time to fall.🔴
You can see all the details on the chart.
If you have questions, feel free to ask.
💥Important note: It's not investment advice, so do your own research.💥
💡Wait for the update!
🗓️25/03/2023
🔎 DYOR
💌It is my honor to share your comments with me💌

My Crypto Convictions - BTC | ETH | ADA | SOL | XLMBitcoin (BTC): Bitcoin is the world's first and most well-known cryptocurrency, created in 2009 by an unknown individual or group using the pseudonym Satoshi Nakamoto. Bitcoin operates on a decentralized ledger technology called blockchain, which allows for secure and transparent transactions without the need for intermediaries such as banks. Bitcoin's price is known for its volatility, often experiencing sharp rises and declines in short periods of time. As of September 2021, Bitcoin has a market capitalization of over $800 billion and a circulating supply of 18.8 million coins.
Ethereum (ETH): Ethereum is a decentralized blockchain platform that enables developers to build and deploy decentralized applications (dApps). The platform's native cryptocurrency is Ether, which is used to pay for transactions and computational services on the network. One of Ethereum's most significant contributions to the cryptocurrency world is the introduction of smart contracts, which are self-executing contracts that can automate the negotiation and enforcement of contract terms. Ethereum currently has a market capitalization of over $400 billion and a circulating supply of over 117 million coins.
Cardano (ADA): Cardano is a blockchain platform that operates on a proof-of-stake (PoS) consensus algorithm. The platform was created by Charles Hoskinson, one of the co-founders of Ethereum, and aims to provide a more sustainable and scalable alternative to existing blockchain networks. Cardano's native cryptocurrency is ADA, which is used to pay for transactions and fees on the network. The platform has gained attention for its focus on academic and scientific research, with a strong emphasis on the development of practical use cases for blockchain technology. Cardano has a market capitalization of over $80 billion and a circulating supply of over 32 billion coins.
Solana (SOL): Solana is a high-performance blockchain platform that aims to provide faster and cheaper transactions compared to other existing blockchain networks. The platform's native cryptocurrency is SOL, which is used to pay for fees and transactions on the network. Solana is built on a unique consensus algorithm called Proof of History (PoH), which helps to optimize the processing of transactions and reduces network congestion. In August 2021, Solana experienced a surge in popularity and price, briefly becoming one of the top 10 largest cryptocurrencies by market capitalization before experiencing a correction. As of September 2021, Solana has a market capitalization of over $35 billion and a circulating supply of over 300 million coins.
Stellar Lumens (XLM): Stellar Lumens is a blockchain platform that enables fast and secure cross-border transactions. The platform's native cryptocurrency is XLM, which is used to facilitate transactions and pay for fees on the network. Stellar was created by Jed McCaleb, one of the co-founders of Ripple, and aims to provide a more inclusive and accessible financial system by leveraging blockchain technology. One of Stellar's notable partnerships is with IBM, who has been working with the platform to develop blockchain solutions for the financial industry. As of September 2021, Stellar has a market capitalization of over $8 billion and a circulating supply of over 23 billion coins.

Cardano ADA LONG, Bearish short term MASSIVE EXPLOSION TO 0.60$None of this is advice, this is what im looking at. could we maybe see that kiss at 0.31$ and see a massive upside? i know im buying the dip

ADA is going to increase soon!ADA has created an Inverse head and shoulder pattern which means a great bullish trend is on the Horizon. If the price follows this pattern's expected movement,we shall see it reach 0.70 pretty soon or at least in mid term duration. The expected movement is as much as the measured price movement ( AB=CD ). The Break out has not Happened yet.
_ _ _ _ _ _ _ _ _ _ _ _ _ _ _ _ _ _ _ _ _ _ _ _ _ _ _ _ _ _ _ _ _
🌍Thank you for seeing idea .
Have a nice day and Good luck.

ADA/USD ANALYSISEntry points in the transaction are specified
Enter with the right volume and stick to the goal
ADA : CYCLE VIEWToday, ADA appears to be re-entering a new trend, but the question remains as to what this means for the long term. For day traders, it is essential to monitor the day trading since there are no guarantees for any trend.
There is a good chance that ADA could enter into a new cycle, but we have yet to see a sustained increase trend for the coin in the long term. The critical question is whether ADA is going to experience genuine growth that will bring sustained increases over the long term.
ADA is a coin that has the potential to reach and exceed the $1 mark. Only time will tell if ADA can continue to build on its past successes and reach new heights coming time.
Today it shows interesting, and we will see if it's able to rebuild the trend.

ADAUSD ❕ broke up the downtrend lineADA broke through resistance on rising trading volumes.
The RSI chart is in the bullish zone (4H, 1H and 30m TFs)
The asset will continue to rise after a retest of the support level.

Movements for mid- to long-term trend reversalHello?
Traders, welcome.
If you "Follow", you can always get new information quickly.
Please also click "Boost".
Have a good day.
-------------------------------------
(ADABTC 1W chart)
In order to continue the uptrend, the price needs to be maintained at least above the HA-Low indicator.
I think that below 0.0000 1641 is a mid- to long-term investment area.
Therefore, the key is whether it can rise above 0.0000 1641 and above the HA-Low indicator.
----------------------------------------
--------------------------------------------
(ADAUSDT 1W Chart)
Since the HA-Low indicator is passing around 0.2974, if the price is maintained above this point, it is a mid- to long-term buying period from a trading perspective.
However, if it drops below 0.2974, that is, the HA-Low indicator, there is a possibility of renewing the recent low, so you need to think about countermeasures.
As the Bollinger Bands begin to contract, being able to keep the price above 0.2974 becomes more important.
(1D chart)
It can be seen that the highs and lows continued to decline, and the trend was broken after around December 30, 2022.
Therefore, if the current trend is maintained, it is expected to turn into an uptrend.
To do so, it is important to get support around 0.3206, the point of the HA-Low indicator.
If unsupported and falling,
1st: around 0.3032
2nd: 0.2524-0.2772
You need to make sure that it is supported in the vicinity of the 1st and 2nd order.
The question is whether it can rise above 0.3448 during the volatility period around March 22nd.
Mid-term and long-term trend reversal can take a long breath.
Therefore, those who want to buy ADA for next year's bull market can refer to this point and proceed with the purchase.
-------------------------------------------------- -------------------------------------------
** All descriptions are for reference only and do not guarantee profit or loss in investment.
** Even if you know other people's know-how, it takes a considerable period of time to make it your own.
** This is a chart created with my know-how.
---------------------------------

ADA H&S upcoming ?Hello Traders,
I guess am seeing ADA forming a head and shoulders pattern..
It may test the neck line soon at 0.6304.
In case of a break : I guess 0.6000 will be the first major support that the price can retrace from instead of going to the H&S target.
INVALIDATION : Dotted line ( above 6.53 )
-
Educational :
What is Head and shoulders pattern ?
The Head and Shoulders pattern is an accurate reversal pattern that can be used to enter a bearish position after a bullish trend. It consists of 3 tops with a higher high in the middle, called the head. The line connecting the 2 valleys is the neckline. The height of the last top can be higher than the first, but not higher than the head. In other words, the price tried to make a higher high, but failed. The closer the 2 outer tops are to the same price, the more accurate the pattern.
If the price breaks the neckline and closes below it, the pattern has completed. Conservative traders may look for additional confirmation. The target can be estimated by measuring the height of the pattern (from the neckline to the head) and projecting this downwards. Common stop levels are above the neckline or above the right shoulder. The Inverse Head and Shoulders is the bullish version of this pattern that can form after a downtrend. TradingView has a smart drawing tool that allows users to visually identify this pattern on a chart.
-
Leave a thumb up if you agree !
Follow for more <3
Have a nice day.

Cardano looking bullish on the monthlyCardano ADA looking bullish on the monthly as the monthly RSI is about to break out (crossing of RSI Moving Averages) as well as the price action.

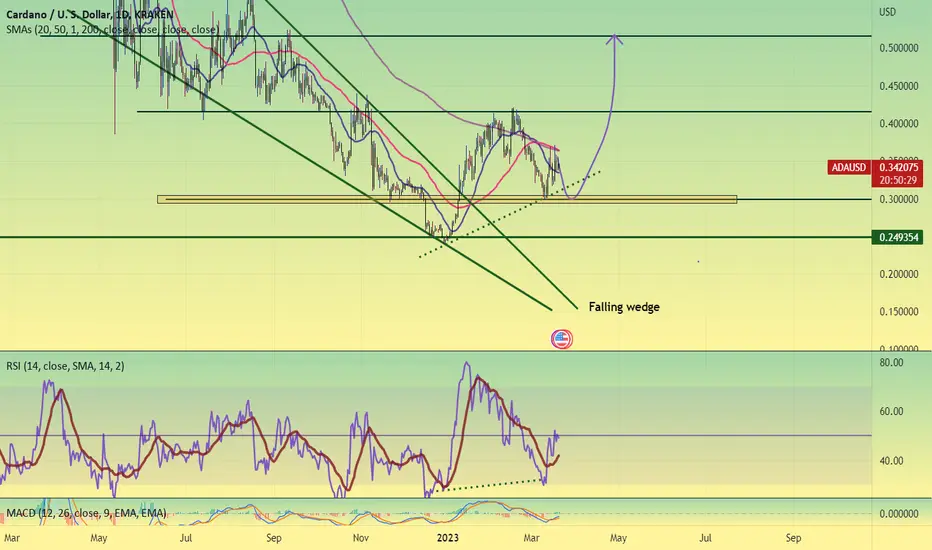
cardanohey everyone,
ada is picking up good volume and recently break out of the falling wedge, price may or may not retrace to 0.30 but that is the main support as of now...
price can only fall below 0.24 if overall crypto crashes... previous resistance was 0.40 so most likely it'll break this time if price is bullish and the next estimated
target is 0.50 to 0.60
good luck
Nesting periodThe price action suggests that we have possibility to see the nest, the 'basis' of a powerful jump. 1-2 1-2, 3 of a 3 of a 3 in progress!

ADAUSD ❕ above the liquidity zoneADA is trading above liquidity.
Price has fixed above 50EMA (4H TFs).
RSI chart moves in bullish zone (4H, 1H and 30m TFs)
I expect price to rise after fixing above support.

Cardano's Bear RunBull market followed by bear market.
Bear market followed by bull market.
Bull run followed by bear run.
Here I am mapping for you Cardano's (ADAUSD) bear run.
Namaste.


Cardano Weekly View - March 2023Hello Guys, Weekly Analysis is on the ADAUSDT Symbol in a 1H Time frame, I Hope it Will be Useful for You, Don't Forget to Like, Follow, Comment

Cardano (ADA) formed bullish Butterfly for upto 13.50% moveHi dear friends, hope you are well and welcome to the new trade setup of Cardano (ADA) coin.
On a 4-hr time frame, ADA has formed a bullish Butterfly move for another price reversal.
Note: Above idea is for educational purpose only. It is advised to diversify and strictly follow the stop loss, and don't get stuck with trade

ADA bounced away!If you find this info inspiring/helpful, please consider a boost and follow! Any questions or comments, please leave a comment! Also, check out the links in my signature to get to know me better!
Well it got the bounce but not all is gravy, want to see this level break and continuation.
Falling back below .32 is going to be suspicious, but a nice corrective retrace to that level would be of interest.
Cheers!

ADA going to decay?If you find this info inspiring/helpful, please consider a boost and follow! Any questions or comments, please leave a comment! Also, check out the links in my signature to get to know me better!
PA moved past the ideal area, It's hard to find TTT bounces, TBF.
Took an entry, shall see what the world has in store on ES/SPX open.
Still short in prof from .40s and hold this short.
IF there is at least a bounce .3487 is the level I'm watching.
Cheers.

ADAUSD ❕ bullish takeoverWhile the RSI chart is moving in the buy zone (1H and 30m TFs), price and RSI have formed a confirmed bullish divergence (1H TF)
ADA has fixed above 50EMA (30m TF)
I expect growth after holding the lower boundary of the range.

ADAUSDT Daily: 04/03/2023: Bear or what?
Well, the price had a bullish reaction after collecting liquidity below 0.3555.
Now we expect the price to retest the supply zone again and then fall, or by considering a lower time frame, the price may fall from here.
💥Important note: If the price can break 0.3769, this TA would be invalid.💥

Cardano ADA Price targets if SEC will ban Crypto StakingCoinbase CEO says he heard rumors the SEC wants to ban crypto staking.
Already crypto exchange Kraken shuts down crypto-staking.
This will have ripple effects in the entire industry!
My price targets for Cardano ADA are:
ADA/USDT short
Entry Range: $0.35 - 0.38
Take Profit 1: $0.32
Take Profit 2: $0.28
Take Profit 3: $0.24
Stop Loss: $0.42
