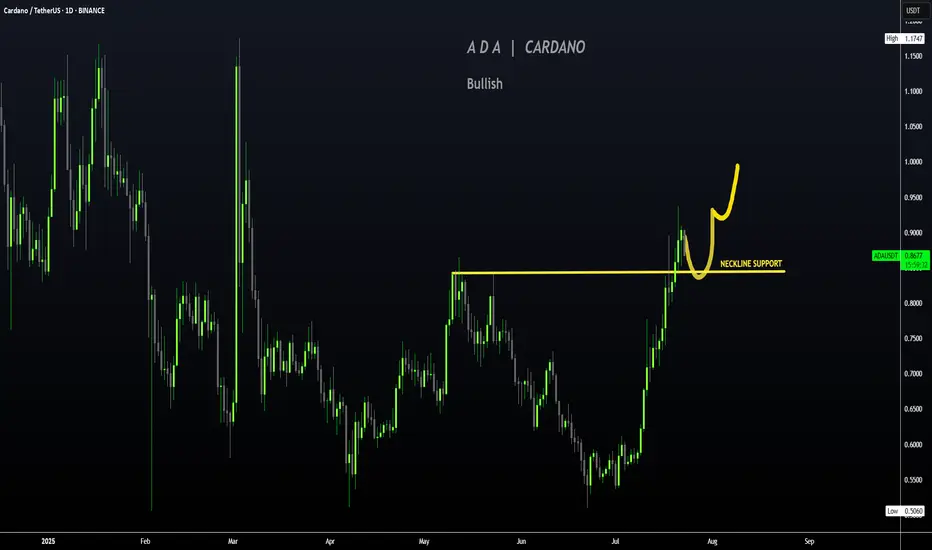
CARDANO | ADA Creeping UP to $1Cardano has made a big move in recent weeks, boasting a 77% increase.
If you were lucky enough to buy in around 30 or 40c, this may be a great TP zone:
Looking at the Technical Indicator (moving averages), we can see the price makes its parabolic increases ABOVE - which is exactly where we are currently beginning to trade. This could mean more upside is likely, and the 1$ zone is a big psychological resistance zone:
A continuation of the current correction may look something like this for the next few weeks:
_____________________
BINANCE:ADAUSDT
Adausdlong
ADAUSDT Breaks Long-Term Downtrend – Critical Support Retest!The ADAUSDT pair is showing a compelling technical setup. The price has successfully broken out of a long-term descending trendline (yellow line) that had been acting as dynamic resistance since late 2024. This breakout came with strong momentum, signaling a potential shift from a bearish trend to a bullish reversal.
After the breakout, price managed to rally up to minor resistance around $0.90, but is now pulling back and retesting the key support zone (highlighted yellow box) — a previous strong resistance area now potentially flipping into support.
---
🟢 Bullish Scenario:
If the price holds above the $0.80 - $0.83 support zone, the break-and-retest structure will be validated.
A successful bounce from this area could push ADA back toward:
$0.90 (current minor resistance)
$1.13 (psychological and horizontal resistance)
$1.23 (previous supply zone)
$1.32 (recent local high)
A confirmed bullish continuation will be more convincing if the price forms a higher low and breaks above $0.90 with strong volume.
---
🔴 Bearish Scenario:
If ADA fails to hold the $0.8281 support and falls back below the descending trendline, then:
It may re-enter the previous range and test lower support around $0.75 or even $0.65.
This would suggest a potential false breakout and return to bearish territory.
Watch for bearish candlestick confirmations below $0.80 as an early warning.
---
📌 Pattern Insights:
Descending Trendline Breakout: Suggests a possible long-term trend reversal.
Break & Retest Structure: Price is currently testing the previous resistance zone as new support.
Layered Resistance Zones: Several clear resistance levels above provide logical targets for a bullish rally.
---
📊 Conclusion:
ADAUSDT has printed an early signal of a bullish reversal by breaking out of a long-standing downtrend. However, the sustainability of this trend depends heavily on the ability of price to hold the $0.80 - $0.83 support zone. Look for bullish confirmation candles in this area for a safer long entry.
#ADAUSDT #Cardano #CryptoBreakout #TechnicalAnalysis #Altcoins #BreakoutSetup #BullishRetest #CryptoChart #SupportAndResistance #PriceAction #TrendReversal

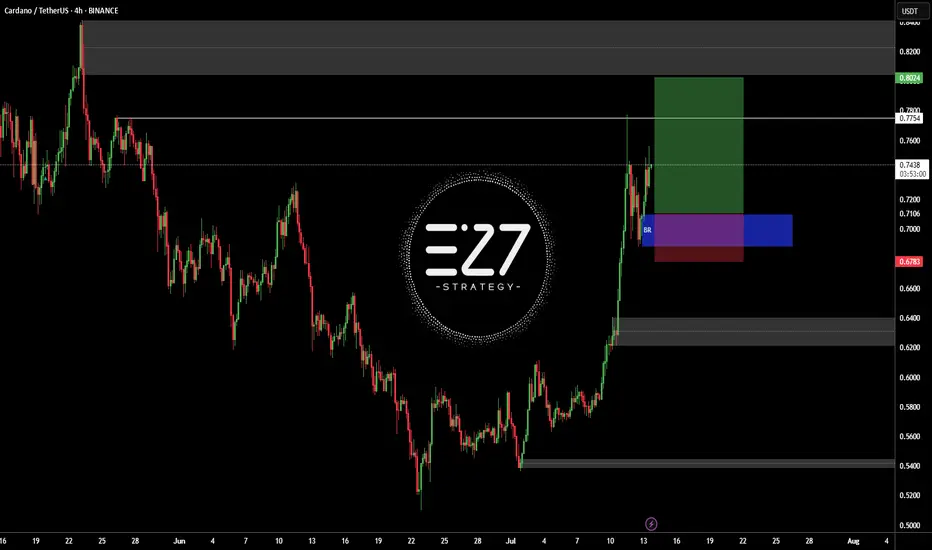
Cardano (ADA) Just Flipped Bullish — Next Stop: $0.9373?ADAUSDT is currently displaying a strong bullish structure on the 4-hour chart, bouncing from a critical support zone near $0.7774–$0.7315. After a healthy retracement, the pair appears to be regaining momentum, forming a potential higher low, which aligns with the continuation of the broader uptrend that started earlier this month.
Recent price action confirms that buyers are stepping in at key zones previously marked by blue “B” labels, and sell-side pressure seems to be weakening after the last swing top around $0.9373. The support zones, marked with dotted green lines, have held well, and the current structure suggests a rebound toward the previous high.
The most recent small leg up shows the formation of a bullish engulfing setup near $0.78, which could serve as a launch point toward the higher resistance. The candlesticks are also showing longer lower wicks — a sign that buyers are defending lower levels aggressively. With price currently floating near $0.81, there’s a good upside window available.
Here’s the trading setup based on the chart:
• Entry: Around $0.8106 (current price zone)
• Take Profit (TP): $0.9373 (previous swing high — +18.23%)
• Stop Loss (SL): $0.7315 (invalidates higher low structure — -7.73%)
• Risk-Reward Ratio: 2.36R (favorable for swing positioning)
If ADA can reclaim the $0.85 zone with strong candle closures, it would signal bullish continuation. Momentum indicators like RSI or MACD (not shown) would likely confirm the shift, especially if divergence was forming on recent dips.
Until ADA breaks below $0.7315, the bullish bias remains intact. The formation of higher lows and increasing buying interest at dynamic supports adds weight to the long setup. Price reclaiming the $0.85 zone may trigger a fast rally to $0.93, and possibly beyond if market-wide sentiment remains risk-on.

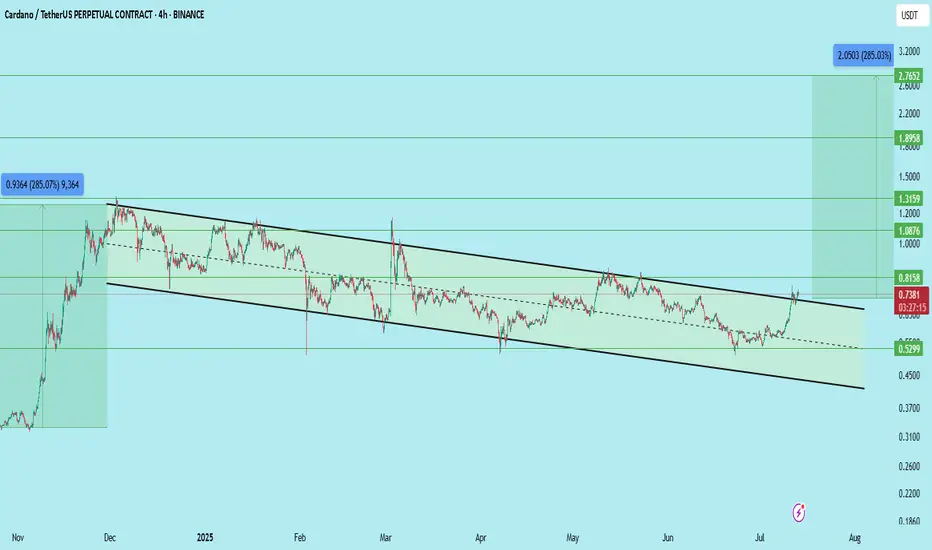
ADA/USDT | Multi-Month Breakout Brewing — a 10x play ?Cardano is quietly mirroring its previous macro cycle — but this time, the structure looks tighter, cleaner, and potentially more explosive.
The multi-month chart reveals a consistent uptrend forming off the 2022 lows, contained within a well-respected ascending channel. The price action shows strong similarities to the 2018–2020 accumulation phase, followed by the breakout that led ADA to its all-time high in 2021.
The current price structure is forming higher highs and higher lows within a channel — a strong bullish continuation pattern.
Volume has been increasing steadily during the up-moves, signaling real demand building underneath.
Fibonacci Extensions from the previous cycle highs and lows show key long-term resistance zones:
1.618 – $4.91
2.618 – $7.79
4.236 – $12.47
These levels could act as major psychological targets if the trend continues to evolve similarly to the last cycle.
⏳ Current Price (~$0.64) is still significantly below previous all-time highs and long-term extension zones — offering a potentially favorable risk/reward setup for patient investors.
⚠️ As always, nothing moves in a straight line — but if you're a macro-mind investor, you’ll start to notice more straight lines than most. Zooming out often reveals the patterns that noise hides.

ADAUSDT - Buy or Regret!As clear and simple as the chart is… the target is just as clear and reliable.
ADA is showing strong bullish structure on the 3-day chart — breaking above the red trendline with a successful retest, and also breaking above the 100 EMA.
The blue trendline represents a strong hidden resistance level that many traders are overlooking.
The upside move is likely to end around the 0.786 Fibonacci level, which intersects with this blue trendline — in the $1.50–$1.70 range.
A strong project. A fundamentally sound coin that respects technical analysis.
A logical and high-probability target.
Best regards Ceciliones🎯

ADAUSDTBINANCE:ADAUSDT in up-trend and my open position buy in latest sowing low.
Best entry: 0.6952 - 0.7259
Target: 0.7754 - 0.8024
Stop loss: 0.678
Please control RISK management
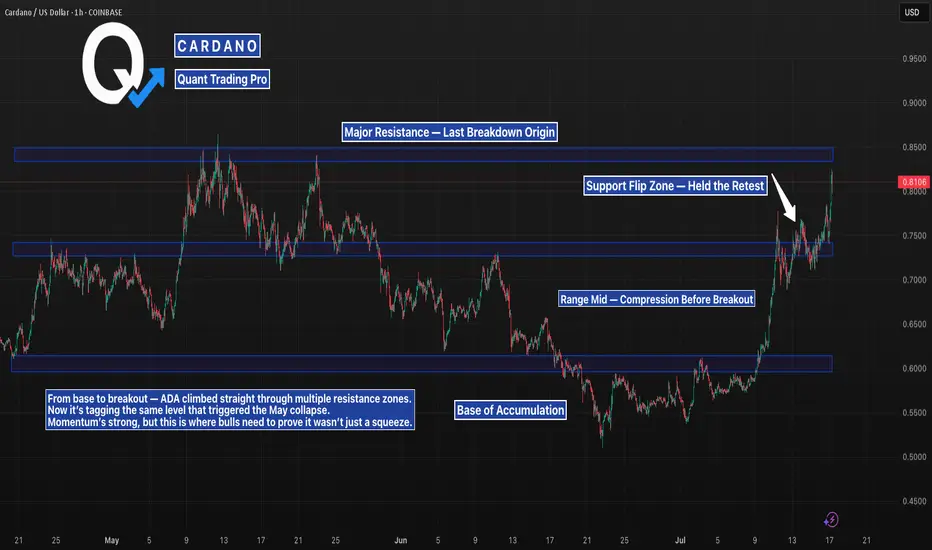
ADA Just Reclaimed Structure and Hit the First WallADA just ran from sub-$0.60 to above $0.80, reclaiming every key level along the way.
Now it’s testing the same resistance that sparked a sharp dump in May.
This zone is no joke — it’s where trends get confirmed… or crushed.
Watch the reaction here closely.
#ADA #Cardano #ADAUSD #CryptoCharting #BreakoutLevels #BacktestEverything #TradingView #QuantTradingPro #CryptoMomentum
ADA/USDT – Bullish Breakout & Retest ConfirmedCardano (ADA) has broken out of a long-standing descending channel and successfully retested the breakout level, showing signs of strong continuation.
Key Observations:
Price broke above the upper trendline of the multi-month falling channel
Retest of breakout zone around 0.74 held firmly
Momentum building after reclaiming key resistance at 0.8158
Entry: Current zone around 0.74–0.75 (post-retest)
Targets:
0.8158
1.0876
1.3159
1.8958
Final target: 2.7652
Stop Loss: Below 0.70 (based on retest invalidation)
This setup has a macro upside potential of over 285% based on the channel breakout projection.
As long as ADA holds above the breakout zone, this structure remains valid and could lead to a sustained rally.
DYOR | Not Financial Advice
ADA/USD Thief Trading Plan – Bullish Snatch & Run!🚨 ADA/USD HEIST ALERT! 🚨 – Bullish Loot Grab Before the Escape! (Thief Trading Strategy)
🌟 Greetings, Market Pirates & Profit Raiders! 🌟
🔥 THIEF TRADING STRIKES AGAIN! 🔥
💎 The Setup:
Based on our stealthy technical & fundamental heist tactics, ADA/USD is primed for a bullish loot grab! The plan? Long entry with an escape near key resistance. High-risk? Yes. Overbought? Maybe. But the heist must go on!
🎯 Key Levels:
📈 Entry (Vault Cracked!) → Swipe bullish positions on pullbacks (15m-30m precision).
🛑 Stop Loss (Escape Route) → Recent swing low (4H basis) at 0.5290 (adjust per risk!).
🏴☠️ Target (Profit Snatch!) → 0.6500 (or bail early if bears ambush!).
⚡ Scalpers’ Quick Heist:
Only scalp LONG!
Big wallets? Charge in! Small stacks? Ride the swing!
🔐 Lock profits with Trailing SL!
📢 Breaking News (Heist Intel!):
Fundamentals, COT, On-Chain, Sentiment— All hint at bullish momentum!.
🚨 ALERT! News volatility ahead—Avoid new trades during releases! Secure running positions with Trailing SL!
💥 BOOST THIS HEIST! 💥
👉 Hit LIKE & FOLLOW to fuel our next market robbery! 🚀💰
🎯 Profit taken? Treat yourself—you earned it!
🔜 Next heist incoming… Stay tuned, pirates! 🏴☠️💎

$ADA/USDT — Potential Long-Term BreakoutCardano is showing a major breakout from a long-standing descending channel on the daily timeframe.
Structure:
Downtrend channel respected for ~7 months
Breakout confirmed with a strong bullish daily candle
Price hovering around $0.7192, above previous resistance
Support Levels:
$0.60
$0.5299
Resistance / Long-Term Targets:
$0.8158
$1.0876
$1.3159
$1.8958
Ultimate target (Fib extension): $2.76+
Outlook:
The 285% potential move mirrors ADA’s past rally from similar conditions. If market sentiment continues improving and BTC holds above key levels, ADA might repeat history.
A pullback to $0.60–$0.66 could offer re-entry opportunities.
Bias: Bullish (long-term)
Caution: Not a trade setup—strictly an outlook. Watch BTC/ETH correlation.
DYOR | Not financial advice

Cardano Forming Potential Reversal Structure Inside TriangleHello guys!
Cardano’s been stuck inside this big descending triangle for months. We had a fake breakout a while back that totally failed.
Now, price is back at support and showing bullish divergence. That’s usually a sign sellers are getting tired.
If buyers step in here, I’m expecting a move back up toward 0.67–0.70 (top of the triangle). But if it loses the 0.53 support, that setup’s off the table.
Bias: Leaning bullish
🎯 Target: 0.67–0.70
Invalidation: Clean break below 0.53
Let’s see how this plays out.

ADA/USDT Ready to Explode? Watch This Symmetrical Triangle
🧠 Detailed Technical Analysis:
Cardano (ADA) is currently consolidating within a well-defined Symmetrical Triangle pattern on the 3-day chart. This pattern is formed by a series of lower highs and higher lows, indicating compression and indecision in the market — a classic setup for a strong breakout in either direction.
Price has recently bounced off the lower boundary of the triangle and is now heading toward the resistance trendline. A breakout from this structure could trigger a powerful bullish move if confirmed with volume.
🔼 Bullish Scenario (Upside Breakout):
A confirmed breakout above the descending trendline (~$0.65) with strong volume would indicate buyers regaining control.
Key upside targets based on historical resistance zones and the triangle's height:
🟡 $0.8144 – First major horizontal resistance
🟡 $0.9386 – Mid-range resistance from March 2025
🟡 $1.0920 – Former distribution zone
🟡 $1.2118 – Medium-term bullish target
🔵 $1.3264 – Key structural high from previous cycle
🔔 A breakout from a symmetrical triangle often leads to significant price action due to the long period of coiled pressure release.
🔽 Bearish Scenario (Breakdown):
If ADA fails to break above $0.62–$0.65 and gets rejected from the upper boundary of the triangle, the price could:
Revisit the lower trendline support around $0.55
A breakdown below this zone could lead to:
🔻 $0.48
🔻 $0.39
🔻 $0.2756 – A major psychological and historical support level
⚠️ This scenario would invalidate the bullish structure and potentially resume the mid-term downtrend.
📐 Pattern Breakdown – Symmetrical Triangle:
Pattern Duration: ~6 months of consolidation (Feb – July 2025)
Support Zone: $0.55 – $0.60
Resistance Zone: $0.65 – $0.75
Breakout Confirmation: Requires strong bullish candle close with increased volume
Volume Profile: Decreasing, typical of symmetrical triangle before explosive move
💡 Final Thoughts:
Cardano is at a make-or-break point. It has bounced from support and is attempting a breakout from this symmetrical triangle. If successful, this could mark the beginning of a major trend reversal with over +100% upside potential from current levels.
On the flip side, failure to break resistance could lead to a deeper retracement. That’s why confirmation is critical before entering a position!
#ADAUSDT #CardanoAnalysis #CryptoBreakout #SymmetricalTriangle #AltcoinSeason #BullishBreakout #BearishScenario #TechnicalAnalysis #CryptoChart #CryptoTrading #Altcoins

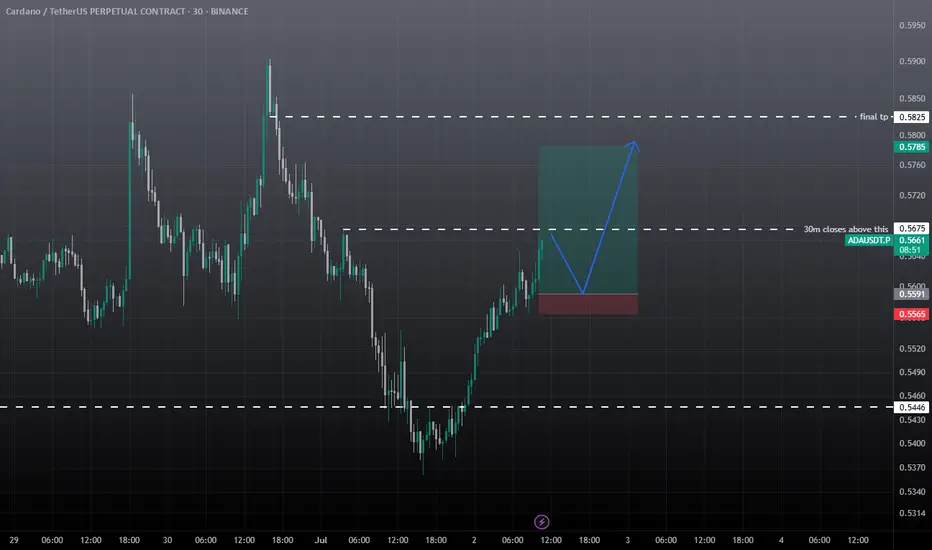
ADAUSDT Intraday SetupAda Showing some good movement. Trade Rules
must gave 30m candle closing above marked area, if wick above marked area then trade will become risky. Must use the sl. Target is given.
If retraces back before the marked area then it also good, in this case 30m marked area will first tp book 30% here, rest hold till final tp or SL.
ada usdt scalp tradeshort term pullback expected from ada, cardano so take it with small amount, trade entry based on 5m, so don't expect bigger targets. must use sl.

$ADA Bulls Wake Up—Potential 9% Rally If This Level HoldsCardano (ADA) appears to be attempting a short-term recovery after a prolonged decline, as shown in the 4H chart from Binance. The price recently bounced from a well-defined support level around $0.5391, which has held multiple times in recent sessions, confirming buyer interest in this zone. This support also aligns with a previous consolidation range and has proven reliable in the past.
The price is now approaching a zone of dynamic resistance marked by the BEST Cloud ALL MA indicator. This red-shaded cloud represents the bearish control zone, and ADA has repeatedly failed to break through this area in recent weeks. However, ADA is now showing early signs of upward momentum as it consolidates just beneath the first resistance at $0.5734 (also marked as TP1). This resistance corresponds with the bottom of the cloud and recent swing highs.
The broader trend is still bearish, but the structure suggests a possible reversal if bulls can reclaim levels above the cloud. A further push above $0.5734 could attract fresh buying interest and target the next resistance level near $0.6155, which also represents TP2 on the chart. This upper zone served as a breakdown point in mid-June and may now act as a key level to watch.
Meanwhile, the green moving average line (part of the cloud setup) is starting to flatten. This often signals a transition from downtrend to range or even an early reversal—especially when combined with a support bounce and higher low formation.
There’s no clear bullish breakout yet, but the setup looks favorable for a cautious long position.
Trading Idea
• Entry Zone: 0.5550 – 0.5600 (near current consolidation)
• Target 1 (TP1): 0.5734
• Target 2 (TP2): 0.6155
• Stop Loss: Below 0.5391 (e.g., 0.5320 – adjust based on your risk appetite)
• Risk/Reward to TP2: Around 2:1
If price breaks below $0.5391, the bearish structure would be confirmed, possibly leading ADA back toward the $0.50–$0.48 region. But as long as this support holds, the market favors a recovery scenario toward the resistance levels mentioned.
Overall, this is a textbook support-to-resistance play, with potential for an 8–9% upside if bullish momentum sustains. Confirmation through volume breakout above the cloud will further strengthen the case for short-term gains.

ADAUSD long termADAUSD long term
I think the 7 wave is finished.
I Hope that Btc break the price 112k .

#ADA/USDT#ADA
The price is moving within a descending channel on the 1-hour frame and is expected to break and continue upward.
We have a trend to stabilize above the 100 moving average once again.
We have a downtrend on the RSI indicator that supports the upward move with a breakout.
We have a support area at the lower limit of the channel at 0.6300, acting as strong support from which the price can rebound.
Entry price: 0.6360
First target: 0.6460
Second target: 0.6580
Third target: 0.6700

ADA | Liquidity Drain or UPSIDE POTENTIAL??ADA is lacking behind in terms of altcoins this season. We've not yet seen the new highs or parabolic increases that is due for a new BTC ATH.
We're seeing higher highs, and higher lows in the macro which is a bullish sign - indicating the trend is still BULLISH
From the macro, we do see a better picture.. at least THIs time around, the accumulation cycle isn't in such a tight range, and you could day trade / swing trade:
_______________
BINANCE:ADAUSDT

ADA(based on NEowave)this branch of Cardano is diamond diametrical but I didnt count the other branches and the larger degrees but based on ETH and other Altcoins I think it will pump soon.

Is it time to buy Cardano?Hello friends
According to the analysis and review we conducted on ADA, we reached almost definitive results:
This currency has fallen, which has caused the price to reach important and fundamental supports, and here we can buy in steps at the supports, depending on the level of risk and our capital management, and move with it to the specified goals.
*Trade safely with us*

ADAUSDT 3D Analysis ADA ~ 3D Analysis
#ADA Buy after successfully breaking through this resistance line with a short-term target of at least 10%++, long-term target $3

ADA Is Approaching a Trap Zone ? Yello Paradisers, are you watching how ADA is slowly coiling up near a crucial level while pretending nothing’s happening? Don’t be fooled — this is the calm before the storm, and the next move could wipe out the unprepared.
💎#ADAUSDT is currently respecting a well-established ascending channel. We’ve already seen three meaningful reactions at the ascending support, each triggering fresh bullish momentum. At the same time, the price is pressing just above a key demand zone around the $0.73–$0.74 region. This level remains absolutely critical for the bulls to defend if the structure is to remain intact.
💎What adds strength to this setup is #ADA’s current trading position above both the 50 EMA and 200 EMA on the daily timeframe. This reinforces the short-to-mid-term bullish bias. The 50 EMA is starting to slope upward, signaling that momentum could be gradually building, while the 200 EMA sits well below as solid structural support.
💎As long as the price continues to respect the ascending support line and stays above the demand zone, we expect a continuation move toward the $0.8728 moderate resistance. A successful break and close above that could open up the next leg toward $1.0011, where a strong supply zone sits waiting.
💎The real danger lies below $0.6495. A daily close under this level would not just invalidate the current setup it would completely shift market structure and expose ADA to deeper downside, likely towards the $0.60 area or lower.
Discipline, patience, robust strategies, and trading tactics are the only ways you can make it long-term in this market.
MyCryptoParadise
iFeel the success🌴

#ADA/USDT#ADA
The price is moving within a descending channel on the 1-hour frame, adhering well to it, and is heading for a strong breakout and retest.
We are experiencing a rebound from the lower boundary of the descending channel, which is support at 0.7200.
We are experiencing a downtrend on the RSI indicator, which is about to break and retest, supporting the upward trend.
We are looking for stability above the 100 Moving Average.
Entry price: 0.7358
First target: 0.7510
Second target: 0.7700
Third target: 0.7946
