ADAUSD Is this 1W Golden Cross what the market needs??Cardano (ADAUSD) just formed a 1W Golden Cross this week, the first in its history, amidst a continuous bearish sequence since the December 02 2024 High. With its 1W RSI just below neutrality, this simply highlights the undervalued condition of this token relative not only to the rest of the high cap market, but also to its previous Bull Cycle.
As you can see, based both on 1W RSI and price action terms, we may be in a consolidation phase similar to September - November 2020, at the end of a Megaphone pattern. That pattern was the Accumulation vessel of the Cycle that led to the massive 2021 parabolic rally and the eventual Cycle Top / Higher High of the historic Channel Up.
According to that, we should be expecting a 1.236 Fibonacci extension test, targeting $5.000.
-------------------------------------------------------------------------------
** Please LIKE 👍, FOLLOW ✅, SHARE 🙌 and COMMENT ✍ if you enjoy this idea! Also share your ideas and charts in the comments section below! This is best way to keep it relevant, support us, keep the content here free and allow the idea to reach as many people as possible. **
-------------------------------------------------------------------------------
💸💸💸💸💸💸
👇 👇 👇 👇 👇 👇
Adausdsignals

CARDANO about to form its first ever 1W Golden Cross!Cardano (ADAUSD) is far from dead as not only has it staged a rebound on its 1W MA50 (blue trend-line) but is also close to forming its first ever Golden Cross on the 1W time-frame. Technically this is a similar set-up to November 2020 right after ADA held its 1W MA50, made a Higher Low on its 1W RSI (like today) and started to rise.
This rise ended up forming the top of the 7-year Channel Up just below the 1.236 Fibonacci extension from the previous Cycle High. Basically this whole Bull Cycle has been identical to the December 2018 - December 2020 and right now it appears that the market has started the final parabolic rally.
If the pattern approaches the 1.236 Fib extension again, expect the Cycle to peak around $5.000.
-------------------------------------------------------------------------------
** Please LIKE 👍, FOLLOW ✅, SHARE 🙌 and COMMENT ✍ if you enjoy this idea! Also share your ideas and charts in the comments section below! This is best way to keep it relevant, support us, keep the content here free and allow the idea to reach as many people as possible. **
-------------------------------------------------------------------------------
💸💸💸💸💸💸
👇 👇 👇 👇 👇 👇

ADA/USD "Cardano vs U.S Dollar" Crypto Market Heist Plan🌟Hi! Hola! Ola! Bonjour! Hallo! Marhaba!🌟
Dear Money Makers & Thieves, 🤑 💰🐱👤🐱🏍
Based on 🔥Thief Trading style technical and fundamental analysis🔥, here is our master plan to heist the ADA/USD "Cardano vs U.S Dollar" Crypto Market. Please adhere to the strategy I've outlined in the chart, which emphasizes short entry. Our aim is the high-risk Green Zone. Risky level, oversold market, consolidation, trend reversal, trap at the level where traders and bullish thieves are getting stronger. 🏆💸Book Profits Be wealthy and safe trade.💪🏆🎉
Entry 📈 : "The vault is wide open! Swipe the Bearish loot at any price - the heist is on!
however I advise placing Sell limit orders within a 15 or 30 minute timeframe. Entry from the most recent or closest low or high level should be in retest.
Stop Loss 🛑: Thief SL placed at (0.7000) swing Trade Basis Using the 3H period, the recent / swing high or low level.
SL is based on your risk of the trade, lot size and how many multiple orders you have to take.
Target 🎯: 0.5200 (or) Escape Before the Target
🧲Scalpers, take note 👀 : only scalp on the Short side. If you have a lot of money, you can go straight away; if not, you can join swing traders and carry out the robbery plan. Use trailing SL to safeguard your money 💰.
📰🗞️Fundamental, Macro, COT Report, Sentimental Outlook:
ADA/USD "Cardano vs U.S Dollar" Crypto Market is currently experiencing a Bearish trend in short term, driven by several key factors.
⚡⭐Fundamental Analysis
Market Capitalization : Cardano's market capitalization stands at $23.12 billion USD, with a circulating supply of 35.21 billion ADA.
Tokenomics : The total supply of ADA is capped at 45 billion, with a significant portion already in circulation.
Blockchain Technology : Cardano's blockchain technology is based on the Ouroboros consensus algorithm, which provides a secure and energy-efficient way to validate transactions.
Development Activity : The Cardano development team is actively working on improving the blockchain's scalability, interoperability, and usability.
Partnerships and Collaborations : Cardano has partnered with various organizations, including universities, research institutions, and businesses, to promote the adoption of its blockchain technology.
⚡⭐Macro Economics
Inflation : The current inflation rate is not explicitly stated, but it's essential to consider its impact on the cryptocurrency market. Rising inflation can lead to increased adoption of cryptocurrencies as a store of value.
Interest Rates : Interest rates can influence the attractiveness of cryptocurrencies like ADA. Higher interest rates can make traditional investments more attractive, potentially reducing demand for cryptocurrencies.
Global Economic Growth : The global economy is experiencing a slowdown, which can impact the demand for cryptocurrencies. However, some investors may view cryptocurrencies as a safe-haven asset during times of economic uncertainty.
Regulatory Environment : The regulatory environment for cryptocurrencies is constantly evolving. Changes in regulations can impact the adoption and price of cryptocurrencies like ADA.
⚡⭐Global Market Analysis
Trend: The ADA/USD pair is experiencing a mixed trend, with a 4.27% increase in the last 24 hours, but a 12.92% decrease in the last week.
Support and Resistance: Key support levels are at $0.63 and $0.61, while resistance levels are at $0.68 and $0.70.
⚡⭐COT Data
Speculators (Non-Commercials): The current COT report shows that speculators are holding 26,729 long positions and 9,961 short positions.
Hedgers (Commercials): Hedgers are holding 7,275 long positions and 24,341 short positions.
⚡⭐On-Chain Analysis
Transaction Volume: The 24-hour transaction volume for ADA is approximately $868.36 million USD.
Active Addresses: The number of active addresses on the Cardano network is not provided.
⚡⭐Market Sentiment Analysis
Sentiment: The overall sentiment for ADA/USD is neutral, with a mix of bullish and bearish predictions.
Fear and Greed Index: The current fear and greed index reading is not available.
⚡⭐Positioning
Long/Short Ratio: The long/short ratio for ADA/USD is not provided.
Open Interest: The open interest for ADA/USD is approximately $776.6 million USD.
⚡⭐Next Trend Move
Bullish Prediction: Some analysts suggest a potential bullish move, targeting $0.70 and $0.80.
Bearish Prediction: Others predict a potential bearish move, targeting $0.52 and $0.50, due to the recent downward trend and potential selling pressure.
⚡⭐Overall Summary Outlook
Bullish or Bearish: The overall outlook for ADA/USD is neutral, with a mix of bullish and bearish predictions.
Real-Time Market Feed: As of the current time, the ADA/USD price is $0.66, with a 0.42% increase in the last 24 hours.
📌Keep in mind that these factors can change rapidly, and it's essential to stay up-to-date with market developments and adjust your analysis accordingly.
⚠️Trading Alert : News Releases and Position Management 📰 🗞️ 🚫🚏
As a reminder, news releases can have a significant impact on market prices and volatility. To minimize potential losses and protect your running positions,
we recommend the following:
Avoid taking new trades during news releases
Use trailing stop-loss orders to protect your running positions and lock in profits
💖Supporting our robbery plan 💥Hit the Boost Button💥 will enable us to effortlessly make and steal money 💰💵. Boost the strength of our robbery team. Every day in this market make money with ease by using the Thief Trading Style.🏆💪🤝❤️🎉🚀
I'll see you soon with another heist plan, so stay tuned 🤑🐱👤🤗🤩

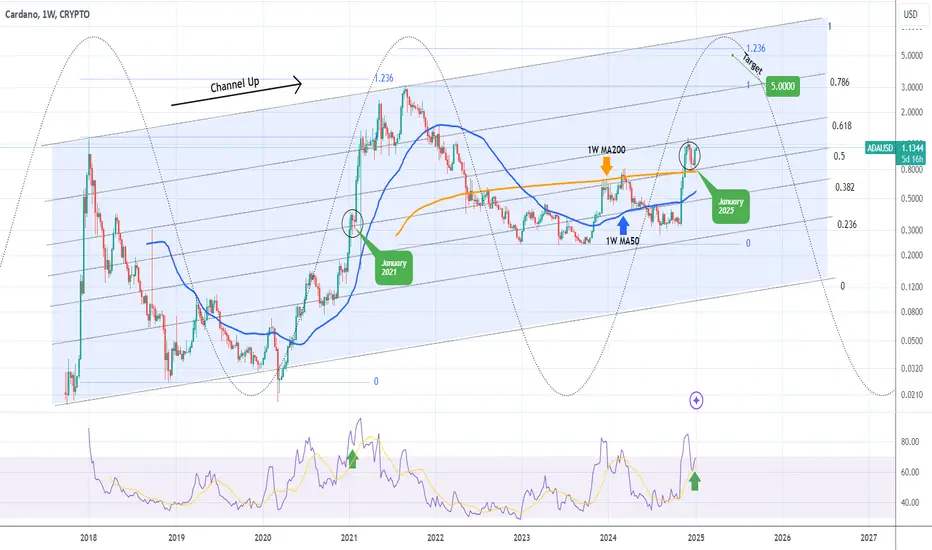
CARDANO Mega rally starting first to $3 then top expected at $5Last time we looked at Cardano (ADAUSD) we gave a confident medium-term buy signal (November 18 2024, see chart below):
Today, having seen a very strong closing to the year last week and especially since the price bounced off the 1W MA200 (orange trend-line), we are making a long-term call towards the top of the Cycle.
Technically ADA's historic pattern is a Channel Up and if we draw its Fibonacci levels, the price is currently within the 0.5 - 0.618 range. That is exactly where it was during the same stage of the previous Cycle in January 2021. As the 0.5 Fib held, once it closed a 1W candle above the 0.618, the price skyrocketed to the 0.786 Channel Fib and tested the previous All Time High (ATH).
We can see the amazing symmetry between the Cycles on the 1W RSI fractals too. As a result, our next immediate Target for ADA is near the previous ATH at $3. Beyond that, we expect the Cycle to top at $5, which is marginally below the 1.236 Fibonacci extension, which was where the August 2021 Cycle Top was priced.
-------------------------------------------------------------------------------
** Please LIKE 👍, FOLLOW ✅, SHARE 🙌 and COMMENT ✍ if you enjoy this idea! Also share your ideas and charts in the comments section below! This is best way to keep it relevant, support us, keep the content here free and allow the idea to reach as many people as possible. **
-------------------------------------------------------------------------------
💸💸💸💸💸💸
👇 👇 👇 👇 👇 👇
CARDANO 1D Golden Cross pushing for Resistance breakout to $1.40Last time we looked at Cardano (ADAUSD) was on September 24 (see chart below), when we called for the strongest buy signal in a year:
It couldn't have been more timely as we went from a 0.3690 price to 0.8200, a +120% rise. This High is also testing the March 14 2024 High, currently Resistance 2. The market just formed a 1D Golden Cross and last time it had one was exactly 1 year ago (November 18 2023). Soon after Resistance 2 broke and the price reached a little above the 2.0 Fibonacci extension. Even the 1D RSI is on a similar fractal.
As a result, once ADA closes a 1D candle above Resistance 2, we will target $1.400 (Fibonacci 2.0 extension).
-------------------------------------------------------------------------------
** Please LIKE 👍, FOLLOW ✅, SHARE 🙌 and COMMENT ✍ if you enjoy this idea! Also share your ideas and charts in the comments section below! This is best way to keep it relevant, support us, keep the content here free and allow the idea to reach as many people as possible. **
-------------------------------------------------------------------------------
💸💸💸💸💸💸
👇 👇 👇 👇 👇 👇

CARDANO flashing the strongest buy signal in 1 yearCardano (ADAUSD) just gave the strongest long-term buy signal possible on the 1W time-frame as the 1W LMACD is forming a Bullish Cross. That is the first such formation in almost 1 year (since October 09 2023), indicating that we have the most powerful buy signal at hand.
The 1W RSI has been ranging since May, practically for the majority of the time that ADA has been trading below its 1W MA50 (blue trend-line).
Basically as you can see all the above conditions are identical to the previous Bull Cycle, where a Bullish Megaphone emerged on a 1W LMACD Bullish Cross and after a 1W MA50/ MA100 Bullish Cross, the bottom was formed, while the 1W RSI was consolidating.
This time we have all these formations emerged again, so any week now, Cardano could start its new Parabolic Rally. With a Higher Highs trend-line setting a clear Resistance, we see a $5.00 price as a strong Target for the Cycle Top.
-------------------------------------------------------------------------------
** Please LIKE 👍, FOLLOW ✅, SHARE 🙌 and COMMENT ✍ if you enjoy this idea! Also share your ideas and charts in the comments section below! This is best way to keep it relevant, support us, keep the content here free and allow the idea to reach as many people as possible. **
-------------------------------------------------------------------------------
💸💸💸💸💸💸
👇 👇 👇 👇 👇 👇

ADAUSD Is targeting 0.850 by the end of the year.Cardano (ADAUSD) is currently trading within the 1D MA200 (orange trend-line) and 1D MA50 (blue trend-line) for most of May. This consolidation is most likely the new Accumulation Phase for the next price jump and the reason is an old chart that we published last year, comparing the 2022/23 Cycle with 2018/19.
So far it has been remarkably similar, with the Bear Cycle being a decline of around -93% on both occasions, within a Channel Down pattern that bottomed on an Inverse Head and Shoulders. The first significant upside target in 2019 was the 0.5 Fibonacci retracement level. That is currently a little over 0.850 and since the Cycle has been following the previous one so closely so far, we see no reason not to continue to do so.
-------------------------------------------------------------------------------
** Please LIKE 👍, FOLLOW ✅, SHARE 🙌 and COMMENT ✍ if you enjoy this idea! Also share your ideas and charts in the comments section below! **
-------------------------------------------------------------------------------
💸💸💸💸💸💸
👇 👇 👇 👇 👇 👇

CARDANO Historic Cup & Handle slowly starting the new BullCycle?Cardano (ADAUSD) is having a good start for the year as the price is about to hit the 3D MA50 (blue trend-line). This is the level that has been unbroken since November 15 2021, basically throughout almost the whole Bear Cycle. As you realize a break-out above it would be a major bullish development for Cardano. Such a break on January 07 2019, was what effectively confirmed the start of the previous Bull Cycle.
At the same time, the RSI broke above its Lower Highs trend-line, which is exactly what happened this week. As you see, based on the Jan 2019 fractal, an RSI pull-back now would mean short-term loss of strength for ADA but when a full 3D candle closed above the MA50, the price made the break-out towards the 3D MA200 (orange trend-line). Its target was the 0.382 Fibonacci and this is what we will target (0.6400), in case we get that candle closing above the MA50.
This time however, ADA has another strong pattern to support the idea of a new Bull Cycle and that is its historic Cup and Handle (C&H) pattern that has been trading in since January 2018. As you see, the current Bear Cycle (being within a Channel Down) can be viewed as nothing but the Handle of the Cup. Technically the target on such patterns in extremely high, which would be unrealistic based on its market capitalization, but holders can finally start believing a little more to new All Time Highs for ADA. For now take a quarterly step at a time and use the 0.382 Fib and 3D MA200.
-------------------------------------------------------------------------------
** Please LIKE 👍, FOLLOW ✅, SHARE 🙌 and COMMENT ✍ if you enjoy this idea! Also share your ideas and charts in the comments section below! **
-------------------------------------------------------------------------------
💸💸💸💸💸💸
👇 👇 👇 👇 👇 👇

ADAUSDT Major rebound to the 1D MA50, unbroken in over 1 month.*** ***
For this particular analysis on Cardano we are using the ADAUSDT symbol on the OKX exchange.
*** ***
The idea is on the 1D time-frame where ADA is following the general market bullish sentiment (led by Bitcoin), rising by more than +15% in a day and is about to hit the 1D MA50 (blue trend-line). This level has been unbroken since September 13. The first short-term bullish break-out was done today as in the meantime, the price broke above the (dashed) Lower Highs trend-line of the September 10 High.
A break above the 1D MA50, would be the second short-term bullish break-out and can target the top (Lower Highs trend-line) of the Falling Wedge pattern that is dictating the trend since the May collapse. A break above that level, if it coincides with a break above the 1D MA200 (orange trend-line), would be a medium-term bullish break-out and targets the August 15 High. The level that would shift the trend back to long-term bullish territory would be the 0.6900 May 13 High.
Note that an additional signal for a medium-term bullish break-out to pay attention to, would be the RSI (on the 1W time-frame) breaking above the 40.17 Resistance, which made a Double Top so far both on August 14 and September 11.
-------------------------------------------------------------------------------
** Please LIKE 👍, SUBSCRIBE ✅, SHARE 🙌 and COMMENT ✍ if you enjoy this idea! Also share your ideas and charts in the comments section below! This is best way to keep it relevant, support me, keep the content here free and allow the idea to reach as many people as possible. **
-------------------------------------------------------------------------------
You may also TELL ME 🙋♀️🙋♂️ in the comments section which symbol you want me to analyze next and on which time-frame. The one with the most posts will be published tomorrow! 👏🎁
-------------------------------------------------------------------------------
👇 👇 👇 👇 👇 👇
💸💸💸💸💸💸
👇 👇 👇 👇 👇 👇

ADAUSDT ShortTime Frame: 4H
Symbol: ADAUSDT
Entry: 0.3815
TP: 0.3615
SL: 0.3941
Bias: Short
We are bearish. The price may move further down and create an ambience for a short term selling opportunity.

ADAUSD Doesn't seem to be able to get out of its bearish trend.Cardano (ADAUSD) got rejected 6 days ago exactly at the top (Lower Highs trend-line) of the long-term Channel Down pattern that it has been trading in since the September 02 2021 market High. This is the 4th Lower High rejection of this structure and when that happened in the past, a strong rejection followed.
Cardano has been trading sideways for basically 3 months (since the June 18 low). As you see this has the potential to extend a green Channel if the price breaks above the Lower Highs. Until then, it would be best to sell again only if the 0.400 Support (July 13 Low) breaks and target the 2.0 Fib extension. A break above the Lower Highs though should extend this 3 month neutral trade and test first the 1W MA200 (red trend-line), which has been basically the Resistance during these 3 months, and secondly the 1D MA200 (orange trend-line) for the ultimate long-term trend test.
When ADA breaks and closes above the 1D MA200, then and only then we can consider a long-term shift of fortunes from bearish to bullish. The Bullish Cross on the MACD (on the 1W time-frame) could be an early indication of such a move.
--------------------------------------------------------------------------------------------------------
** Please support this idea with your likes and comments, it is the best way to keep it relevant and support me. **
--------------------------------------------------------------------------------------------------------

ADAUSD Moment of truth for CardanoCardano (ADAUSD) has suffered a strong pull-back along with the majority of the crypto market last week, dropping again below its 1D MA50 (blue trend-line) for the first time in almost 1 month. Still, it is so far contained within the short-term Channel Up that started after the July 13 Low.
The RSI on the 1W time-frame may be showing a smooth reversal to the upside since May 29 but if the July 13 Low breaks, the bearish dynamics of the long-term Channel Down may come into play again and as with the April 30 break, may lead to a Lower Low at or below the 2.0 Fibonacci extension, which is now at $0.275. As long as the Channel Up is sustained however, Cardano will most likely make a Channel Up Higher High right on time to test the 1D MA200 (orange trend-line) for the first time since November 24 2021!
Certainly this seems to be the moment of truth for ADA.
--------------------------------------------------------------------------------------------------------
** Please support this idea with your likes and comments, it is the best way to keep it relevant and support me. **
--------------------------------------------------------------------------------------------------------

ADAUSDT LongTime Frame: 4H
Symbol: ADAUSDT
Entry: 0.5290
TP: 0.5618
SL: 0.5044
Bias: Long
The pair will go further up as we see the recent history of price changes. The major crypto pairs are having a boost but it is a trend drawdown before a strong fall.

ADAUSD needs to break the 1D MA50 in order to avoid 0.200.Cardano (ADAUSD) has had repetitive rejections (4 in total) on the 1D MA50 (blue trend-line) since May 31. In fact the last time we saw so many rejections within a long-term Channel Down, was during the previous Bear Cycle of 2018. The inability to sustain a break-out above the 1D MA50, led Cardano to the final hyper aggressive flush of November 2018 that ultimately formed the bottom of the Cycle.
Based on 1D RSI terms we also seem to be on the third (3) and final leg below the collapse, so if ADA holders want to avoid this, they need to see the price break above the 1D MA50 and sustain trading above it for a week at least. Otherwise the completion of a -93% drop from the top is possible at around 0.200.
--------------------------------------------------------------------------------------------------------
** Please support this idea with your likes and comments, it is the best way to keep it relevant and support me. **
--------------------------------------------------------------------------------------------------------

ADAUSD Comparison with 2018 shows the bottomCardano (ADAUSD) has been down for more than -87% since the September 2021 High and has been trading within a Channel Down ever since. This is similar to the pattern of the last Bear Cycle in 2018.
On this 1D time-frame analysis, the 1D MA50 is the blue trend-line and the 1D MA100 the green trend-line. Even though 2018 made a -93.50% dip from the moment the Channel Down started, in terms of 1D RSI and the Fibonacci extension that marginally broke 2.0 Fib, it appears that we in similar price action as early December 2018, which was the bottom of that Cycle. We might see one final dip towards 0.3000, in case ADA follows the candle structure of late Nov - early Dec 2018 but what is more important is that the next time the 1D MA100 breaks, we will most likely have a confirmed recovery and the start of the new Bull Cycle.
--------------------------------------------------------------------------------------------------------
Please like, subscribe and share your ideas and charts with the community!
--------------------------------------------------------------------------------------------------------

CARDANO repeating Ethereum's 2017 break-out?Cardano (ADAUSD) had a major bullish break-out today as it broke above the Channel Down that has been holding since the September 02 2021 High. It remains to be seen if the 1D candle closes above it, but it already looks as if ADA is replicating Ethereum's (ETHUSD) bullish break-out in early January 2017.
It was when ETH broke above the 1D MA50 (blue trend-line) and its long-term Lower Highs trend-line (dashed line). See how the price action that led to this since March 2016 is also quite similar to ADA's price action since May 2021. Same Channel Down, followed by a Higher High, a near Support test and the start of the Lower Highs. Even the RSI fractals are similar.
The 1D MA200 (orange trend-line) on Cardano is currently at 1.558 but dropping fast. Do you think the pattern will continue to play out the exact way as ETH's 2017 and consolidate around the MA200 for a month and then start a parabolic rally? At least that's what ADA's holders would want to see.
--------------------------------------------------------------------------------------------------------
** Please support this idea with your likes and comments, it is the best way to keep it relevant and support me. **
--------------------------------------------------------------------------------------------------------

CARDANO can't get out of this death spiralADAUSD (Cardano) has been trading inside a Channel Down ever since its September 02 2021 All Time High (ATH). That is a significant amount of time it has been on a bearish trend and the pure structure of this Channel Down, doesn't seem to allow much room for hope, at least not yet.
Right now the price appears to have formed a bottom ever since the February 24 Lower Low of the Channel. The same sideways trend was last seen from December 04 to December 20 2021, when ADA again made a Lower Low and after this consolidation, it rebounded back to the 1D MA50 (blue trend-line) and its 0.5 Fibonacci retracement level, before eventually resuming the downtrend.
The similarities between the inner Channel's (dashed patterns) are obvious and this is also illustrated on the 1D RSI fractals which are identical. This time however, the 1D MA50 and the 0.5 Fib are not close to each other (0.974 and 1.115 respectively), so first target the 1D MA50 and if the price action gives a 1D candle close above it, then continue towards the 0.5 Fib (which seems it will make a perfect Lower High on the long-term Channel Down). On the other hand, a closing below the 0.750 Low, may extend the downtrend towards the -0.5 Fib extension and the 1M MA50 (red trend-line).
--------------------------------------------------------------------------------------------------------
Please like, subscribe and share your ideas and charts with the community!
--------------------------------------------------------------------------------------------------------

CARDANO testing a 2 month Resistance level.ADAUSD posted a short-term (for now) rally since the January 10 low that brought the price on the 1D MA100 (green trend-line). That level was last touched on November 10 2021 and has since been turned into a Resistance. A break and 1D candle closing above this trend-line should be considered as a bullish break-out signal that might be the begining of a Parabolic Rally.
There are several other factors that point towards this probability. First of all as this 1D chart shows, Cardano has been trading within a Channel Down (blue) ever since the September top. That Channel was formed straight after a Cup pattern (green). The last time we saw those two patterns one after the other was from February 2020 to November 2020. Both were defined by a sequence of 1D MA50/MA100 Crosses. In November 2020, once the price broke above the 1D MA100, it required a 1D MA50/MA100 Bullish Cross to initiate the Rally. Keep an eye for a potential Bullish Cross if you want to enter ADA on time. Also notice how at the end of each Channel Down, the 1D RSI was rising.
--------------------------------------------------------------------------------------------------------
** Please support this idea with your likes and comments, it is the best way to keep it relevant and support me. **
--------------------------------------------------------------------------------------------------------

ADAUSD Sell Trend.!#ADAUSD Hello trader, I hope are good and safe. Today I opened the chart of #ADAUSD for 15 MIN. and analyzed it then I see that this chart has made a DOWN TREND, So I hope #ADAUSD will go downside,
Now Nice opportunity for short.
If you have any query then leave a COMMENT, LIKE and FOLLOW.
Keep Supporting And Thank You..

ADAUSD Ascending Triangle Pattern#ADAUSD Hello trader, I hope are good and safe. Today I opened the chart of #ADAUSD for 15 Min and analyzed it then I see that this chart has made a ASCENDING TRIANGLE PATTERN, So i hope market in this condition going up and going down,
Now Nice opportunity for long and short.
If you have any query then leave a COMMENT, LIKE and FOLLOW.
Keep Supporting And Thank You..

CARDANO Trading within the 1DMA50-MA200 on this Triangle fractalADAUSD has been consolidating for more than 1 month (since September 20) within the 1D MA50 (blue trend-line) and the 1D MA200 (orange trend-line). This consolidation happens to be inside a Triangle that shares many characteristics with the May - July 2021 Triangle.
As you see the May - July fractal also traded for a similar period with the 1D MA50 and 1D MA200 and when the price broke above the 1D MA50, Cardano started its strong August rally. It's worth pointing out that on that fractal, the price marginally broke below the 1D MA200 for 3 days before breaking above the 1D MA50. However the RSI has already double bottomed. In July the (near) RSI Double Bottom happened to be on the 1D MA200 (marginal) break-out low.
Do you think that ADA has bottomed already and will soon start the rally above the 1D MA50 or there is one last low left to be made below the 1D MA200? Feel free to share your work and let me know in the comments section!
--------------------------------------------------------------------------------------------------------
Please like, subscribe and share your ideas and charts with the community!
--------------------------------------------------------------------------------------------------------

CARDANO Handle almost completed. Last chance to buy before $15?Three weeks ago I made a cross study on Cardano comparing the current Cup and Handle (C&H) it's been trading in since the May High with the same patterns of the recent past:
As you see, the C&H formations are all quite similar and as the Handle of the current pattern is almost completed, I thought it would be a good time to update my idea.
For better comparison purposes for the current analysis, I've included the May 2021 and the August 2020 C&H patterns on the same chart, plotting them on the Fibonacci extension Channel. As you see, when the August 2020 C&H was completed, a two month parabolic rally was initiated. Notice how the handle started just after the 1D MA50 (blue trend-line) and the 1D MA100 (green trend-line) formed a Bullish Cross and was completed after the last low was made on the 1D MA100. The 1D MA50 broke but the 1D MA100 held and supported the rebound that broke the Handle upwards. On the current C&H (May 2021), the price just hit the 1D MA100 on October 06 and is consolidating within that and the 1D MA50 as Resistance. If the pattern is replicated then we should expect the Handle to break very soon and that will give way to the new parabolic rally. Notice that the pre-handle rebounds on both patterns started after a squeeze/ convergence of the 1D MA50 (blue trend-line) and the 1D MA200 (orange trend-line).
If that's the case, then the logical question that should come on mind is how high can this rally go? Well that can be explained using the Fibonacci Channel. The first High of the Channel was naturally on the Fib 1.0. The parabolic rally of the first C&H stopped and made a Higher High on Fib 1.5 (i.e. 0.5 Fib higher than the previous). If this arithmetic sequences continues then the next Higher High (led by the new parabolic rally) should be on Fib 2.0 (i.e. 0.5 Fib higher than the previous). Within a rough two month time-frame, that should be around $15.
This may be the last chance to buy ADAUSD before that rally to $15 and possibly beyond. What do you think? Feel free to share your work and let me know in the comments section!
--------------------------------------------------------------------------------------------------------
Please like, subscribe and share your ideas and charts with the community!
--------------------------------------------------------------------------------------------------------

CARDANO about to rally repeating this Cup & Handle of the past?ADAUSD has been inside a short-term Channel Down/ Bull Flag since the September 02 High, breaking below the 1D MA50 (blue trend-line) but holding so far the 1D MA100 (green trend-line).
This channel/ flag formation can be viewed as the Handle of a much wider/ long-term Cup and Handle (C&H) pattern. As you see on this triple chart analysis, the same C&H pattern was formed twice since the COVID market crash, 1) In August - December 2020 and 2) In February June 2020.
Both patterns held the Handle above the 1D MA100 and a parabolic rally followed straight after. Are we about to witness the same rally on Cardano? What do you think?
** Please support this idea with your likes and comments, it is the best way to keep it relevant and support me. **
--------------------------------------------------------------------------------------------------------
!! Donations via TradingView coins also help me a great deal at posting more free trading content and signals here !!
🎉 👍 Shout-out to TradingShot's 💰 top TradingView Coin donor 💰 this week ==> Vergnes
--------------------------------------------------------------------------------------------------------
