ADA: Ascending Triangle BreakoutCardano (ADA) technical analysis:
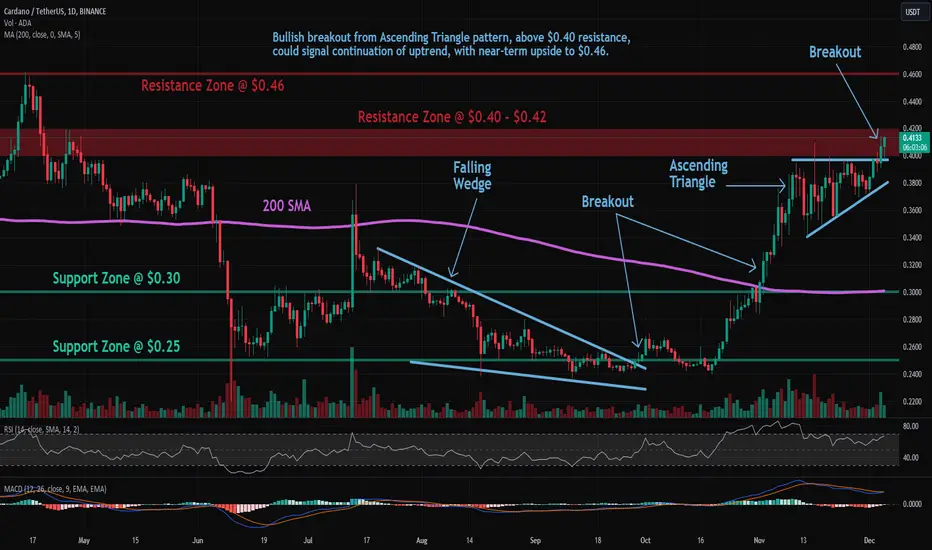
Trade setup : Bullish breakout from Ascending Triangle pattern, above $0.40 resistance, could signal continuation of uptrend, with near-term upside to $0.46. Previously, price broke above 200-day moving average ($0.30), which confirmed a bullish trend reversal to an Uptrend.
Pattern : Ascending Triangle which is a continuation pattern (it typically breaks out in the direction of existing trend). Most traders wait for a breakout but Swing traders could trade between the trendlines (Buy at Support, Sell at Resistance) as long as the trendlines are still relatively far apart.
Trend : Uptrend across all time horizons (Short- Medium- and Long-Term).
Momentum is Mixed as MACD Line is below MACD Signal Line (Bearish) but RSI > 55 (Bullish). MACD Histogram bars are rising, which suggests that momentum could be nearing another upswing.
Support and Resistance : Nearest Support Zone is $0.30 (previous resistance), then $0.25. The nearest Resistance Zone is $0.040 – $0.42, then $0.46.
ADAUSDT
Cardano (ADA) Price Rises With Soaring TransactionsSignaling Institutional Interest Cardano (ADA) Price Rises.
Recent data shared by a renowned analyst suggests a notable surge in Cardano transactions exceeding $100,000 over the past three months. This spike is seen as a potential indicator of heightened interest from institutional players and whales. This also indicates an upcoming price surge for ADA.
The latest data by Cardano Explorer shows that at Epoch 450, 451, and 452, the transactions have significantly seen a rise above 1,500,00. The transaction signifies a strong institutional hold on Cardano.
Cardano’s Flourishing Ecosystem
Recently, the launch of 150 projects and the continuous work on 1,304 projects highlight a vibrant ecosystem. This could be another reason for Cardano’s soaring transactions.
The creation of a staggering 9.1 million native tokens showcases the extensive customization options available on Cardano. Moreover, the establishment of 81,447 token policies exemplifies the diverse utility of Cardano’s asset creation capabilities. This makes Cardano a versatile choice for blockchain projects.
A significant milestone is the processing of 79.2 million transactions, affirming Cardano’s reliability and growing institutional adoption.
In addition to the growth of its ecosystem and network activity, Cardano developers have been working on scaling solutions, increasing node efficiency, and generally strengthening the backend infrastructure. Moreover, the recent completion of Fund11 proposals stands out as a testament to the platform’s dedication to innovation and community-led project funding.
Taking the advancement ground further, Cardano’s recent launch of Girolamo, an internet-enabled generative chatbot also gathered many eyes. Nevertheless, the chatbot is built to respond to a wide range of inquiries, from daily to industry-specific.
The Surging TVL And Price
Cardano’s Total Value Locked (TVL) again skyrocketed above all others. According to Defillama, Cardano’s TVL surged more than 50% within the year reaching $340 million first time in 19 Months.
The top positions are held by Indigo, Minswap, and Liqwid. The top three Dapps hold 78% of the Total Value Locked (TVL) in the Cardano ecosystem.
This came after the recent development in the Cardano (ADA) space as well as the Bitcoin rally. Resembling the same, Cardano (ADA) price saw an increase of 3.10% over the last day and 6.66% over the previous seven days. At the press time, ADA is trading at $0.408803, with $380,221,658.42 worth of trading volume in a day.

#ADA #CardanoIt is moving in an ascending triangle, which can escape from the top of the triangle towards the daily targets and touch the specified targets by breaking the sub-swing of the corner pattern. Therefore, after breaking the triangle and confirming the pullback, it is possible to enter a buy position around the specified targets.

Start renge ADA❤️❤️Thanks for boosting 🚀 and supporting us!
📈Start renge trend and entry to position sell in resistace & buy in support.
📊 (sell) : 0.3946
🔴 Stop Loss : 0.4122
🎯 Take Profit : 0.3441
🔗 For more communication with us, send a message in TradingView.

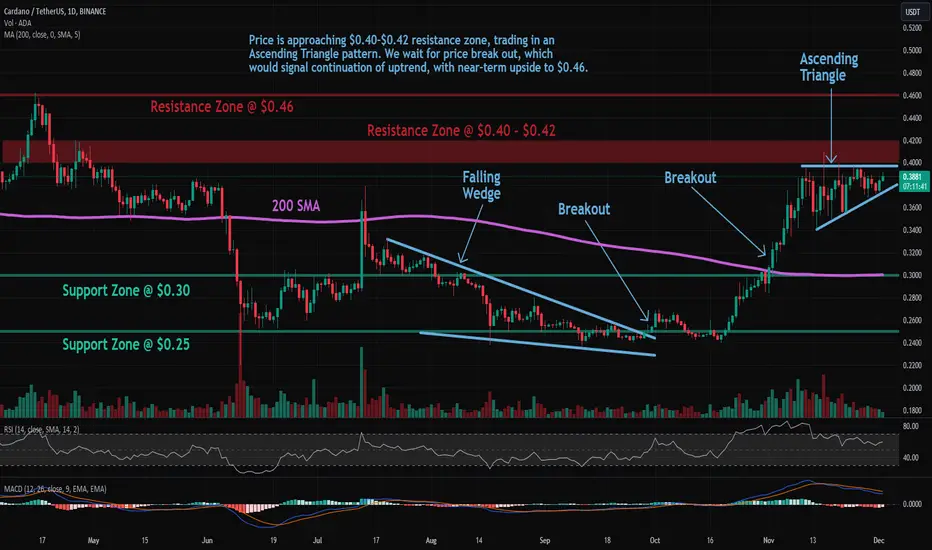
ADA: Ascending TriangleTrade setup : Price is approaching $0.40-$0.42 resistance zone, trading in an Ascending Triangle pattern. We wait for price break out, which would signal continuation of uptrend, with near-term upside to $0.46. Previously, price broke above 200-day moving average ($0.30), which confirmed a bullish trend reversal to an Uptrend.
Pattern : Ascending Triangle which is a continuation pattern (it typically breaks out in the direction of existing trend). Most traders wait for a breakout but Swing traders could trade between the trendlines (Buy at Support, Sell at Resistance) as long as the trendlines are still relatively far apart.
Trend : Uptrend across all time horizons (Short- Medium- and Long-Term).
Momentum is Mixed as MACD Line is below MACD Signal Line (Bearish) but RSI > 55 (Bullish).
Support and Resistance : Nearest Support Zone is $0.30 (previous resistance), then $0.25. The nearest Resistance Zone is $0.040 - $0.42, then $0.46.
ADA/USDT 1DAY UPDATE BY CRYPTOSANDERS !!Hello friends, welcome to this ADA/USDT update from Crypto Sanders.
Chart Analysis:- Cardano landed on its key support at 38 cents this week and, in the process, also registered a 3% loss in valuation. If bulls hold here, then ADA could end its correction.
The current resistance is found at 41 cents, and it may take some time before this cryptocurrency tests it again.
ADA has a good opportunity to reverse and end its correction at this level. If it fails and the current support falls, then the price is likely to go to 35 cents next.
I have tried to bring the best possible results in this chart.
If you like it, hit the like button and share your charts in the comments section.
Thank you.

CARDANO: Hydra update Bullish for ADAHi Traders, Investors and Speculators of Charts📈📉
Ev here. Been trading crypto since 2017 and later got into stocks. I have 3 board exams on financial markets and studied economics from a top tier university for a year 🏫
Cardano (ADA) has gained significant global recognition as a blockchain platform due to its emphasis on scalability, security, and interoperability. Frederik Gregaard, CEO of the Cardano Foundation, recently shared his vision for potential use cases, envisioning a future where Cardano plays a pivotal role in areas such as supply chain management, digital identity, and decentralized finance (DeFi).
In recent developments, Cardano welcomed the launch of Empowa, a new platform built on its network, which aims to address the housing crisis in Africa. Empowa operates as a DeFi platform, providing affordable housing loans to low-income families within the country. The platform operates entirely on Cardano's infrastructure, demonstrating the platform's capability to support innovative solutions.
Furthermore, Cardano has introduced Hydra, a scalability solution designed to enhance its mainnet's transaction throughput. Hydra serves as a layer 2 scaling mechanism that enables a significant increase in transactions per second while maintaining the security and decentralization aspects of the Cardano network. This becomes particularly significant as Ethereum experiences surging gas fees, prompting users to explore alternative options.
Looking ahead, Cardano's founder, Charles Hoskinson, who is also a co-founder of Ethereum, consistently emphasizes the importance of true decentralization as a global imperative. Cardano continues to prioritize scalability, security, and interoperability, attracting developers and entrepreneurs interested in building decentralized applications with practical use cases. With the recent launch of Empowa and the upcoming implementation of Alonzo, Cardano showcases its potential to emerge as a significant player in the realms of DeFi and smart contracts. The introduction of Hydra further strengthens its position as a secure and scalable blockchain platform.
The underlying technology of Cardano and its recent launch have the potential to disrupt traditional financial service providers and institutions in several ways:
Decentralization and Trust: Cardano's blockchain technology operates on a decentralized network, meaning that it does not rely on a central authority or intermediary for transactions and record-keeping. This decentralized nature eliminates the need for traditional financial institutions as middlemen, reducing transaction costs and increasing trust in the system. By leveraging blockchain's transparent and immutable nature, Cardano offers a trustless environment where participants can interact directly without the need for intermediaries.
Scalability and Efficiency: The scalability solutions implemented in Cardano, such as the Hydra protocol, enable the network to process a high volume of transactions per second. This scalability advantage allows Cardano to handle a large number of users and transactions simultaneously, providing efficiency and faster settlement times compared to traditional financial systems that may suffer from bottlenecks and delays.
Lower Costs: Traditional financial institutions often impose high fees for various services, including remittances, loans, and cross-border transactions. Cardano's decentralized infrastructure and smart contract capabilities can significantly reduce costs associated with these services. For example, decentralized finance (DeFi) platforms built on Cardano can provide lending, borrowing, and other financial services at a fraction of the cost compared to traditional intermediaries.
Inclusion and Accessibility: One of the key advantages of Cardano is its potential to provide financial services to underserved populations. By leveraging its interoperability features, Cardano can facilitate cross-border transactions and enable access to financial services for individuals who are unbanked or underbanked. This inclusivity can help bridge the gap between different economic strata, empowering individuals and communities that have been historically marginalized by traditional financial institutions.
Innovation and Smart Contracts: Cardano's platform enables the development and execution of smart contracts, which are self-executing contracts with predefined conditions that automatically execute when the conditions are met. Smart contracts offer a programmable and auditable framework for various financial applications, including decentralized exchanges, lending platforms, and insurance services. The ability to create innovative financial products and services on Cardano opens up new opportunities for entrepreneurs and developers to disrupt the traditional financial landscape.
While the adoption of Cardano and its technology in the mainstream financial industry is still in its early stages, the platform's focus on scalability, security, and interoperability positions it as a potential competitor to traditional financial service providers and institutions. As Cardano continues to evolve and attract more users and developers, its impact on traditional finance could become more significant in the future.
_______________________
📢Follow us here on TradingView for daily updates and trade ideas on crypto , stocks and commodities 💎Hit like & Follow 👍
We thank you for your support !
CryptoCheck
KUCOIN:ADAUSDT COINBASE:ADAUSDT BINANCE:ADAUSDT CRYPTOCAP:ADA COINBASE:ADAUSD KRAKEN:ADAUSD BITFINEX:ADAUSD

Exciting Cardano Rallies with New Resistance Targets!
Cardano (ADA) is on fire, and we have some thrilling updates to share with you. Get ready to long ADA and ride the wave of Cardano's incredible rally!
Cardano has been making some serious waves in the market, and we couldn't be more thrilled. The recent rallies have been nothing short of extraordinary, with ADA showing remarkable strength and resilience. We're excited to announce that our expert analysts have set new resistance targets for Cardano, ranging from 0.38 to 0.41. Yes, you read that right - Cardano is aiming high, and it's time for us to join the party!
Why should you consider long positions on Cardano? Well, let's take a moment to appreciate the immense potential this cryptocurrency holds. Cardano has been making significant strides in the blockchain space, with its innovative technology and commitment to scalability and sustainability. The recent launch of the much-anticipated Alonzo hard fork brings smart contract capabilities to Cardano, opening doors to a world of exciting opportunities.
With the introduction of smart contracts, Cardano is poised to become a leading platform for decentralized applications (DApps) and DeFi projects. The market sentiment is overwhelmingly positive, with investors and developers alike flocking to Cardano's ecosystem. This surge in interest is fueling the ongoing rally, and we firmly believe that the momentum will only continue to grow.
So, what's the call-to-action here? It's time to seize the moment and take advantage of Cardano's upward trajectory. Don't miss out on this thrilling opportunity to long ADA and potentially reap substantial profits. Our team of experts has carefully analyzed the market dynamics and set the resistance targets at 0.39 to 0.41. Now is the time to act, and we encourage you to consider opening long positions on Cardano.
Remember, trading always carries risks, and it's essential to conduct your own research and make informed decisions. However, with Cardano's recent developments and the market sentiment in its favor, the potential rewards are simply too enticing to ignore.
If you're ready to embark on this exciting journey with Cardano, we're here to support you every step of the way. Our team of experienced traders and analysts is available to provide you with valuable insights, market updates, and trading strategies to help you navigate the Cardano rally successfully.
Don't let this opportunity pass you by! Long Cardano (ADA) now and join the ranks of traders who are capitalizing on this thrilling rally. Together, let's ride the wave of Cardano's success!

💎 $ADA : Bull or Bear ? (READ THE CAPTION)By checking the Cardano chart in the daily time frame, we can see that the price with more than 66% growth was able to record the price of 41 cents! Now the price is in a trading range and we have to wait for the price to be stable above or below this range! The supply and demand zones are all marked on the chart and we have to see how the price will react when the price reaches this level!
Please share your opinion about the possible trend of this chart with me and support us with your likes and comments.
Best Regards , Arman Shaban

long or range?!Hello to all my dear friends
As you can see in the chart. Cardano is suffering within the specified range after a huge upswing. which can have two modes. Either a bullish flag pattern that will have an upward trend or suffer again and get out of its support mode. We have to wait to see what the market will do...

Cardano ADA - Bull Cycle - BUY & HODLCardano is getting ready for Black Friday.
It's on Sale, and it's time to lead some more, on each big dip.
ADAUSD ( ADAUSDT , ADABUSD ) is showing a "beautiful" Reversal Pattern.
I am holding and loading more.
My next good level: $0.15 .
Technicals:
* Elliott Wave A-B-C Pattern
* Fibonacci Retracement
* Demand Zone
* Cycle Analysis
* Bullish Divergence
My Fibonacci Time Zones tell me that early '23 is BOOMING!
One more dip please, and then we wait for Valhalla.

AI Integration Deepens in Cardano with Girolamo Chatbot LaunchCardano integrates AI with Girolamo launch, advances in blockchain with Mithril, and prepares for a pivotal governance vote.
Cardano (ADA), a prominent blockchain platform, has taken a significant leap in integrating artificial intelligence with its ecosystem. The recent beta launch of Girolamo, an internet-enabled generative chatbot, marks a pivotal moment in Cardano’s AI journey. This development aligns with Cardano’s ongoing efforts to intertwine blockchain technology and AI, showcasing a blend of innovation and practical application.
Girolamo Launch Marks Cardano’s AI Evolution
Girolamo, named after the renowned Italian mathematician Girolamo Cardano, represents a groundbreaking step for Cardano in AI. This chatbot is designed to handle a broad spectrum of queries, from industry-specific to general everyday questions. Remarkably, Girolamo also boasts the capability to generate and interpret images, adding a visual dimension to its functionality.
ADA’s engagement with AI technology traces back to 2021, with the unveiling of Grace, an AI robot developed by Awakening Health. This venture was a collaboration between Hanson Robotics and SingularityNET, a blockchain partner of Cardano. The synergy between blockchain and AI has been a focal point for Cardano, particularly highlighted by the launch of the AGIX converter bridge in the past year.
Charles Hoskinson, the founder of Cardano, reached out to Sam Altman, CEO of OpenAI, proposing a collaboration. This gesture reflects ADA’s aspiration to expand its blockchain ecosystem, potentially exploring a partner chain with OpenAI. Such collaborations signify Cardano’s commitment to staying at the forefront of blockchain and AI integration.
In parallel, ADA’s lightweight wallet, Lace, updated version 1.7.1. This update addresses various issues, including enhancing dApps connectivity with the Lace wallet. These improvements are crucial for streamlining user interactions within the ADA network.
Cardano Advances with Mithril Relay Prototype
Cardano’s decentralization efforts took a step forward with the Mithril team’s completion of the prototype implementation of the Mithril relay. This development is key in enabling peer-to-peer signature broadcasting, a fundamental aspect of decentralized networks.
Moreover, ADA is gearing up for a significant governance milestone. The community is preparing for a special ballot vote under CIP-1694, focusing on assessing advancements in on-chain and off-chain governance. The snapshot for participating wallets was taken on November 21, with the voting process scheduled from December 1 to December 11.
The series of developments in the ADA ecosystem has been met with optimism in the cryptocurrency market. Following the announcements, ADA, Cardano’s native cryptocurrency, saw a positive price movement. In the last 24 hours, ADA experienced a price increase of 0.40%, trading at $0.3937.

ADA ANALYSIS🔮 #ADA Analysis 🚀🚀
💲💲 #ADA was trading in a descending triangle pattern and breakout the pattern with good volume. Right now #ADA is trading in a parallel channel. The greater the consolidation, the greater is the possibility of price increase in #ADA. 📈📈
💸Current Price -- $0.3926
📈Target Price -- $0.6900
⁉️ What to do?
- We have marked crucial levels in the chart . We can trade according to the chart and make some profits. 🚀💸
🏷Remember, the crypto market is dynamic in nature and changes rapidly, so always use stop loss and take proper knowledge before investments.
#ADA #Cryptocurrency #Consolidation #DYOR

ADAUSDT 1W The price of Cardano has reached an important area in the weekly time frame, which determines the future trend of its price.
🔻 Monitor the price area of 0.38 to 0.41 🔺

Cardano reach resistanceCRYPTOCAP:ADA reach symmetrical triangle resistance at $0.3963,
entering short with $0.3641 as target is a good idea with stop level above previous high at $0.4004
Good luck, dont forget to support this idea.

ADA Elliot Wave for long termNow ADA is on going wave B of 5 correction wave, there'll be 1 leg down to complete wave 5 overall
Dont Fomo!
Correct me If i'm Wrong 😉

ADA / USDTADA is encountering significant resistance at the $0.40 level ✅. There is a possibility of a price pump merely to clear liquidity. If the price demonstrates rejection in the form of a red candle, the next target could be $0.33. Stay vigilant for this potential move in ADA.

I Cannot Short This !!! situation+next targets.ADA has formed double Bottom and the price can grow well from here.
⭐ and the bullish signals of market momentum are:
- divergence in MACD
➡️ Note if the PRZ is broken downwards with the strength of Bearish candles or , this analysis of ours will be failed.
✅Thank you, and for more ideas, hit ❤️Like❤️ and 🌟Follow🌟!

🐳Cardano will Go Up Again🐳As you can see, the price is in a Falling wedge. If the price can break this wedge, we can hope that the price will act like a butterfly pattern and the price will grow well.
❗Weekly Analysis.
⏮️previous Analysis
🤑Stay awesome my friend.
_ _ _ _ _ _ _ _ _ _ _ _ _ _ _ _ _ _ _ _ _ _ _ _ _ _ _ _ _ _ _ _ _
✅Thank you, and for more ideas, hit ❤️Like❤️ and 🌟Follow🌟!
⤵️⤵️⤵️⤵️⤵️⤵️⤵️⤵️⤵️⤵️⤵️⤵️⤵️⤵️⤵️⤵️⤵️⤵️⤵️⤵️⤵️⤵️⤵️

🚀👀 ADA READY to Move ! we are waiting to BTC :) ADA currently in a triangle whose exit will show the further direction. The traffic volume is approximately 15%.
The CHOP Index on a one-day interval is very highly charged.
RSI also ready to move. We are waiting to see what the BTC king will show.
Good Luck !

ADA perspective for short - med termThis is not a signal to buy/sell. NFA
We see the price nowdays are way harder than usual to analyze, "big boys" wont be easy because of sentiment #etf and #halving2024. They'll and still manipulating the price because they wanna control it.
Dont be fanatic or being bullboy, this price has been abnormal hiking without any healthy correction. Better to stay away and dont be FOMO! Or those "big boys" just laughing and enjoying your money.
Good luck, Smart Trader!

ADA Might Break Through The Current Resistance ZoneCardano (ADA)
Cardano is currently trading between a support level of $0.354 and a resistance zone of $0.38-$0.41. This price range has been tested three times over the past two weeks.
If Bitcoin continues its upward trend, the next goal for Cardano would be to reach new highs. In this scenario, ADA could break through the current resistance zone and test the $0.43 level. A subsequent stabilization of its price within the $0.41-$0.43 range is a likely outcome.
On the other hand, should Bitcoin undergo a correction, Cardano might drop to support zones around $0.330-$0.342, $0.325, and $0.305-$0.315. Further declines in ADA's value would largely depend on the trajectory of Bitcoin's price movement.

Cardano is failing at 0.4. I'm looking to sellIn my previous analysis of ADA/USDT, I highlighted that as long as Cardano maintains support above the 0.24 zone, there's a strong likelihood of a reversal towards the range's resistance at the 0.4 zone. Recent optimism in the crypto market has indeed facilitated this movement, with the coin witnessing an approximate 60% surge over the past month.
However, the overall structure for ADA remains range-bound and not decisively bullish. Therefore, a potential retracement could be on the horizon. My strategy is looking for opportunities to sell on any spikes above 0.4, targeting a drop back to the 0.3 level, with a rise above 0.42 negating this outlook.
