ADAUSDT - 4Hr Falling WedgeA falling wedge pattern on the 4Hr chart.
This is coupled with a triple bottom which is seen on the green dashed line.
I expect price to drop a little below the green dashed as a fake out and then allow the falling wedge to take the bulls off.
ADAUSDT

ADA/USDT 1DAT UPDATE BY CRYPTOSANDERS !!hello, welcome to this ADA/USDT update by CRYPTO SANDERS.
CHART ANALYSIS:- Cardano is also found in a flat trend above the key support at 25 cents. For this reason, its price registered a minor loss of 1.3% this week. Sellers were unable to break this support even though they tried several times.
While ADA bulls have shown strength so far, bears could continue to put pressure on the key support. If more tests happen, buyers could become exhausted, which can create an opportunity for a breakdown.
the price action appears fragile to any renewed volatility across the market, particularly if the market leaders such as BTC and ETH decide to drop lower. In such a case, ADA could go to 24 cents again.
I have tried to bring the best possible outcome to this chart.
Hit the like button if you like it and share your charts in the comments section.
Thank you

Cardano touched 0.25 levelHi guys, let's look at the current situaition on Cardano.
My previous idea on Cardano realized for 100% and reached its target at 0.25 level. This downfall was expected as ADA didn't show any willingness to rise somehow and it was just matter of time when it drops. Now some correction is expected, probably even up to 0.3 level but at the moment it sems unlikely.
It all depends on Bitcoin right now and if it continues its fall then Cardano also will drop under 0.25 at least up to 0.2 level.
If this post is useful to you, you can support me with like/boost and leave comments below.
Many thanks.

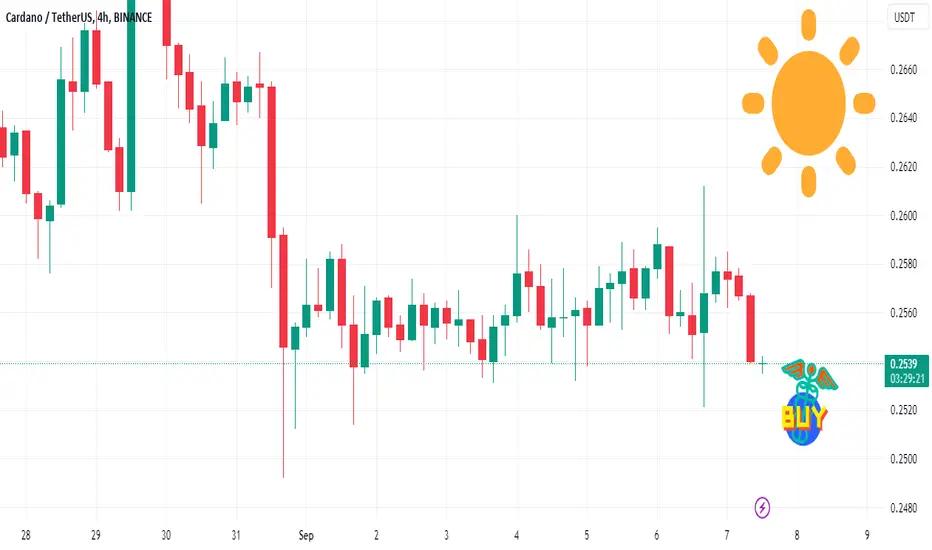
ADA ☀️ In the Next 24 Hrs, Upside PotentialA bearish pressure with both rain and clouds 🌧️ lingers over the global crypto market in the next 24 hours, indicating a downside risk. But Cardano, Dogecoin, and Uniswap shine through the storm with potential. 🌥️
Over a one-week horizon, Bitcoin, Litecoin, XRP, Binance, and other altcoins face continued headwinds and a downward risk, while there's a ray of hope with some sun shining over Ether, Uniswap, and Chainlink, signaling upward potential in the coming week. ☀️🚀
Follow us for more crypto weather reports!
CARDANO - Lower Timeframe Overview On the lower timeframe, we can see that we have 2 entry trendlines in place.
The orange trendline = Risk entry
The red trendline = Safe entry
Trade idea:
- watch for break of either trendline for entry
- once trendline broken, stop loss goes below price
- Targets: 0.38, 0.4, 0.46
Goodluck and as always, trade safe!

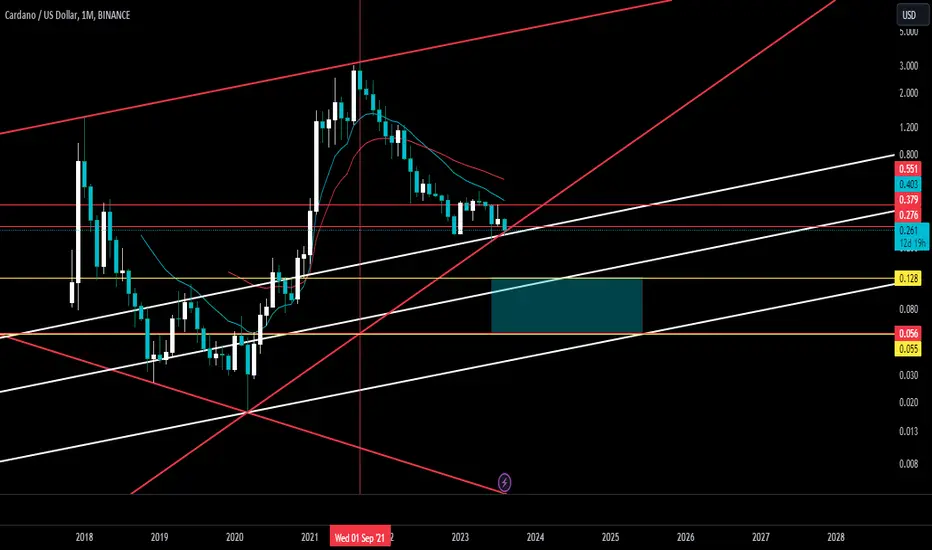
CARDANO - Higher Timeframe Overview ✨For Cardano, we are expecting a deep retracement on a higher timeframe. Deep retracements usually take the shape of zigzag patterns (535). We have completed wave A ( 5 waves ) and currently in subwave C of wave B ( 3 waves ). Our misson is to catch subwave C before riding wave C ( 5 waves ).
See our next post for lower timeframe analysis.
Goodluck and as always, trade safe!

ADA is coin on the long list with the level 0.2571Hello everyone!!!
AIHermes today identified ADA coin on the long list with the level 0.2571
The stop is short.
We see a long accumulation and a gorgeous squeeze!
1st target 0.2609
Trade with us, trade better than us!
Today:
16 coins on the long list
10 coins on the short list.
The lead is in the short zone.
The full list of coins is delivered by our bot every day at 9.00 am

ADA 🌥️ 24-Hr Outlook; 1-Wk Horizon ☁️ 🐻Rain and clouds 🌧️ linger over the global crypto market in the next 24 hours, signaling a slightly or clearly bearish trend with downside risk. 🐻 Cardano, Polkadot, and Uniswap, however, face sunnier, bullish trading conditions with upside potential over the same period. 🌥️
Over a one-week horizon, crypto price predictions are mixed. 📅 Bearish, cloudy trading conditions lie ahead for Bitcoin, XRP, Cardano, and Binance. ☁️ Other crypto coins such as Ether, Litecoin, and Uniswap face sunnier, more bullish trading conditions with upside potential, according to ATTMO. 🚀

Cardano (ADA) - Breaking support towards a major zone?Cardano is at the bottom of its range, on important support. In the same way as other current assets, such as the Binance Coin, losing this zone could send ADA back into a lower zone down to $0.14-$0.17. This would appear to be a very attractive area for accumulation.

ADA - Excellent Zone to Accumulate NOWHi Traders, Investors and Speculators of Charts📈📉
A quick look at Cardano. First, let's establish the Macro Market Phase that we're current trading in. This helps manage realistic price action. ADA is currently in pre-bull market phase / accumulation phase, in other words it is a great time to accumulate for the rally to come with scattered buying orders.
However, this doesn't rule out the possibility of another shakeout or bear trap, where the price drops as low as 20c before starting a new bullish phase.
A look at the technical indictor confirms this for the short term, where we see a very bearish scenario on the daily in terms of Technical Indicator.
Worried about the recent drop in price across crypto markets🤔? Check out this idea :
_______________________
📢Follow us here on TradingView for daily updates and trade ideas on crypto , stocks and commodities 💎Hit like & Follow 👍
We thank you for your support !
CryptoCheck
CRYPTOCAP:ADA BINANCE:ADAUSDT BYBIT:ADAUSDT.P OKX:ADAUSDT.P COINBASE:ADAUSD BINANCE:ADAUSD

Driving Forces Behind Cryptocurrencies' VolatilityIn the ever-evolving realm of modern finance, the emergence of cryptocurrencies has catalyzed a seismic shift, captivating the imagination of investors and traders alike. Since the inception of Bitcoin in 2009, the cryptocurrency market has experienced an unprecedented surge, leading to a proliferation of digital assets, each with its own unique characteristics and potential applications.
However, amid the exhilarating highs and gut-wrenching lows, the cryptocurrency market's intrinsic volatility has left many pondering the enigmatic forces that propel its wild fluctuations. This article embarks on a comprehensive exploration of the fundamental drivers that propel the volatile universe of cryptocurrencies, providing an in-depth analysis of the intricate interplay between a myriad of elements that influence prices and sentiment.
From the far-reaching impact of macroeconomic factors and regulatory dynamics to the revolutionary power of technological advancements and the sway of market sentiment, a complex tapestry of influences collectively shapes the turbulent journey of digital currencies. As the global financial ecosystem grapples with the ongoing evolution of this nascent asset class, acquiring an intimate understanding of these pivotal factors becomes a cornerstone for investors, traders, and enthusiasts navigating this dynamic landscape.
Diving into the Cryptocurrency Mosaic
Cryptocurrencies have transcended their origin with Bitcoin to establish a vibrant and diverse ecosystem of digital assets. Each cryptocurrency possesses a distinct set of attributes, use cases, and underlying technologies, intricately weaving into the intricate fabric of the market.
Broadly categorized, cryptocurrencies fall into two primary groups: coins and tokens. Coins like Bitcoin, Litecoin, and Bitcoin Cash are engineered to facilitate transactions and serve as alternatives to conventional currencies. In contrast, crypto tokens are constructed atop existing blockchain platforms, such as Ethereum, fulfilling functions like governance and ecosystem transactions.
Furthermore, the consensus mechanisms employed by cryptocurrencies contribute to their diversity. The proof-of-work (PoW) mechanism, utilized by Bitcoin and others, relies on mining for transaction validation. Conversely, the proof-of-stake (PoS) mechanism, exemplified by Ethereum and Cosmos, leverages validators to confirm transactions, enhancing energy efficiency and scalability.
Decrypting Cryptocurrency Volatility
Volatility is an intrinsic characteristic of cryptocurrencies, fueled by a confluence of influential factors:
Limited Liquidity: With trading volumes and market capitalization often lower than traditional assets, even modest buy or sell orders can generate substantial price fluctuations.
Speculative Nature: Cryptocurrencies are frequently viewed as speculative instruments, leading to price movements driven by market sentiment, hype, and speculative behavior, rather than fundamental analysis.
Regulatory Ambiguity: As a relatively nascent and lightly regulated market, regulatory developments can trigger abrupt price shifts as investors respond to changes or uncertainties in the legal landscape.
Sentiment Swings: Market sentiment, shaped by events like security breaches or regulatory announcements, can exert considerable influence on cryptocurrency prices.
Manipulation Vulnerability: Due to limited oversight and liquidity in certain markets, cryptocurrencies are susceptible to manipulation by sizable holders, leading to price distortions.
Technological Factors: Technical vulnerabilities or glitches can prompt swift price fluctuations as investors react to perceived risks associated with the underlying technology.
Adoption and Utilization: The practical adoption and use cases of cryptocurrencies significantly influence their value. Currencies with tangible utility and real-world applications tend to garner heightened interest and market support.
Supply and Demand: The fundamental economics of supply and demand guide cryptocurrency prices. Scarce supply coupled with growing demand can propel prices upward.
Macroeconomic Influences: Broader macroeconomic factors, encompassing inflation, interest rates, and geopolitical events, can channel investor attention toward cryptocurrencies as alternative investment vehicles or stores of value.
Influential Figures' Statements: Public endorsements or criticisms from influential figures exert considerable impact on cryptocurrency prices, shaping market perceptions and behavior.
Conclusion
As cryptocurrencies reshape the financial landscape, delving into the driving forces behind their volatility is essential for navigating this dynamic market. From the inception of Bitcoin to the kaleidoscope of digital assets that now flourish, the cryptocurrency market is characterized by its rollercoaster-like price oscillations.
This article has undertaken a comprehensive exploration of the key factors influencing this volatile realm. Regulatory shifts, market sentiment, technological advancements, hacking incidents, and supply-demand dynamics all converge to define cryptocurrency movements. Understanding these multifaceted influences empowers investors, traders, and enthusiasts to navigate the unpredictability of the crypto landscape with poise and informed decision-making.
While cryptocurrencies promise transformation, their journey is marked by rapid evolution and maturation. As the landscape continues to evolve, maintaining vigilance and adaptability remains pivotal. Regardless of your vantage point, comprehending these factors empowers you to seize opportunities and surmount challenges in the captivating realm of digital assets.

ADA - Sunny Breakthrough ☀️ Amidst Crypto's Bearish Clouds ☁️The bearish trend continues in the global crypto market with clouds ☁️ and rain 🌧️ dominating the ATTMO forecasts over the next 24 hours and one-week horizon.
However, Cardano shines ☀️ ahead, indicating a slightly bullish market with upside potential.
Follow us for more crypto weather reports!

ADAUSDTADAUSDTis trading in symmetrical triangle pattern. The price is reacting well the support and resistance of triangle.
Currently the price is at the support of triangle where it is also forming a local support zone and seems like the price may break through the triangle.
If the breakout sustain to upside the optimum target could be 0.2650 followed by 0.2700.

TOTAL3 analysis 1hTotal 3 trend lines are broken and fall to at least 322
The mid-term targets are as follows
318B$
314B$
311B$
309B$
If altcoins fall, they can fall between 5 and 20 percent

ADA: Sunny Outlook 🌞 Rest: Clouds & Sun ⛅ - Bearish Forecast Clouds with some sun ⛅️ breaking through lie ahead over the next 24 hours and one-week horizon. 📊 According to ATTMO, this hints at a slightly bearish market with downside risk.
But wait, there's a ray of hope! ☀️ Cardano is poised to bask in sunnier days over the longer one-week horizon, suggesting a slightly bullish market with upside potential. 🚀
Follow us for more crypto weather reports!

ADA SCALP SHORT SIGNAL Hello dear friends,
In the 15-minute time frame, Cardano has shown a potential setup for a suitable short position.
I am in a hurry to share this post since it is a scalp position, and there is no time for detailed explanations.
Wishing you success and profitability.
Be sure to consider risk management and capital preservation.

ADA: Strong Sun ☀️, Market Shift Ahead ⛅️☔ Bearish Signs Cardano's current market stance is under the influence of a strong sun ☀️, hinting at potential changes ahead. According to ATTMO, an AI-powered crypto weather forecasting tool, this solar presence could signal a forthcoming market correction.☔
Investors and traders are advised to keep a watchful eye on Cardano's movements as it navigates these uncertain skies.
Follow us for more reports!

ADAUSDTThis is a 1D frame analysis for ADAUSDT The price of Bitcoin has tested its static support band for some time and is currently above the support line. The candle has started to move upwards with a shadow a few days ago, and we can expect a price increase, but keep in mind that as long as the price is above the support line, we can expect a price increase. If the price can maintain itself above the support line, it can experience higher prices for a long time. But don't be fooled, it is possible for the price to go slightly higher and be pushed back by selling pressure and experience more volatility. We have mapped out support and resistance areas for you dear friends so that you can use them in different situations.

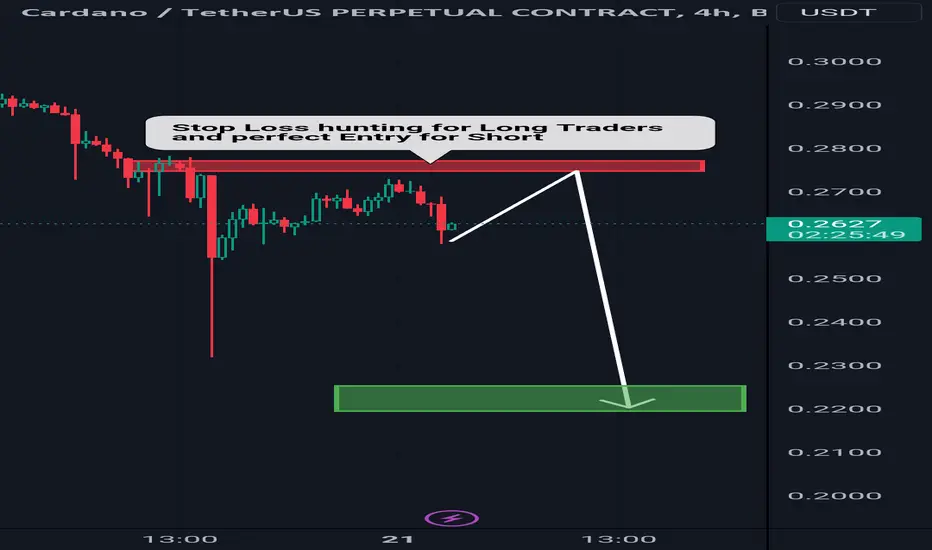
ADA Simple analysis ADA is trading at 0.2620 currently. And there is sell side liquidity above the previous high where are many stop losses of traders. Market will go up to 0.2750 area to grap liquidity and this is my Short Entry. Targeting below the previous low wick on buy side SL hunting.
FIL/USDT 4H: ready for short positionIn the daily time frame, we can see that after breaking the trendline, it could not cross the static resistance (flip zone) and take back the last top
Weakness in price stabilization is evident
In the 4H time frame, we have an upward trend line that the price has penetrated twice and is currently moving tangentially with it. There is also a support zone that has prevented the price from falling
If the trendline and the support zone are broken, we can enter the short position in this area in pullback (according to the drawn scenario)

ADAUSDT → Let's take a look togetherhello guys...
let's check this coin together.
in 4h time frame, this coin engulfed the last higher high but it is on the descending channel so it is risky for getting a long position now.
we can wait until the breakout happens.
what this coin is doing in the upper time frame?!
the bearish trend in a daily time frame:
the bearish trend in the weekly time frame:
what do you think about this coin?!
hold it?!

Ada BottomLooking At market Structure i have previously monthly be critical support ones it possibly brakes down to target is market.