Cardano- Polkadot, Cardano, or any other major cryptocurrencies all feel alike.
- Only the price is different.
- Find Resistance.
- Find Support.
- Master your emotions, learn and gamble at the good time.
Happy Tr4Ding !
ADAUSDT


ADAUSDT IDEAlower lows and a flat. Seems to be a trade opportunity which ever side it goes off breaking its current structure.

Cardano UpdateA lot of you have been DMing me asking for altcoin analysis. i hear you, but here's the truth:
- Right now, most altcoins are simply too weak to offer a reliable forecast. I prefer to post when timing makes sense, not just for engagement, but to avoid misleading anyone.
- BTC Dominance is still heavily suppressing the altcoin market, and I’d rather wait than risk rekting my followers with premature calls.
So why do I post about Cardano? :
- Simple, Cardano is one of the most established altcoins. It makes sense to track its evolution alongside Bitcoin and Ethereum. When you're analyzing the broader market cycle, starting with BTC, ETH, and ADA gives meaningful context. Newer cryptocurrencies from 2020+ don’t have the same historical data, which makes reliable analysis much harder.
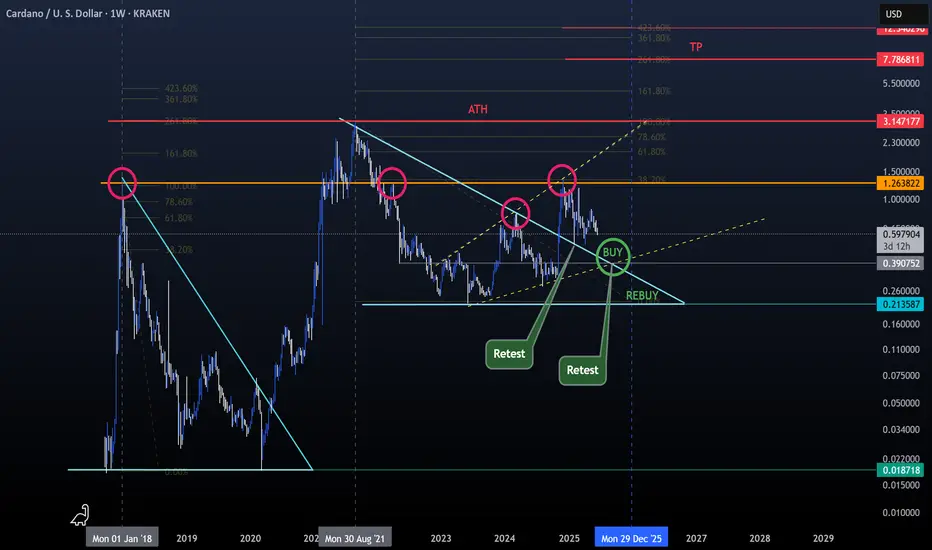
Back to Trading (Everything is marked on the chart for easier reading) :
- Cardano got rejected around $1.25, which aligns with its 2018 ATH, a key historical resistance.
- Check the bullish megaphone pattern and how it connects with the trendline and that $1.25 level (marked with yellow dotted lines).
- Also observe the minor bounces and retests above the bearish triangle trendline (light blue).
What we can do now?
- Nothing. If BTC dips, altcoins will likely follow and get rekt.
Best strategy for now:
- Consider setting a buy order around $0.41 (don’t go all in).
- Keep some dry powder in case of further downside, potentially to rebuy around $0.21 if pressure continues.
Be wise, be patient, ride the wave, don’t fight it.
Happy Tr4Ding !
#ADA/USDT#ADA
The price is moving within a descending channel on the 1-hour frame and is expected to break and continue upward.
We have a trend to stabilize above the 100 moving average once again.
We have a downtrend on the RSI indicator that supports the upward move with a breakout.
We have a support area at the lower limit of the channel at 0.6300, acting as strong support from which the price can rebound.
Entry price: 0.6360
First target: 0.6460
Second target: 0.6580
Third target: 0.6700

Cardano and Diametric Pattern
We are currently in wave-g of the Diamond Diametric and it could continue to 0.43.
After the completion of the Diametric, if the Double Combination pattern does not form, we expect an uptrend to form. (The post-pattern movement will show us whether the Diametric has completed or not).
Good luck
NEoWave Chart

ADAUSDT Is Warming Up for a Major MoveYello, Paradisers! Did you notice what just happened on ADAUSDT? After sweeping liquidity, the pair has now printed a bullish internal change of character (I-CHoCH), confirmed by bullish divergence. This confluence significantly increases the probability of a bullish move from here—but only if you play it smart.
💎From the current price levels, the risk-to-reward ratio isn’t the most attractive for conservative entries. Aggressive traders might still consider taking a position with a tighter invalidation, but the trade needs to be managed with precision.
💎For those who prefer safer setups, it’s much wiser to wait for a pullback into the key support zone. A confirmed retest from there could offer a much cleaner risk-to-reward structure and a clearly defined invalidation level.
💎However, if the price breaks down and closes below that invalidation level, this entire bullish setup becomes invalid. In that case, it's best to stay patient and wait for a new structure to form before jumping back in. Entering too early in uncertain territory can turn a high-probability setup into a costly mistake.
🎖Strive for consistency, not quick profits. Treat the market as a professional, not a gambler. Discipline and timing are what separate the winners from the crowd. Be patient, wait for the high-quality trades, and execute with confidence. That’s how long-term success is built in this game.
MyCryptoParadise
iFeel the success🌴

ADA's situation+ Target PredictionThe price on the daily timeframe is within a triangle, which can create some uncertainty about which direction it will move. Here, we should wait to see which side of the triangle the price breaks out from. Remember, the trend is our friend.
Best regards CobraVanguard.💚

Cardano Weekly, UpdateCardano weekly doesn't look as good as XRP and Ethereum, this is true because I am using the same indicators.
Here we can see ADAUSDT trading below EMA34 and MA200. We can even see an attempt this week to move higher followed by a rejection, this means that there can be some more bearish action before higher prices but this bearish action can easily happen short-term. Why? Because Cardano has already been dropping for five weeks straight.
The rise from the 7-April low lasted a total of six weeks. The week that produced the peak is also the first week of lower prices. So we can say 6 weeks up and four weeks down, or, five weeks up and five weeks down.
The thing is that the market seeks balance and this retrace is already big enough and has been going long enough. Yes, the action is happening below these moving averages but this can easily change.
Short-term bearish.
» ADAUSDT will continue bearish as long as it trades weekly below the $0.7050 - $0.6875 price range. When ADAUSDT moves and closes above this range, the bullish bias is confirmed. Any trading below and we wait.
Thank you for reading.
Your support is appreciated.
Namaste.

Cardano, What To Expect!The action is turning bearish after a very weak bounce from "higher low" on the chart. There is a sequence of local lower highs on ADAUSDT daily. What to expect?
Expect a test of the "higher low" zone as support and this zone breaking. The next level that will come into question is the "main support" but this one isn't likely to be tested.
Picture the action going lower towards support and ending right in between 'higher low' and 'main support'. This is the main scenario.
This scenario will keep the broader bullish structure intact and at the same time would end as a major market flush. As many weak hands as possible are removed and yet the bulls will remain in control.
Make no mistake, whatever happens in the short-term, Cardano will continue to grow. This is only a temporary event. Patience is key.
Thanks a lot for your continued support.
Namaste.

ADA | Liquidity Drain or UPSIDE POTENTIAL??ADA is lacking behind in terms of altcoins this season. We've not yet seen the new highs or parabolic increases that is due for a new BTC ATH.
We're seeing higher highs, and higher lows in the macro which is a bullish sign - indicating the trend is still BULLISH
From the macro, we do see a better picture.. at least THIs time around, the accumulation cycle isn't in such a tight range, and you could day trade / swing trade:
_______________
BINANCE:ADAUSDT

Be careful with ADA !!!Finally, the price broke the wedge, and the price experienced a significant drop. I think is the time for btc to rise again to 0.73 after more correction . STRONG SUPPORT 0.67
Give me some energy !!
✨We spend hours finding potential opportunities and writing useful ideas, we would be happy if you support us.
Best regards CobraVanguard.💚
_ _ _ _ __ _ _ _ _ _ _ _ _ _ _ _ _ _ _ _ _ _ _ _ _ _ _ _ _ _ _ _
✅Thank you, and for more ideas, hit ❤️Like❤️ and 🌟Follow🌟!
⚠️Things can change...
The markets are always changing and even with all these signals, the market changes tend to be strong and fast!!

ADA road map (4h)What I currently expect is that the price could correct slightly, as shown on the chart, and then pump by about 13% from the PRZ (Price Reversal Zone). This signal is strengthened by the presence of strong positive divergence. In summary, the PRZ is a good entry point, derived from the confluence of touchlines and pivots. However, if the price ignores this zone and drops below it, my analysis will be invalidated.
Best regards CobraVanguard.💚

ADA(based on NEowave)this branch of Cardano is diamond diametrical but I didnt count the other branches and the larger degrees but based on ETH and other Altcoins I think it will pump soon.

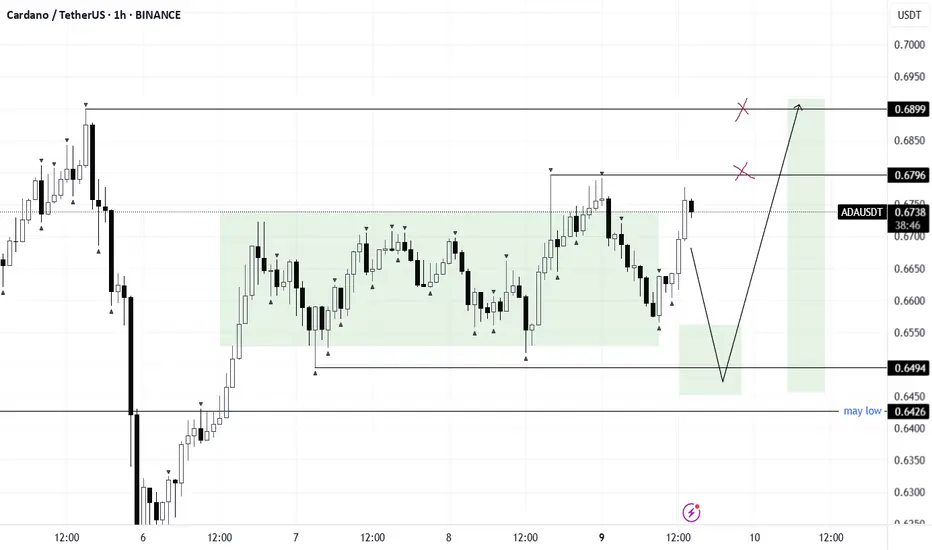
ADA/USDTADA is currently in a local consolidation phase.
After a liquidity grab/manipulation sweep, we can start watching for long opportunities.
🎯 Upside target: $0.68 – $0.69
📊 Waiting for confirmation post-manipulation to trigger entries. Patience is key — setup is forming.
TradeCityPro | ADA: Holding Key Support Inside Descending Channe 👋 Welcome to TradeCity Pro!
In this analysis, I want to review the ADA coin for you, one of the most popular cryptocurrencies, currently ranked 10th on CoinMarketCap with a market cap of 23 billion dollars.
📅 Daily Timeframe
As you can see in the daily timeframe, the price is fluctuating between two key support and resistance zones. Additionally, there's a descending channel in play, and the price has recently been rejected from the top of this channel and moved down to the support zone.
✨ The 0.61 zone is a very strong area, and the price has reacted to it multiple times. It was broken once, but as the price reached the bottom of the channel, it was supported again and moved back above the level — indicating a possible fakeout.
✔️ If this zone is broken again, the likelihood of another drop toward the 0.5579 level or the bottom of the box increases. So I think it’s worth considering a short position on lower timeframes if this zone breaks.
💥 RSI entering the oversold area would be a strong momentum confirmation trigger for this trade.
📊 Currently, ADA's volume is quite low, and with this low volume, it’s not suitable for either long or short positions. I suggest waiting until significant volume enters ADA before taking a position.
🛒 For spot buying or long-term long positions, the first trigger is the price's reaction to this support zone. If a confirmation candle forms here, we can consider entering. However, in my view, this trigger is risky, and I personally prefer to wait for more reliable confirmations.
📈 A more reliable trigger would be a breakout of the descending channel. If either the channel itself or the 0.8414 trigger is broken, we can enter a position. And if you want the strongest confirmation and wish to enter with the main trend, you should wait for the 1.1325 level to be broken.
❌ Disclaimer ❌
Trading futures is highly risky and dangerous. If you're not an expert, these triggers may not be suitable for you. You should first learn risk and capital management. You can also use the educational content from this channel.
Finally, these triggers reflect my personal opinions on price action, and the market may move completely against this analysis. So, do your own research before opening any position.

Cardano Bull Market, Bear Market & Price Action Dynamics Expl...The question right now relates to the short-term because we all know what is happening long-term.
There is a sequence of higher lows starting June 2023. The next one comes August 2024 followed by a strong bullish breakout. So the market is bullish.
The bullish wave enters a correction with a major low in February retested in April. Now we are looking at a short-term retrace and local higher low (2025).
The 7-April low leads to a bullish breakout and this breakout gets corrected, four weeks red. This is the fourth red week and the end of the retrace. From this point on, we will see growth.
The left side of the chart is always the past. The right side the present.
The bear market wave is hard to miss (left-red), it was straight down. The bull market period is different, it has been going in sequence. Strong jump followed by a strong correction. What we are about to experience is something different.
Instead of the action we saw in 2022, 2023 and 2024, we will see something more like the bear market but inverted, straight up. Something like 2021, bull market action. We miss it and we cannot remember the truth of it because it happened so long ago.
Let's summarize: Cardano is going up.
Namaste.

ADA's situation+ Target PredictionWhat I see now is that the price could correct to the PRZ and then pump again, and currently, there is no specific bullish pattern in the chart. which could cause the price to drop below 65 cents .
Best regards CobraVanguard.💚

ADA is going to catch big targetsWe are currently experiencing a Wave 2 correction after completing an impulsive Wave 1. Once the ABC correction is complete, we can expect to enter an impulsive Wave 3. As time goes on, if it seems like we are entering Sub-Wave 1 of Wave 3, I will publish an idea to outline new targets. For now, we should anticipate new movements in the market.

Is it time to buy Cardano?Hello friends
According to the analysis and review we conducted on ADA, we reached almost definitive results:
This currency has fallen, which has caused the price to reach important and fundamental supports, and here we can buy in steps at the supports, depending on the level of risk and our capital management, and move with it to the specified goals.
*Trade safely with us*

Is Cardano the boss??A small scalp in ADA can change your life,! Look pennant will be made, a fall will be done, and then a spring up as stated

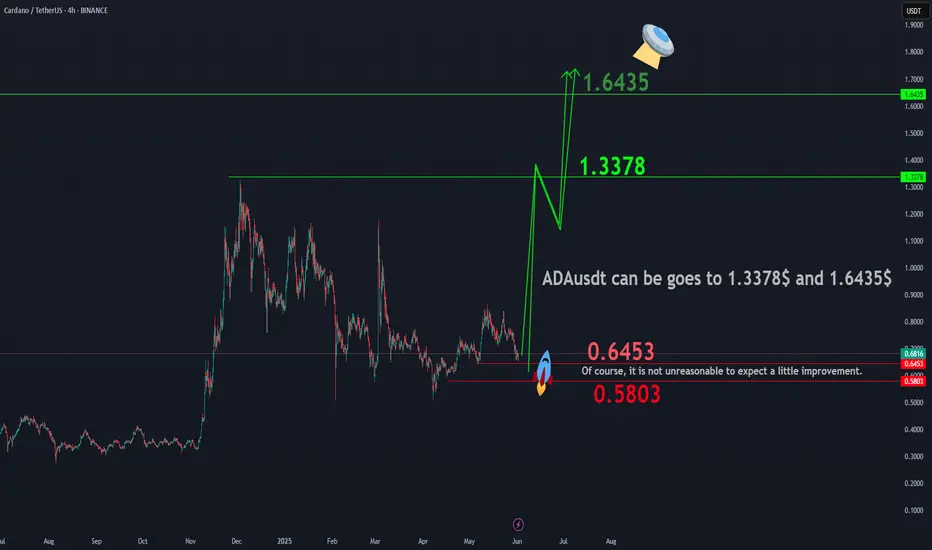
ADAUSDTBINANCE:ADAUSDT shows potential for an upward movement towards the targets of $1.3378 and $1.6435, making the current price zone attractive for long-term investment . While a correction towards $0.6453 or even $0.5803 is possible, these levels present favorable buying opportunities for investors with a long-term perspective. Even if a deeper correction occurs, the market geometry suggests that reaching the aforementioned targets is a likely outcome.
Bearish Divergence Warning: Will ADA Break the Channel?Hello guys!
Cardano has been trading within a rising parallel channel after forming a clear Inverse Head and Shoulders pattern, triggering a bullish breakout. However, recent price action has shown signs of weakness, especially with a noticeable bearish divergence between the price and RSI.
What I see:
The price is approaching the lower boundary of the ascending channel.
A channel breakout to the downside could lead to a deeper correction toward the $0.58–$0.62 support zone (highlighted area), which aligns with previous consolidation and the neckline of the inverse H&S.
If bulls defend the channel and push price higher, a potential rally toward the $0.93 resistance level remains in play.
⚠️ Keep an eye on the channel support and RSI behavior to anticipate the next move.
