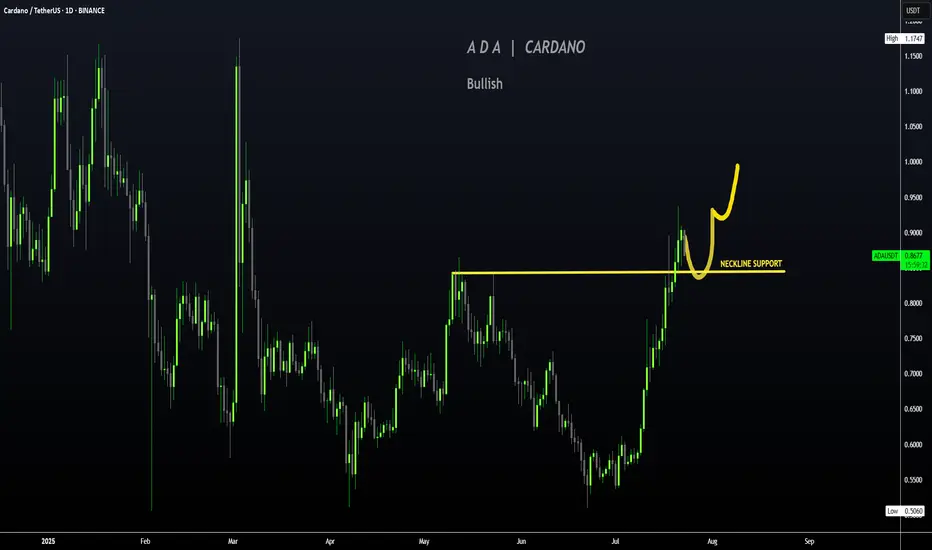
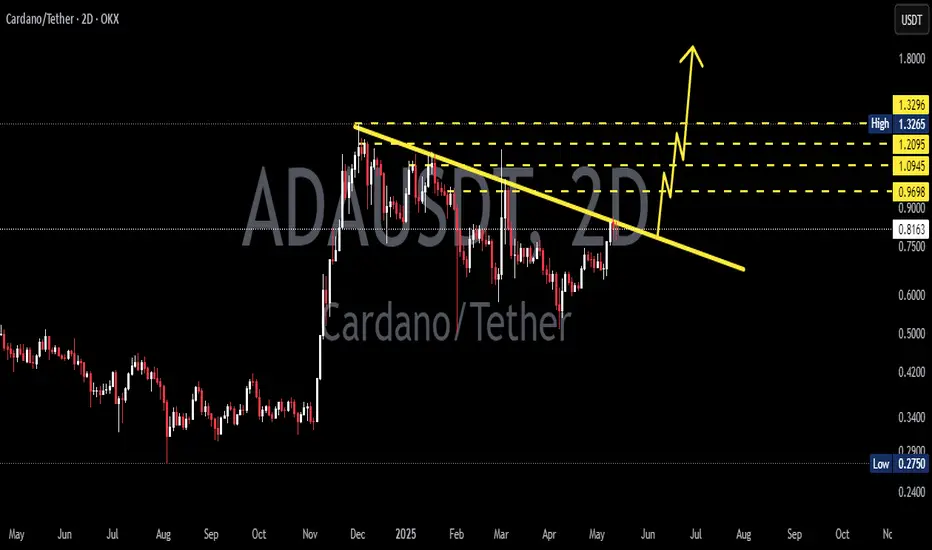
ADAUSDT Breaks Long-Term Downtrend – Critical Support Retest!The ADAUSDT pair is showing a compelling technical setup. The price has successfully broken out of a long-term descending trendline (yellow line) that had been acting as dynamic resistance since late 2024. This breakout came with strong momentum, signaling a potential shift from a bearish trend to a bullish reversal.
After the breakout, price managed to rally up to minor resistance around $0.90, but is now pulling back and retesting the key support zone (highlighted yellow box) — a previous strong resistance area now potentially flipping into support.
---
🟢 Bullish Scenario:
If the price holds above the $0.80 - $0.83 support zone, the break-and-retest structure will be validated.
A successful bounce from this area could push ADA back toward:
$0.90 (current minor resistance)
$1.13 (psychological and horizontal resistance)
$1.23 (previous supply zone)
$1.32 (recent local high)
A confirmed bullish continuation will be more convincing if the price forms a higher low and breaks above $0.90 with strong volume.
---
🔴 Bearish Scenario:
If ADA fails to hold the $0.8281 support and falls back below the descending trendline, then:
It may re-enter the previous range and test lower support around $0.75 or even $0.65.
This would suggest a potential false breakout and return to bearish territory.
Watch for bearish candlestick confirmations below $0.80 as an early warning.
---
📌 Pattern Insights:
Descending Trendline Breakout: Suggests a possible long-term trend reversal.
Break & Retest Structure: Price is currently testing the previous resistance zone as new support.
Layered Resistance Zones: Several clear resistance levels above provide logical targets for a bullish rally.
---
📊 Conclusion:
ADAUSDT has printed an early signal of a bullish reversal by breaking out of a long-standing downtrend. However, the sustainability of this trend depends heavily on the ability of price to hold the $0.80 - $0.83 support zone. Look for bullish confirmation candles in this area for a safer long entry.
#ADAUSDT #Cardano #CryptoBreakout #TechnicalAnalysis #Altcoins #BreakoutSetup #BullishRetest #CryptoChart #SupportAndResistance #PriceAction #TrendReversal
Adausdtlong

CARDANO | ADA Creeping UP to $1Cardano has made a big move in recent weeks, boasting a 77% increase.
If you were lucky enough to buy in around 30 or 40c, this may be a great TP zone:
Looking at the Technical Indicator (moving averages), we can see the price makes its parabolic increases ABOVE - which is exactly where we are currently beginning to trade. This could mean more upside is likely, and the 1$ zone is a big psychological resistance zone:
A continuation of the current correction may look something like this for the next few weeks:
_____________________
BINANCE:ADAUSDT
ADA / USDT lying on support ,ready to bounce and break trendlineADA/USDT broke above horizontal resistance and is now retesting from the trendline above. If it holds this support and bounces, a strong move toward $1.00, $1.20, and even $1.40 could follow. One to watch closely in the coming days.

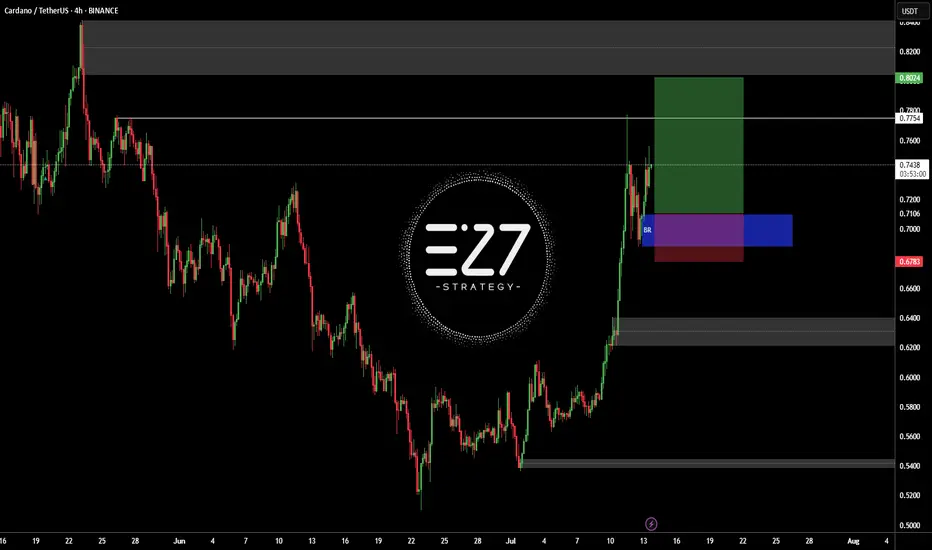
ADAUSDTBINANCE:ADAUSDT in up-trend and my open position buy in latest sowing low.
Best entry: 0.6952 - 0.7259
Target: 0.7754 - 0.8024
Stop loss: 0.678
Please control RISK management
ADAUSDT: $1.50 Year End Target, Is It Possible? The price has remained steadily bullish, but we haven’t seen a strong bullish impulse in the daily timeframe yet. This suggests that we’ll likely reach the $1.50 price range. Please wait for the price to break out and then enter a trade when it shows confirmation. You can use smaller timeframes while taking any entry. Good luck and trade safely!
Like and comment for more!
Team Setupsfx_
ADA/USD Thief Trading Plan – Bullish Snatch & Run!🚨 ADA/USD HEIST ALERT! 🚨 – Bullish Loot Grab Before the Escape! (Thief Trading Strategy)
🌟 Greetings, Market Pirates & Profit Raiders! 🌟
🔥 THIEF TRADING STRIKES AGAIN! 🔥
💎 The Setup:
Based on our stealthy technical & fundamental heist tactics, ADA/USD is primed for a bullish loot grab! The plan? Long entry with an escape near key resistance. High-risk? Yes. Overbought? Maybe. But the heist must go on!
🎯 Key Levels:
📈 Entry (Vault Cracked!) → Swipe bullish positions on pullbacks (15m-30m precision).
🛑 Stop Loss (Escape Route) → Recent swing low (4H basis) at 0.5290 (adjust per risk!).
🏴☠️ Target (Profit Snatch!) → 0.6500 (or bail early if bears ambush!).
⚡ Scalpers’ Quick Heist:
Only scalp LONG!
Big wallets? Charge in! Small stacks? Ride the swing!
🔐 Lock profits with Trailing SL!
📢 Breaking News (Heist Intel!):
Fundamentals, COT, On-Chain, Sentiment— All hint at bullish momentum!.
🚨 ALERT! News volatility ahead—Avoid new trades during releases! Secure running positions with Trailing SL!
💥 BOOST THIS HEIST! 💥
👉 Hit LIKE & FOLLOW to fuel our next market robbery! 🚀💰
🎯 Profit taken? Treat yourself—you earned it!
🔜 Next heist incoming… Stay tuned, pirates! 🏴☠️💎

Cardano Forming Potential Reversal Structure Inside TriangleHello guys!
Cardano’s been stuck inside this big descending triangle for months. We had a fake breakout a while back that totally failed.
Now, price is back at support and showing bullish divergence. That’s usually a sign sellers are getting tired.
If buyers step in here, I’m expecting a move back up toward 0.67–0.70 (top of the triangle). But if it loses the 0.53 support, that setup’s off the table.
Bias: Leaning bullish
🎯 Target: 0.67–0.70
Invalidation: Clean break below 0.53
Let’s see how this plays out.

ADA/USDT Ready to Explode? Watch This Symmetrical Triangle
🧠 Detailed Technical Analysis:
Cardano (ADA) is currently consolidating within a well-defined Symmetrical Triangle pattern on the 3-day chart. This pattern is formed by a series of lower highs and higher lows, indicating compression and indecision in the market — a classic setup for a strong breakout in either direction.
Price has recently bounced off the lower boundary of the triangle and is now heading toward the resistance trendline. A breakout from this structure could trigger a powerful bullish move if confirmed with volume.
🔼 Bullish Scenario (Upside Breakout):
A confirmed breakout above the descending trendline (~$0.65) with strong volume would indicate buyers regaining control.
Key upside targets based on historical resistance zones and the triangle's height:
🟡 $0.8144 – First major horizontal resistance
🟡 $0.9386 – Mid-range resistance from March 2025
🟡 $1.0920 – Former distribution zone
🟡 $1.2118 – Medium-term bullish target
🔵 $1.3264 – Key structural high from previous cycle
🔔 A breakout from a symmetrical triangle often leads to significant price action due to the long period of coiled pressure release.
🔽 Bearish Scenario (Breakdown):
If ADA fails to break above $0.62–$0.65 and gets rejected from the upper boundary of the triangle, the price could:
Revisit the lower trendline support around $0.55
A breakdown below this zone could lead to:
🔻 $0.48
🔻 $0.39
🔻 $0.2756 – A major psychological and historical support level
⚠️ This scenario would invalidate the bullish structure and potentially resume the mid-term downtrend.
📐 Pattern Breakdown – Symmetrical Triangle:
Pattern Duration: ~6 months of consolidation (Feb – July 2025)
Support Zone: $0.55 – $0.60
Resistance Zone: $0.65 – $0.75
Breakout Confirmation: Requires strong bullish candle close with increased volume
Volume Profile: Decreasing, typical of symmetrical triangle before explosive move
💡 Final Thoughts:
Cardano is at a make-or-break point. It has bounced from support and is attempting a breakout from this symmetrical triangle. If successful, this could mark the beginning of a major trend reversal with over +100% upside potential from current levels.
On the flip side, failure to break resistance could lead to a deeper retracement. That’s why confirmation is critical before entering a position!
#ADAUSDT #CardanoAnalysis #CryptoBreakout #SymmetricalTriangle #AltcoinSeason #BullishBreakout #BearishScenario #TechnicalAnalysis #CryptoChart #CryptoTrading #Altcoins

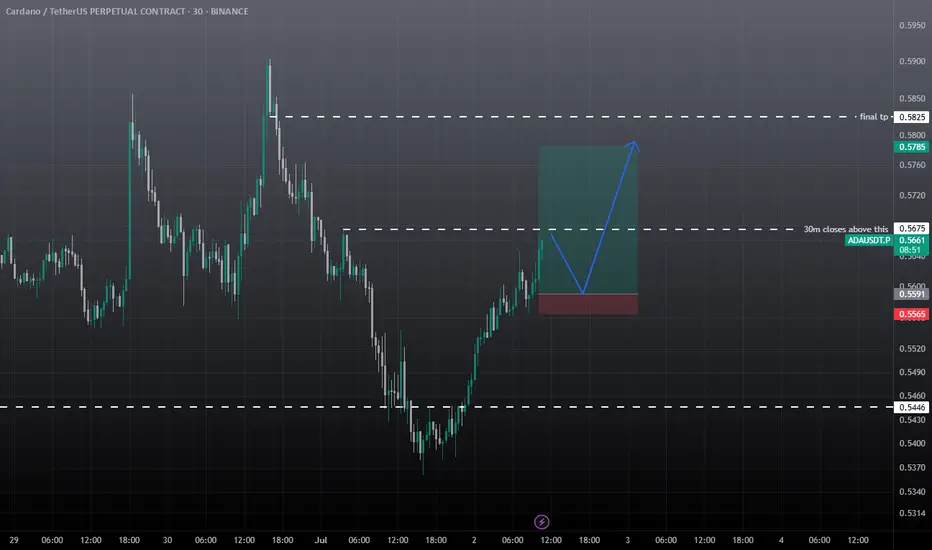
ADAUSDT Intraday SetupAda Showing some good movement. Trade Rules
must gave 30m candle closing above marked area, if wick above marked area then trade will become risky. Must use the sl. Target is given.
If retraces back before the marked area then it also good, in this case 30m marked area will first tp book 30% here, rest hold till final tp or SL.
ada usdt scalp tradeshort term pullback expected from ada, cardano so take it with small amount, trade entry based on 5m, so don't expect bigger targets. must use sl.

#ADAUSDT: Is the crypto hype finally over? ADAUSDT is likely to drop first then it can reverse and continue the bullish move upwards of previous all time high. Before we can confirm any entry on this pair we need strong confirmation which will allow us to predict a correct and accurate swing move.
If you like the work then do consider liking and commenting on the idea.
Team Setupsfx_❤️

#ADA/USDT#ADA
The price is moving within a descending channel on the 1-hour frame and is expected to break and continue upward.
We have a trend to stabilize above the 100 moving average once again.
We have a downtrend on the RSI indicator that supports the upward move with a breakout.
We have a support area at the lower limit of the channel at 0.6300, acting as strong support from which the price can rebound.
Entry price: 0.6360
First target: 0.6460
Second target: 0.6580
Third target: 0.6700

Is it time to buy Cardano?Hello friends
According to the analysis and review we conducted on ADA, we reached almost definitive results:
This currency has fallen, which has caused the price to reach important and fundamental supports, and here we can buy in steps at the supports, depending on the level of risk and our capital management, and move with it to the specified goals.
*Trade safely with us*

ADAUSDT: Targeting $1.5 Long Term Swing View| Comment Your View|Hello everyone,
The cryptocurrency price is approaching a major bullish zone where it is anticipated to reverse. Price momentum has been slightly bullish in recent times, possibly due to the release of economic data that is against the US Dollar. A weak US dollar has recently influenced the cryptocurrency market volume, resulting in all-time highs. We anticipate similar or increased volume in the future.
We would appreciate your support by liking and commenting on your views about the cryptocurrency pair. Please let us know in the comments if you would like us to analyse any other cryptocurrency or trading pair.
Best regards,
Team Setupsfx_

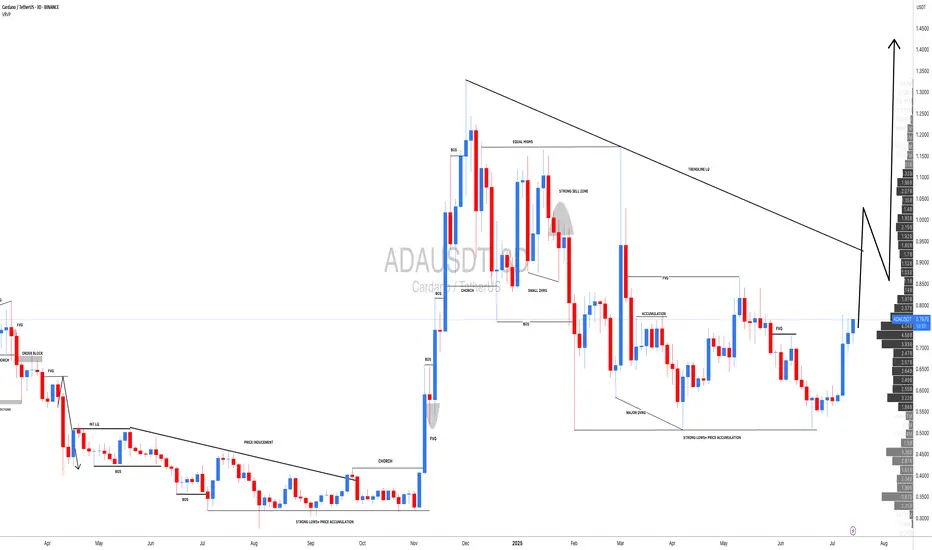
ADAUSDT 3D Analysis ADA ~ 3D Analysis
#ADA Buy after successfully breaking through this resistance line with a short-term target of at least 10%++, long-term target $3

#ADA/USDT#ADA
The price is moving within a descending channel on the 1-hour frame, adhering well to it, and is heading for a strong breakout and retest.
We are experiencing a rebound from the lower boundary of the descending channel, which is support at 0.7200.
We are experiencing a downtrend on the RSI indicator, which is about to break and retest, supporting the upward trend.
We are looking for stability above the 100 Moving Average.
Entry price: 0.7358
First target: 0.7510
Second target: 0.7700
Third target: 0.7946

#ADA/USDT#ADA
The price is moving within a descending channel on the 1-hour frame, adhering well to it, and is heading for a strong breakout and retest.
We are seeing a bounce from the lower boundary of the descending channel, which is support at 0.7025.
We have a downtrend on the RSI indicator that is about to break and retest, supporting the upward trend.
We are looking for stability above the 100 moving average.
Entry price: 0.7045
First target: 0.7364
Second target: 0.7584
Third target: 0.7884

ADA bulling :)📈 ADA/USDT 4H Analysis
ADA has broken above the 0.7408 resistance, now at 0.78150, showing strong bullish momentum within an ascending channel, targeting higher levels if the trend holds.
🟢 Support Levels:
🔹 0.7220 – recent breakout zone (20/50 EMA)
🔹 0.6630 – key support
🔹 0.6230 – deeper support
[ *]🔴 Resistance Levels:
🔹 0.8430 – next target
🔹 0.9670 – major resistance zone

ADAUSDT 2D Analysis ADA ~ 2D Analysis
#ADA Buy after successfully breaking through this resistance line with a short-term target of at least 15%++
ADAUSDT 1W AnalysisADA ~ 1W Analysis
#ADA Buy gradually from here if you still have a Conviction on this coin with a short -term target of at least 20%+.

Cardano $ADA Buy Setup support by a strong daily demand levelCardano CRYPTOCAP:ADA Buy Setup support by a strong daily demand level at 0.6593. The daily candle from the 3rd of March printed the strongest rally in Cardano's history. The crypto has been rallying ever since.

ADA/USDT 1H: Accumulation Phase Holding – Can $0.760 Be ReachedADA/USDT 1H: Accumulation Phase Holding – Can $0.760 Be Reached?
🚀 Follow me on TradingView if you respect our charts! 📈 Daily updates!
Current Market Conditions (Confidence: 7/10):
Price at $0.7331, currently consolidating after a breakout.
RSI momentum is building from mid-levels, indicating increasing strength.
Hidden bullish divergence forming on the 1H timeframe, signaling potential continuation.
LONG Trade Setup:
Entry: $0.730 - $0.732 zone.
Targets:
T1: $0.745 (initial resistance).
T2: $0.760 (extended target).
Stop Loss: $0.715 (below recent support).
Risk Score:
7/10 – Decent risk-to-reward, but requires confirmation of continued momentum.
Market Maker Activity:
Accumulation phase visible after a recent liquidity sweep at $0.69.
Strong support has formed at $0.72, reinforcing bullish potential.
Order blocks suggest further upside potential, as Smart Money positions for the next move.
Recommendation:
Long positions remain favorable in the $0.730 - $0.732 entry zone.
Monitor reaction at $0.745, as resistance could trigger a short-term pause.
Use tight stops, as consolidation could extend before continuation.
🚀 Follow me on TradingView if you respect our charts! 📈 Daily updates!

ADAUSDTADAUSDT Signal 📉
📌 Current Price: 0.7161 USDT
📊 Trend: Bearish ⬇️, but testing a descending trendline 📏
🔑 Key Levels:
🔼 Resistance: 0.9209 🛑
🔽 Support: 0.7782–0.8457 🟢
📉 Next Support: 0.6750 ⚠️
📢 Signal:
🔴 Short (Sell): Enter at 0.7161 if price rejects the trendline.
🎯 TP: 0.6750 | 🛑 SL: 0.7500
🟢 Long (Buy): If price breaks above 0.7284, target 0.7782–0.8457.
🎯 TP: 0.7782–0.8457 | 🛑 SL: 0.7000
⚖️ Risk Management: Use 1:2 risk-to-reward ratio. Control risk as highlighted.
🔍 Monitor for a trendline break! 🚨
