ADAUSD - Cardano Short-term BEARISHHi guys, i put out an analysis on ADA 4 days ago, wanted to update my analysis with whats developing in the charts as we speak.
Lets jump right in with PRICE ACTION ( on daily timeframe)
We are currently in the process of breaking this short-term support line #3. Though we have not yet closed below, todays candle which is a relatively large bearish candle with upper wick indicates bearish activity. Lets see what happens end of day.
We are also below #4 line, horizontal resistance line that played major resistance. Important to watch how ADA reacts with this line as well. The temporary move above could of been a fakeout and we may need a bit more time to get above.
I believe lines # 3 and 4 will be hard to get over. But keep an eye, If this down trend is a fake out. But this scenario is less probably with how our indicators are overbought.
I am watching the green horizontal support line without a #. I believe price action to test this level first. But my major area i am watching is line#2 and purple line (200 day moving average) converge. This in my opinion is some major support. We have to see how price action reacts here.
I think this move is the move i was expecting from the BEARISH DIVERGENCE.
From that, we should look at our indicators and how the move.
RSI - We've come down below the yellow moving average. Usually when we are below the yellow line, we are dwn for some time. Watch to see which level it starts creating support.
MACD - This is a momentum indicator i use. A cross of blue line below orange is a bearish indicator. Also the histograms when they turn red is a bearish indicator as well. We are currently in the process of a bearish cross with red print. We need to watch this.
CONCLUSION: I believe ADA to be moving downwards from the pressure of the Daily BEARISH DIVERGENCE. With indicators showing bearish signs i believe this downward correction to be here for atleast the next couple of days if not a few weeks at most. This is not a bad thing. Overall trend of ADA however is bullish after confirming a breakout of MAJOR DOWNTREND RESISTANCE from all time highs of $3.00. (Look to the chart i posted below for more info).
Thanks for tuning in! If you liked this analysis. Please boost and follow! Comment below on your opinions of what you think and let me know if you agree or disagree.
I will be continuing to UPDATE about cardano, cryptos and more. Keep an eye out!
DISCLAIMER: This is not in anyway financial advise. I am not a financial advisor. EVerything expressed in my posts are my opinion and for educational purpose. Thanks
Adausdtradeidea

#ADA/USDT Long Term Price Targets. $9 Possible by 2025!Welcome to this quick update everyone.
ADA has been trading below the resistance since October 2022 and broke out in the last weekly candle.
This is a nice development in the price action.
Technically ADA can go for a run of 40x in the next bull Run.
Is it possible? Well, I don't know but what I can see in the chart is it went 167x in the last Bull Run.
Considering the worst-case scenario I think 10X would be a decent target in the next 2 years.
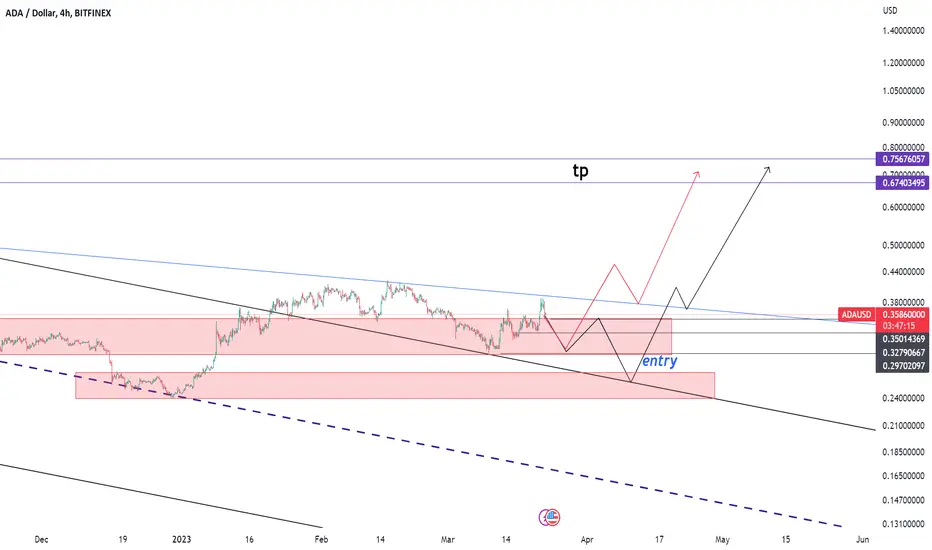
The best Accumulation Zone would be $.34 to $.44.
Target:- $0.94 in the short term.
Long-Term Targets:- $3.6 TO $9.22
What are your thoughts on this?
Let me know in the comment section and do hit the like button, it motivates me to post more often.
Thank you
#PEACE


Cardano / ADAUSD - Outlook Long term Bullish, Short term BearishHi guys. Welcome to my TA analysis on Cardano. Compared to some cryptos im liking how the charts have been for ADA. Just FYI this is purely Technical Analysis, i do not dive into FA at all and base my trading discussions strictly on TA.
That being said, i do use FA to determine which projects are likely to have strong company dynamics and actual use case when trading cryptos as ive been burned heavy before.
I will also be looking to chart more cryptos moving forward as i believe we are at the beginning stages of the crypto bull market. Make sure to tune in for more info on that in my future analysis.
Lets dive in:
First lets look at PRICE ACTION:
Look at the numbered trend lines i have drawn.
#1 line = Is this major resistance downtrend or "bear market" resistance line that formed from ADA HKEX:3 top back in August 2021. \
We have BROKEN OUT and tested it as SUPPORT along with covergence of support forming line #2 this intermediate support trend from Jan 2023.
THIS IS GREAT TO SEE as this means we have have broken the downtrend we were in since 08-2021.
Now does this mean the bottom has formed? Its possible, YES at $0.23 but do notice we can still technically test line #1 and go below $0.23 cents or near it at the least for double bottom even. But that depends on ADA BTC pair relation and how the bull move shapes up in terms of BTC dominance.
#2 line - this is an intermediate support line formed from Jan this year. If we cant stay above line #4 , the red resistance line we can test it at any point as support, im in the camp that maybe thewhite circled area where the 200 Day moving average intersects line #2 is a potential area to look at.
line 2 along with orange arrow forms a upward channel. Notice here how Orange arrow is acting as resistance and todays candle is looking bearish with upper wick.
#3 line - This line is a short term support line where in the coming days we can test, especially if the price action is pushed down by orange arrow.
#4 line - This line was major support back in May 2022, then acted as major resistance recently in Feb. We have to now see how price action acts as we come down to test it. We want to STAY ABOVE.
In the short term i believe we will DEFINITELY test where Lines #3 & 4 MEET. If we can stay above, act as support and bounce up. solid area to Buy in. But remember this could be a temporary fake out to the upside, meaning we are bound to come down. I would need solid confirmation that we stay above these 2 lines.
BUT a major area i would look to enter more positions will be the 200 DMA and line #2. That seems like it would be major support.
INDICATORS:
1. Purple line is the 200 day moving average (dma). Notice how we are above the 200 DMA this is also a great sign as long as we stay above it. The thing to pay attention is how and if/when we react again with this in the near future. We need it to be SUPPORT. I would like it also to start curving upwards, which it may do as we are starting to flatten out.
2. RSI - Important to note we maybe forming a lower high. But price action formed a higher high. This is bearish divergence. Which could push price down, causing price action to interact with drawn lines.
Todays close is important, as we created a peak and are pointed down.
3. ADX and DI - Also shaping up to be bearish divergence. Where bullish momentum is decreasing but price action seems to form higher high recently. Notice the white circled area, the green line is pointing down, showing a decline in bullish momentum
BEARISH DIVERGENCE is when price action is moving up forming higher high shown by the ORANGE arrow but indicators are pointing down forming lower highs also shown by arrow. Price tends to move down over time.
CONCLUSION: I think overall ADA seems more bullish than other ALTS but remember that doesnt mean we can't see lower prices than 0.23 cents and still be in a bull market especially if BTC dominance is strong. It is therefore important to gauge at BTC dominance and BTCADA pairings when going for longer term trades. There are loads of positives for ADA, like breaking the major resistance that was formed during downtrend from HKEX:3 and testing it as support. There are also alot of support if ADA does move down which just means more buying opportunity especially since i believe we are in the makings of the new bull run. A MAJOR WARNING however and something to watch carefully is the BEARISH DIVERGENCE and if and when it plays out. That could mean short term price drops. Look to the support lines drawn and the 200 DMA. But overall i believe Cardano is starting its bullish run and am long ADA until proven otherwise.
Hope this helped. If you likes what i put out, Please boost, follow and comment. Let me know if you agree or disagree. Stay tuned for updates and more charts on crypto and other assets as well. Look below for related charts especially chart on BTC and recent analysis on another ALT>
DISCLAIMER: This is by no means financial advice. I am not a fiancial advisor. The info expressed here are only my opinion and for educational purposes. When trading please maintain your risk management and protect yourselves with stop loss.

Play ADA with me 4H chart. Hello my friend, go to play with me ADA. Wait for pullback and retest the resistance.

ADA creating a daily double bottomBYBIT:ADAUSDT.P
1D time frame
-
ADA takes 180 days to create this potential double bottom
Currently daily candle closed above the neckline, so we can plan a long trading here and targets as marked.
SL could be set once go back below neckline.

ADA/BUSD buy callADA/busd is currently near the support
so good opportunity to buy
Buy : 0.4040
SL : 0.3881
TP : 0.4262
As ada/busd is in uptrend,
you can buy and hold for more profits but
put the stoploss at this point

ADAUSDT - All targets have been achievedAdhering to my plan and review of this altcoin, the executed position brings a result of 144% ROE on 20x leverage
Thank you all for your support, we will continue to search for other positions
ADAUSDT - trying to open LONG

Is a 167% profit achievable? Take a closer look at ADA.Hello everyone! Today, let's look at the prospects of the ADA cryptocurrency.
After a local correction, the asset began to move in an ascending channel. The first serious resistance level is located around 0.236 on the Fibonacci scale ($0.43 per coin). If this level is successfully broken, the asset will continue its upward movement to the next two strong Fibonacci levels at 0.382 and 0.618. At the last level, it is possible to get a profit of 167% on the spot.
This is not a trading recommendation, everything you do is at your own risk.

ADAUSDT - trying to open LONGThere is a breakdown of the structure, there was also a swing high, which would be cool to lift the ego ($0.4047).
Before entering the poi, there is liquidity, which confirms the validity of the zone of interest.
For targets: eat 0.3897 - 0.3977 - 0.4040

ADAUSDTPossible thing for ada is shown in my idea. I think ada should come down to its support and the move up to $4.3 mark.

Ada | Buying Zone Ada Usdt
Facing Strong Horizontal Resistance Here
Price will retest the lower support again in my opinion
incase Of Succesful Retest breakout can be seen again from the same range
Remember: These are just ideas that we share from our experience, it does not mean that they will be 100% perfect, anything can happen in the market at any time.
Always manage your risk and trade from your research

Bearish ABCD pattern | ADAUSDAs the price has rejected from the potential reversal zone ( PRZ ) its is likely to reverse the trend from here.The price is now making LH and LL . Trade plan is mentioned in the chart. Manage your trades accordingly.

Bullish Continuity for ADAUSDThe market is heading for the bullish continuation. Bullish Flag is formed with no divergence confirming the uptrend. Wait for the price to break the HH/pole. Take entry after breaking the HH by using Buy stop. Stoploss should be below LH.


ADA/USD ANALYSISEntry points in the transaction are specified
Enter with the right volume and stick to the goal
ADA H&S upcoming ?Hello Traders,
I guess am seeing ADA forming a head and shoulders pattern..
It may test the neck line soon at 0.6304.
In case of a break : I guess 0.6000 will be the first major support that the price can retrace from instead of going to the H&S target.
INVALIDATION : Dotted line ( above 6.53 )
-
Educational :
What is Head and shoulders pattern ?
The Head and Shoulders pattern is an accurate reversal pattern that can be used to enter a bearish position after a bullish trend. It consists of 3 tops with a higher high in the middle, called the head. The line connecting the 2 valleys is the neckline. The height of the last top can be higher than the first, but not higher than the head. In other words, the price tried to make a higher high, but failed. The closer the 2 outer tops are to the same price, the more accurate the pattern.
If the price breaks the neckline and closes below it, the pattern has completed. Conservative traders may look for additional confirmation. The target can be estimated by measuring the height of the pattern (from the neckline to the head) and projecting this downwards. Common stop levels are above the neckline or above the right shoulder. The Inverse Head and Shoulders is the bullish version of this pattern that can form after a downtrend. TradingView has a smart drawing tool that allows users to visually identify this pattern on a chart.
-
Leave a thumb up if you agree !
Follow for more <3
Have a nice day.

ADAUSDT ,waiting for breakout trend.ADAUSDT, i am looking for breakout to confirm my the buy position if the price could not break the trendline the price will drop down but i am looking to buy after breakout.

Support and Resistance Levels for ADAUSDThe trade plan is discussed in chart .You can either play in Range , buying at S1 Or Selling at R1. Incase it breaks S1 and S2 your Sell stop will trigger and if it breaks R1 and R2 then your buy stop triggers. Always use stop loss.

ADAUSDT Daily: 18/02/2023: Bull or Bear?!
Let's take a look at ADA.
As you can see, the price touched an important supply zone and had a bearish reaction, so our first scenario is bearish, and the price will fall from here.
Below monthly resistance I am bearish. It's possible that the price breaks the supply zone to collect the liquidity above an equal high and then fall.
If the price can break the monthly resistance and stay above that, we can follow the second scenario.
💡Wait for the update!
🗓️18/02/2023
🔎 DYOR
💌It is my honor to share your comments with me💌


ADA/USDT Long ADA/USDT Long Idea
Expecting 1st Target $0.50 USD,
Expecting 2nd Target $0.52 USD,
Expecting a pullback to $0.50 to retest previous resistance level of $0.50 as support,
Expecting a bounce back upwards to $0.52 USD.
Good luck to all, DYOR, NFA.

ADAUSDT Bearish PatternHello Traders. Hope you are having a wonderful weekend. Today I saw a bearish pattern on ADA on 4H timeframe. What is your opinion?
Comment below please.
