ADBE

Is Adobe on its Way to the Clouds? 🎨 | ADOBE ($ADBE)📷 With more and more people working from home and taking part in remote and digital workforce companies like Adobe have never been more relevant. While Adobe's dominance in the digital creative market during these times is reason enough to be bullish going into what analysts predict to be favorable earnings, Adobe's chart is the real icing on the cake. We have noted on the chart as to how the prior all-time-highs (ATH) being broken above have turned out, and it is a safe assumption this ATH break will have a similar effect. It shouldn't be too hard to find a good long setup here, so let's look for one.
Resources: www.earningswhispers.com
✨ Drop a comment asking for an update, we do NEW setups every day! ✨
Like, Comment & Follow to help the community grow 🎉🎉
---
1. Fractal Trend is showing a clear uptrend (Aqua colored bars) on the 4-hour timeframe.
2. With this strategy, we are looking for long setups in an uptrend and as such want to enter long on retests of bullish order blocks plotted by Orderblock Mapping (Aqua colored lines) and/or bullish S/R levels plotted by Directional Bias (Aqua colored lines).
3. The setup here is to buy the S1 S/R flip and orderblock cluster and then to ride ADBE up to new all-time-highs (likely riding on the back of the NASDAQ once it breaks through its previous highs.
4. Our stop is set below S1 giving us enough room to see a liquidity hunt. Our target is then current set to offer a solid 1:5 risk-to-reward ratio, although anything 1:3 or greater would be acceptable, so there is room to let this one run or take profit early as needed depending for example on the strength of the broader market.
5. While there aren't any notable levels above us (all-time-highs have that effect), we do have clear support below at the S2 major pivot point should we move lower for whatever reason.
Good luck tech bulls!


Adobe is breaking out $ADBE$350.38 is the buy resistance. If it breaks out, the target will be the pivot. Watch for RSI and volume.

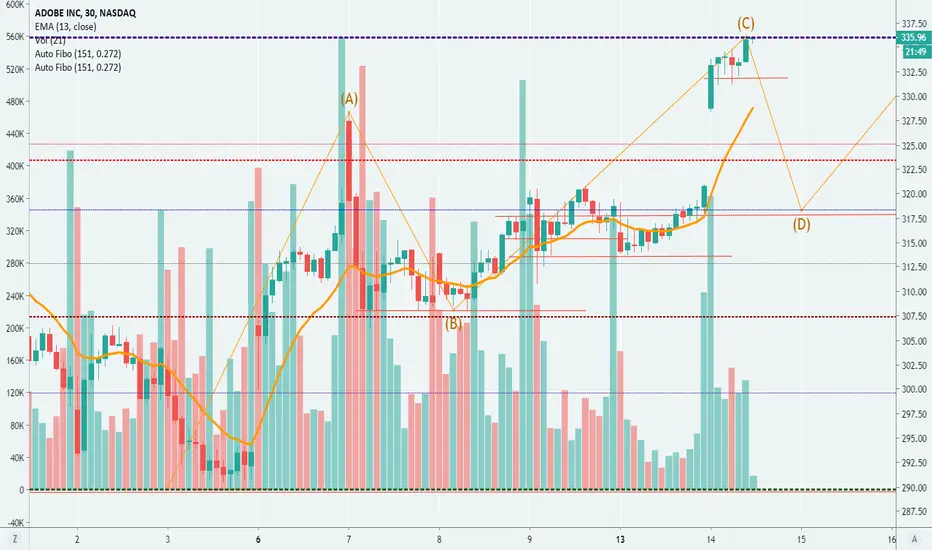
ADBE reached bottom and coming nicely out of the triangleADBE reached bottom and coming nicely out of the triangle
Long position ADBE on Daily chartI see positive signs of continuing uptrend here, will buy NASDAQ:ADBE at the market open

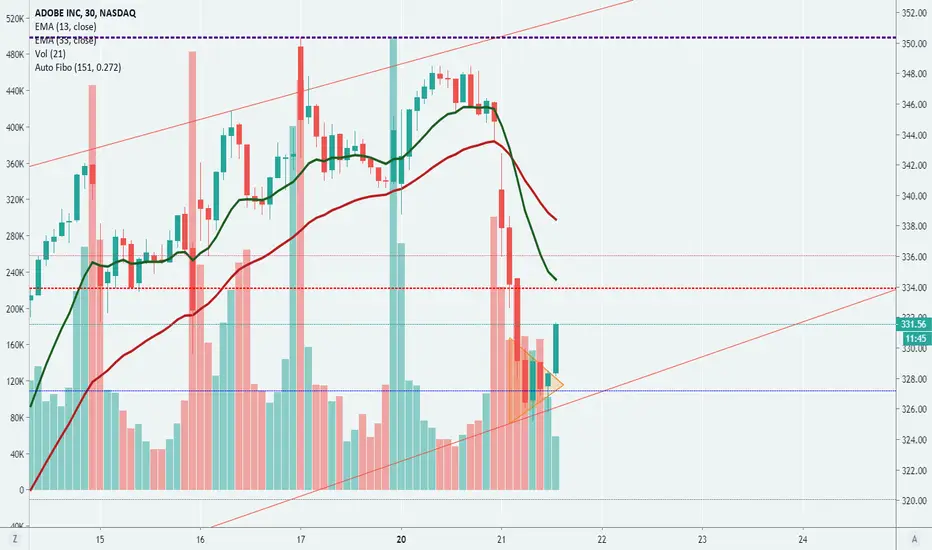
ADBE facing resistance could revisit 334-332 as first support leADBE facing resistance could revisit 334-332 as first support level


ADBE facing resistance at 336.25 may see some pullbackADBE facing resistance at 336.25 may see some pullback. First downward target 332, if does not hold 332, could get ugly in the rage of 320-313


THE WEEK AHEAD: ADBE, ORCL EARNINGS; GDX/GDXJ, USO/XOP/XLE, EWZEARNINGS:
ADBE (89/65) and ORCL (77/60) both announce earnings on Thursday after market close and have the metrics I look for in earnings-related volatility contraction plays (>70% rank; >50% 30-day implied).
Pictured here: a short strangle paying 11.65 at the mid price camped out around the 16 delta. Its defined risk counterpart: the 265/275/395/405 ten-wide iron condor pays 2.46. Off hours markets are showing wide, so look to price setups out during the regular session.
The delta neutral ORCL April 17th 40/55 short strangle pays 1.45.
EXCHANGE-TRADED FUNDS WITH EXPIRY IN WHICH THE AT-THE-MONEY SHORT STRADDLE PAYS >10% OF THE STOCK PRICE:
GDX (99/51), April
USO (97/66), April
GDXJ (96/58), April
XLE (97/75), April
EWZ (92/52), April
XOP (92/51), April
TLT (91/41), May
EWW (91/48), April
XLU (90/43), June
SMH (84/56), April
FXI (65/33), June
BROAD MARKET WITH EXPIRY IN WHICH THE AT-THE-MONEY SHORT STRADDLE PAYS >10% OF THE STOCK PRICE:
EFA (87/37), June
QQQ (83/43), April
IWM (82/46), May
SPY (78/41), May
EEM (70/37), June
FUTURES:
/CL (97/65)
/GC (84/25)
/SI (70/30)
/NG (65/48)
/ZS (30/19)
/ZC (21/22)
/ZW (13/27)
VIX/VIX DERIVATIVES:
VIX finished the week at 41.94, so it has been a rough ride for shorters who were in plays before this volatility expansion (points to self). The basic watch word is "patience"; volatility will abate at some point in time ... .

ADOBE INC (ADBE) is near the Key Historical Level!The price is near the Key Historical Level 313.00.
The best place foe open Sell will be under that level after the false breakout.
Push like if you think this is a useful idea!
Before to trade my ideas make your own analyze.
Write your comments and questions here!
Thanks for your support!

$ADBE Gap AnalysisADBE Gap analysis. Strong gap. It did gap abover 100 SMA on daily and holding that level pretty good. Possible to test ATH before earnings.

ADBE Correction BouncesCorporate buybacks struggle against heavier rotation by Dark Pools. ADBE steps downward to bounce at support levels.


ADBE Short since yesterday's closing Target $262ADBE Short since yesterday's closing Target $262, broke support yesterday. Earnings around a corner may get pushed another 10% down if the report is not satisfactory.

ADBE long setupADBE’s innovation outlook is trending up based on a current score of 77 out of 99, outperforming sector average. Jobs growth over the past year has decreased and insiders sentiment is negative. ADBE is an Outperformer in terms of sustainability. It is most exposed to WPP plc as its supplier. Over the past 4 quarters ADBE beat earnings estimates 3 times. For more analysis and articles visit our website .


Adobe touching the top of the channel. I'm initiating PutSpreadADBE
Touching the top of my channel, on low volume. Move today isn't valid IMO. Opened short term putspread.

ADBE Gaps Over Short-Term ResistanceADBE gapped over a short-term high resistance area and moved up on a velocity run. This is a new all-time high for ADBE.

