#ADEX/USDT#ADEX
The price is moving in a descending channel on the 1-hour frame and is expected to continue upward.
We have a trend to stabilize above the 100 moving average once again.
We have a downtrend on the RSI indicator that supports the upward move with a breakout.
We have a support area at the lower boundary of the channel at 0.1006.
Entry price: 0.1050
First target: 0.1066
Second target: 0.1084
Third target: 0.1111
Adex

ADXUSDT 1D ADX ~ 1D Analysis
#ADX Buy after successfully penetrating this resistant line with a short -term target of at least 15%+.
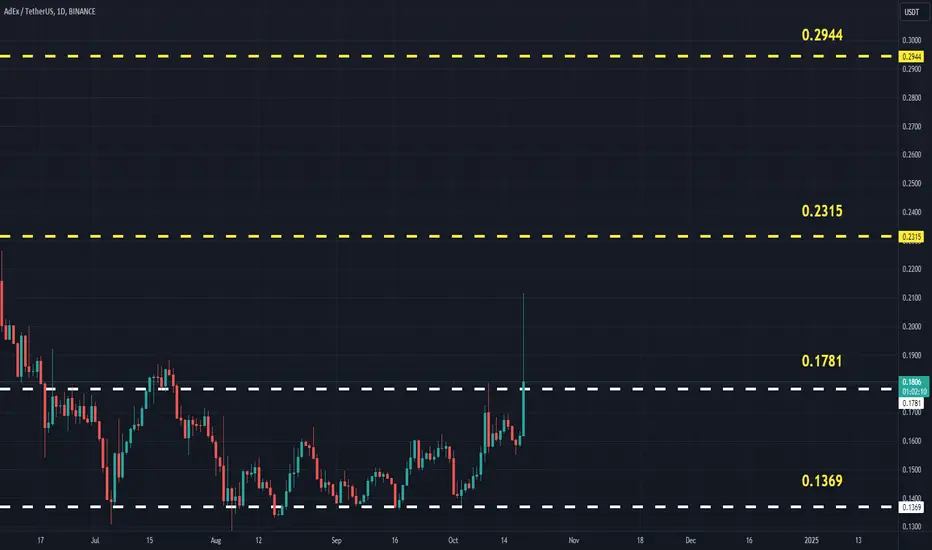
ADXUSDT (AdEx) Updated till 19-10-24ADXUSDT (AdEx) Daily timeframe range. many alts got similar pattern now. from a accumulation zone its trying to get out of its local low. but volume still not there if it can stay above 0.1781 than it got chances to continue.
ADXUSDT LONG IDEAAs with most of my token analyses, we can see a clear accumulation of this asset.
The price fell by 90% and found support. According to such structure as rounding we can say that we are on the way to big growth.
I advise you to have this asset in your portfolio.

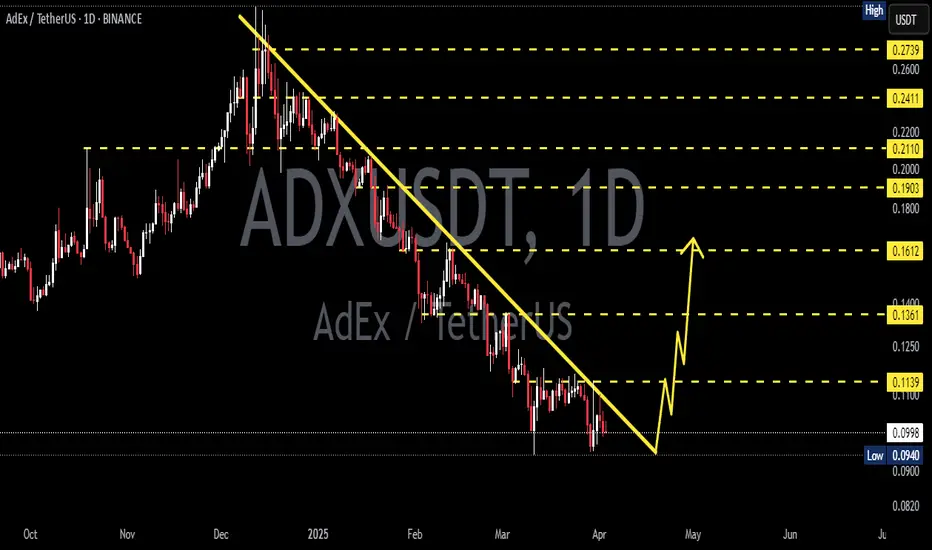
Finally Adx Testing Multi Year Trendlineseems like bottomed out and getting ready for massive recovery
in downtrend from last year now testing trend line in 3 days tf expecting breakout too
incase of successful breakout expecting solid recovery in coming weeks expecting 120 to 140% bullish rally incase of breakout

ADX (AdEx Network) Token Analysis 27/04/2021Fundamentals:
AdEx Network describes itself as a new-generation solution aiming to address and correct some of the most prominent inefficiencies of the online advertising industry.
AdEx originated in 2017 as a decentralized ad exchange and subsequently evolved into a full protocol for trading of advertising space/time and the subsequent verification and proof of ad delivery. It covers all interactions between publishers, advertisers and end users.
AdEx Network works through micropayments on Ethereum by utilising the OUTPACE layer 2 payment channels, and offers DeFi staking of its native ADX token.
The AdEx team also develops an open source platform built on top of the Ethereum implementation of the protocol, available at platform.adex.network Since the public launch of the platform in 2020, it has gained more than 4,000 registered users and has processed 800+ million micropayments on the blockchain.
ADX is the native utility token that is used for incentivizing validator uptime and ensuring the smooth running of all advertising campaigns on the AdEx platform.
Validators are appointed for each advertising campaign on the platform, and are responsible for processing the micropayments between publishers and advertisers through layer 2 payment channels. The more tokens are staked, the stronger the reliability guarantees of the validator network. As of late 2020, the staking APY is over 50%.
By using payment channels, AdEx ensures full transparency for all involved parties. Moreover, AdEx is using its own Layer-2 scaling solution called OUTPACE to facilitate micropayments per impression between its advertisers and publishers, processing more than 2,5 million transactions daily.
After successful beta tests, AdEx Network released the AdEx Platform in 2020 and scaled it to 7,000 registered advertisers and publishers generating more than 70 million monthly impressions. In August 2020 AdEx started incentivized staking and liquidity providing programs for the $ADX token, interacting with the DeFi ecosystem and engaging its community into actively supporting the stability of the AdEx Platform.
in January 2020, AdEx Network launched the company’s staking portal, where ADX holders can receive rewards for staking their tokens. These rewards were initially limited to a portion of the validator fees paid per campaign on the AdEx advertising platform. In September the same year AdEx staking was expanded to include security mining as well, and soon after a Loyalty Pool was added too, using Chainlink price feeds.
learn more on staking here:
www.adex.network
AdEx Network was created by Ivo Georgiev and Dimo Stoyanov - seasoned entrepreneurs with a track record. The duo is also the powerplant behind the media streaming platform Stremio that has 14+ million users around the globe.
Today, a team of 20 professionals works on the AdEx Network advertising platform and staking ecosystem
Adex Network launched on June 30, 2017 with 100,000,000 ADX tokens created at that date. In September 2020, the company team performed a token upgrade that allowed for an additional 50 million tokens to be minted. To date, the total number of coins in circulation is 114,160,982 ADX.
The live AdEx Network price today is $1.38 USD with a 24-hour trading volume of $4,379,738 USD. AdEx Network is up 10.34% in the last 24 hours. The current CoinMarketCap ranking is #302, with a live market cap of $161,978,711 USD. It has a circulating supply of 117,708,550 ADX coins and a max. supply of 150,000,000 ADX coins.
ADX is available on some of the largest exchanges in the world: - Binance: ADX-ETH, ADX-BTC - Bittrex: ADX-ETH, ADX-BTC - Upbit Korea: ADX-KRW - Huobi: ADX-BTC - HitBTC: ADX-ETH, ADX-BTC, ADX-USD - Folgory: ADX-ETH, ADX-USDT - 1inch.exchange - Uniswap V2 - Mooniswap - SushiSwap: ADX-ETH - WazirX: ADX-USDT - CoinDCX: ADX-BTC - IDEX: ADX-BTC - Fatbtc: ADX-ETH - VCC Exchange: ADX-ETH, ADX-BTC - Balancer: ADX-yUSD
Technical Analysis:
This Token has done its Initialization and Accumulation phase and has shown some impulsion and currently is at the retracement to the Fibonacci Golden Zone of the Entire impulsive cycle.
There are few Support Areas below the current price defined by Fibonacci Retracement which can be considered as the very critical point for trend Reversals from Bearish retracement to Bullish Rally...
There are total of 3 Targets defined by Fibonacci Projection of the Impulsion and its Parallels Legs levels confluences with the past Price Action Levels.
Both 1 and 2 TP are having Strong Confluences with Price's past behavior, so they have significant importance in the Future UP Moves.
The 3 TP gets its Confirmation as the price triggers the 2 TP followed by some distribution and retracement for better price correction and Impulsive UP Move's Reaccumulation...

Ambire AdEx (ADX) formed a bullish Shark for upto 51% moveHi dear friends, hope you are well and welcome to the new trade setup of Ambire AdEx (ADX) with BTC pair.
On a 4-hr time frame, ADX has formed bullish Shark move for next price reversal.
Note: Above idea is for educational purpose only. It is advised to diversify and strictly follow the stop loss, and don't get stuck with trade

good entry for #ADEXthis is a great opportunity to catch the third wave , targets and stop loss on the chart


🆓Ambire AdEx (ADX) Dec-5 #ADX $ADX
.
📈RED PLAN
♻️Condition : If 1-Day closes ABOVE 0.55$ zone
🔴Buy : 0.6 - 0.55
🔴Sell : 0.75 - 0.9 - 1.1
📉BLUE PLAN
♻️Condition : If 1-Day closes BELOW 0.55$ zone
🔵Sell : 0.55
🔵Buy : 0.48 - 0.42
❓Details
🚫Stoploss for Long : 10%
🚫Stoploss for Short : 5%
📈Red Arrow : Main Direction as RED PLAN
📉Blue Arrow : Back-Up Direction as BLUE PLAN
🟩Green zone : Support zone as BUY section
🟥Red zone : Resistance zone as SELL section

ADXBTC Daily Technical AnalysisADXBTC Daily Technical Analysis
Indicators are POSSITIVE ...1430 if can stay up this price so will watch next Resistance
Resistance Price: 0.00001430 - ...1502 - ...1590 - ...1688 - ...1796
Support Price: 0.00001115

Expecting UPP to start a move up Expecting UPP to start the next bull move very soon as this current consolidation is broken to upside

AdEx Network (ADX) | Consolidation Then Jump!Hello my fellow cryptocurrency trader, how are you feeling this Saturn-day?
We have a very simple chart here, ADXBTC (AdEx).
We are doing some of a fractal...
First, we have the consolidation box in purple.
Second, we have a strong bullish breakout.
The same pattern is repeating now.
After prices move above EMA50 for ADXBTC, strong bullish action tends to follow.
This is also true for other altcoin trading pairs (ALTSBTC) and many other assets across the different markets.
Get ready because this beauty here is also getting ready to grow.
Namaste.

AdEx (ADX) Above MA200 and EMA50... What Does It Mean?When you see a trading pair, altcoins, above EMA50 and MA200, this means that the bulls are in control.
As long as prices stay above these two lines, we can expect a massive jump.
But, please remember that charts are always changing and can always change...
If prices move and close below MA200, the bullish bias can be lost.
The market is dynamic, we adapt and act based on what is happening... We do not care about predictions, we simply trade based on what is going on.
Namaste.

✳️AdEx/BTC (15/11) View + Trading Plan #ADX $ADXADX is continuously rejected in the 1900-2000sts region since August and currently the trend of ADX is to fall to the zones of 1200sts, 1000sts and deepest in the 500-600sts
Only when ADX closes 1D candle above 2000sts, ADX will have a stable and strong rally.
📈BUY- LONG
- Buy: 1200-1300sts. Stoploss if B
- Buy: 900-1000sts. Stoploss if B
- Buy: 500-600sts. Stoploss if B
📉SELL-SHORT
- Sell close to 1900-2000sts. Stoploss if A
♻️BACK-UP
- Buy close to 1900-2000sts if A. Stoploss if B
- Buy: 2700-2800sts. Stoploss if A
- Buy: 3400-3500sts. Stoploss if A
❓Details:
Condition A : "If 1D candle closes ABOVE this zone"
Condition B : "If 1D candle closes BELOW this zone"

AdEX Strong Consolidation Continues | Easy 88%+ADXBTC (AdEx) continues to print a really strong consolidation with prices accumulating above all our EMAs (EMA10/21/50/100/200/300) and also MA200.
We have the "Cup & Handle" pattern.
Which is a bullish pattern.
We also have the MACD sitting strongly above the zero line and with plenty of room available for additional growth.
The RSI is above 60, so we can expect anytime now to see this strong 88%+ jump.
Namaste.

AdEx (ADX) Prepares For Something BIG!AdEx (ADXBTC) is preparing for a big move.
First, we have the massive candle on 29-July.
Then, we have the strong candle on 11-Sept.
Third, prices bounced off EMA300 rather than reaching MA200, signaling strength...
ADXBTC is likely to grow long-term.
We will see the last high taken out at 0.00003385 and even higher prices.
Patience is key, once you buy-in.
Remember to build a plan if you want to succeed.
Namaste.

ADX/BTC - Swing trade #1Reasons for the trade are outlined on the chart. Good luck!
Hit the LIKE button if you find my analysis valuable and want to support me. Follow to make sure you don't miss any future trade ideas.

ADXBTC Reached BottomMy opinion on this idea is that ADXBTC has reached potential bottom. If you take a look at RSI indicator and price, you will see that we have lower lows on price chart, but whereas on indicator it's not going lower than 30 level, it's called divergence and in our case it's bullish.
Additionally, price has reached 0.236 Fib level, which is last fib retracement level and some bounce is expected from this level. If price keeps higher than 1523, then we are going to 0.386 Fib level soon.
Good luck and keep your SL tight !

#ADX/BTC (May 27)ADX is at the bottom zone and it is too good to accumulate in the range of 900-950sts.
It is forming a big Cup & Handle pattern and targets are : 1200 - 1800 - 2300
If price drops below 800sts, it would be dangerous

AdEx Is Preparing For Its Next Bullish Move (90% Mapped)AdEx (ADXBTC) hit a low back in late September 2019, together with another group of small-cap. alts.
After this low was hit, a very strong bounce followed and ADXBTC has been consolidating ever since.
Now with prices trading above MA200 and the last retrace reaching its goal, AdEx is getting ready, to generate 90%+.
Patience is key.
Remember to have a plan when/if you decide to trade.
Thanks a lot for reading.
This is Alan Masters.
Namaste.

AdEx (Jan 13) - 31% to 72% Profit#ADX/BTC (Binance)
Buy : 950 - 975
Sell : 1050 - 1150 - 1250 - 1300 - 1400 - 1500 - 1600
Stop : 845
#ADX $ADX #ADXBTC

AdEx PREMIUM Trade Signal @alanmasters [ADXBTC](234%) Trade: AdEx | ADXBTC
BUY: 0.00001070 - 0.00001150
TARGET:
1) 0.00001410
2) 0.00001700
3) 0.00001880
4) 0.00002150
5) 0.00002350
6) 0.00002600
7) 0.00003300
8) 0.00003800
PROFITS POTENTIAL: 234%
(Current price 0.00001138)
STOP: Close daily below 0.00000960.
-------------
This is not financial advice.
Alan Masters Beginners Tips
Always make sure to have a plan before you trade.
Do your own research.
Patience, always breath, think and take your time before buying anything or taking any account that puts you or your money at risk.
Take your time always, if one opportunity goes another one will come.
Thanks a lot for your love and continued support.
Namaste.
