Adobe Target $539 - After Consolidation🐂 Trade Idea: Long - ADBE
🔥 Account Risk: 2.50%
📈 Recommended Product: Stock
🔍 Entry: +/- 446.00
🐿 DCA: Yes, down to 400.00
😫 Stop-Loss: 357.00
🎯 Take-Profit #1: 539.00 (50%)
🎯 Take Profit #2: -
🎯 Trail Rest: Yes
🚨🚨🚨 Important: Don’t forget to always wait for strong confirmation once possible entry zone is reached. Trade ideas don’t work all the time no matter how good they look. Do not get a victim of FOMO, there is always another trade idea waiting. 🚨🚨🚨
If you like what you see don’t forget to leave a comment 💬 or smash that like ❤️ button!
—
Adobe participated in the AI boom and made more than 50% from its May low at around 325.00. Huge selling pressure came in around 520.00 showing stronger resistance in that area. We’ll need to see some more consolidation before considering stepping in. First buy zone would be around 446.00 from where one can DCA-in into the stock down to 400.00. We might not see the stock reaching the second buy zone, so consider start buying in multiple tranches starting in buy zone 1.
—
Disclaimer & Disclosures pursuant to §34b WpHG
The trades shown here related to stocks, cryptos, commodities, ETFs and funds are always subject to risks. All texts as well as the notes and information do not constitute investment advice or recommendations. They have been taken from publicly available sources to the best of our knowledge and belief. All information provided (all thoughts, forecasts, comments, hints, advice, stop loss, take profit, etc.) are for educational and private entertainment purposes only.
Nevertheless, no liability can be assumed for the correctness in each individual case. Should visitors to this site adopt the content provided as their own or follow any advice given, they act on their own responsibility.
Adobe

ADBE Adobe Options Ahead of EarningsAnalyzing the options chain of ADBE Adobe prior to the earnings report this week,
I would consider purchasing the 460usd strike price Calls with
an expiration date of 2023-7-21,
for a premium of approximately $21.60.
If these options prove to be profitable prior to the earnings release, I would sell at least half of them.
Looking forward to read your opinion about it.

$ADBE Fibonacci 618 resistance NASDAQ:ADBE resistance is at the horizontal line and its a 618 Fibonacci resistance level

Adobe key positioning for the future of A.I made graphics.TA: Looking at interest levels and daily RSI, taking a long here is sub-optimal and has risk of drawdown. However, fundamentals back upwards momentum. Buy and Hold strategy here might be wise. Pivot line may yield a double top (A.I boom -> Burst) or could initiate further upwards momentum to new ATH's in which case TP2 and TP3 are the interest levels.
Fundamentals:
Adobe is a global leader in software, known for its Creative Cloud suite, which includes industry-standard applications like Photoshop, Illustrator, and Premiere Pro. The company has made significant strides in integrating advanced AI technologies into its products and services, which has contributed to its impressive financial performance.
A significant recent innovation is the integration of Generative AI and Adobe Firefly into Photoshop, marking a new chapter in Adobe's history. This innovation allows creators to use their natural language to prompt Photoshop to create extraordinary images with Generative Fill, a feature powered by Adobe's Firefly, a family of creative generative AI models2.
Adobe is also committed to ensuring its AI technology is developed ethically, focusing on accountability, responsibility, and transparency. They are developing a compensation model for Adobe Stock contributors and are taking steps to prevent artists’ names from being used in Adobe’s generative AI actions2.
In terms of their competitive advantage, Adobe's significant graphics dataset is instrumental. Adobe Stock, for instance, has a landmark dataset containing more than two million assets. Adobe has leveraged this immense dataset to train its AI technology, Adobe Sensei, to effectively detect landmarks in images submitted to Adobe Stock. This capability has been crucial for identifying and categorizing images and addressing any potential intellectual property issues with them3.
The integration of AI in Adobe Photoshop is demonstrated by the Generative Fill feature, which is powered by Adobe Firefly. Firefly is a family of creative generative AI models that are infused into every selection feature in Photoshop, and allows users to add content, remove or replace parts of an image and extend the edges of an image using natural language prompts. Adobe Firefly, which launched six weeks prior to the announcement I found, had quickly become one of the most successful beta launches in Adobe's history, with beta users generating over 100 million assets to date1.
For Adobe Stock, the company uses Adobe Sensei, their artificial intelligence and machine learning technology, to detect landmarks in the hundreds of thousands of images submitted by Stock contributors every week. This helps in categorizing images and identifying any potential intellectual property issues. Adobe's landmark dataset contains more than two million assets and the process of training the model to detect landmarks initially took around 7-8 days on a single-GPU machine. By switching to a multi-GPU machine and employing parallel computing, they managed to reduce the training time by 80%, bringing it down to 1-2 days without any impact on model accuracy2.
Adobe has further enhanced the value of its graphics dataset by adopting advanced machine learning techniques. To improve the efficiency of their AI training processes, they've transitioned from a single-GPU machine to a parallel computing approach with multi-GPU machines, resulting in a dramatic 80% reduction in training time without sacrificing model accuracy3.
Adobe's significant graphics dataset and its innovative application of AI technologies, as demonstrated in the integration of Generative AI and Adobe Firefly into Photoshop, contribute to its competitive advantage in the industry.
Please note that this is a preliminary research paper and you should continue to do your own research (DYOR). Information about assets can change rapidly, and it's essential to stay updated with the most recent developments.
Notes on how I personally use my charts/NFA:
Each level L1-L3 and TP1-TP3 (Or S1-S3) has a deployment percentage. The idea is to flag these levels so I can buy 11% at L1 , 28% at L2 and if L3 deploy 61% of assigned dry powder. The same in reverse goes for TP. TP1: 61%, TP2:28% and TP3:11%. If chart pivots between TP's, in-between or in Between Sell levels these percentages are still respected. I like to use the trading range to accumulate by using this tactic.
Just my personal way of using this. This is not intended or made to constitute any financial advice.
This is not intended or made to constitute any financial advice.
FED Macro Situation Consideration:
All TP's are drawn within the context of a return to FED neutral policy. I do not expect these levels to be reached before tightening is over.
NOT INVESTMENT ADVICE
I am not a financial advisor.
The Content in this TradingView Idea is for informational purposes only, you should not construe any such information or other material as legal, tax, investment, financial, or other advice. Nothing contained within this idea constitutes a solicitation, recommendation, endorsement, or offer to buy or sell any securities or other financial instruments in this or in in any other jurisdiction in which such solicitation or offer would be unlawful under the securities laws of such jurisdiction.
All Content on this idea post is information of a general nature and does not address the circumstances of any particular individual or entity. Nothing in the idea/post constitutes professional and/or financial advice, nor does any information on the idea/post constitute a comprehensive or complete statement of the matters discussed or the law relating thereto. You alone assume the sole responsibility of evaluating the merits and risks associated with the use of any information or other Content on the idea/post before making any decisions based on such information.

ADOBE $ADBE LongAdobe
Pattern: Ascending Triangle
Perspective: Long
Stop loss: when the chart pattern turns into a triangle wedge
NASDAQ:ADBE SKILLING:NASDAQ AMEX:SPY

ADOBE $ADBE LongAdobe
Chart Pattern: Ascending Triangle
Perspective: Long
Stop loss: when the chart pattern turns into a triangle wedge
NASDAQ:ADBE SKILLING:NASDAQ AMEX:SPY

ADOBE $ADBE LongAdobe
Chart Pattern: Ascending Triangle
Position : Long
Stop loss: when the chart pattern turns into a triangle wedge
NASDAQ:ADBE SKILLING:NASDAQ #ADOBE

Adobe -> The Forgotten StockHello Traders,
welcome to this free and educational multi-timeframe technical analysis .
On the weekly timeframe you can see that as we are speaking Adove stock is actually approaching a quite obvious previous weekly structure area which is now turned resistance exactly at the $380 level.
You can also see that overall weekly market structure is about to shift bullish, we are already having bullish weekly moving averages and the overall price behaviour of the past couple of weeks is looking very bullish so I simply do expect a break and retest of the resistance and then more continuation towards the upside.
On the daily timeframe you can see that Adobe stock is not creating bullish market structure yet - we are currently retesting previous daily support which is now turned resistance so I am just waiting for a clear break above the zone followed by a retest and then I do expect more daily continuation towards the upside.
Thank you for watching and I will see you tomorrow!

Adobe: Well On The Way 👍Adobe is well on the way to completing wave B in green, although the course still has got some room to expand the current movement. However, before the resistance at $402.49 at the latest, it should turn downwards again. Thus, the share should drop below the support at $278.23 and into the adjacent gray zone between $278.96 and $227.74, where it should then conclude wave b in gray. There is a 32% chance, though, for Adobe to continue the ascent above the resistance at $402.49. In that case, we would consider wave alt.b in gray to be already finished.

Adobe (ADBE) - Hidden bullish divergence On the chart, we can see a hidden bullish divergence. This means that the price will probably increase in the next coming period. Also, the gap needs to be filled and the earning announcement looks positive, these suggestions are in line with the hidden bullish divergence.
So an entry can be taken when the price breaks to the upside. Take your profits at the targets. All further details are shown on the chart.
Goodluck!

Adobe in a flag?Adobe - 30d expiry - We look to Buy at 328.71 (stop at 312.61)
Daily signals are mildly bullish.
Price action is forming a bullish flag which has a bias to break to the upside.
Trend line support is located at 327.
We look to buy dips.
We are trading at oversold extremes.
This stock has seen good sales growth.
50 1 day EMA is at 329.
Our profit targets will be 368.88 and 372.88
Resistance: 355.67 / 365.00 / 380.00
Support: 340.00 / 325.00 / 320.20
Disclaimer – Saxo Bank Group.
Please be reminded – you alone are responsible for your trading – both gains and losses. There is a very high degree of risk involved in trading. The technical analysis , like any and all indicators, strategies, columns, articles and other features accessible on/though this site (including those from Signal Centre) are for informational purposes only and should not be construed as investment advice by you. Such technical analysis are believed to be obtained from sources believed to be reliable, but not warrant their respective completeness or accuracy, or warrant any results from the use of the information. Your use of the technical analysis , as would also your use of any and all mentioned indicators, strategies, columns, articles and all other features, is entirely at your own risk and it is your sole responsibility to evaluate the accuracy, completeness and usefulness (including suitability) of the information. You should assess the risk of any trade with your financial adviser and make your own independent decision(s) regarding any tradable products which may be the subject matter of the technical analysis or any of the said indicators, strategies, columns, articles and all other features.
Please also be reminded that if despite the above, any of the said technical analysis (or any of the said indicators, strategies, columns, articles and other features accessible on/through this site) is found to be advisory or a recommendation; and not merely informational in nature, the same is in any event provided with the intention of being for general circulation and availability only. As such it is not intended to and does not form part of any offer or recommendation directed at you specifically, or have any regard to the investment objectives, financial situation or needs of yourself or any other specific person. Before committing to a trade or investment therefore, please seek advice from a financial or other professional adviser regarding the suitability of the product for you and (where available) read the relevant product offer/description documents, including the risk disclosures. If you do not wish to seek such financial advice, please still exercise your mind and consider carefully whether the product is suitable for you because you alone remain responsible for your trading – both gains and losses.

ADBE Adobe Inc Options Ahead Of EarningsLooking at the ADBE Adobe Inc options chain ahead of earnings , i would buy the $325 strike price Puts with
2023-01-20 expiration date for about
$17.25 premium.
If the options turn out to be profitable Before the earnings release, i would sell at least 50%.
Looking forward to read your opinion about it.

ADOBE shortNot to late to go short, all confirmations check, rupture of the support, pullback and now a flag pattern. I'm going to entry short now, but wait until the flag's break is a good option too

Adobe Analysis 20.11.2022Hello Traders,
welcome to this free and educational analysis.
I am going to explain where I think this asset is going to go over the next few days and weeks and where I would look for trading opportunities.
If you have any questions or suggestions which asset I should analyse tomorrow, please leave a comment below.
I will personally reply to every single comment!
If you enjoyed this analysis, I would definitely appreciate it, if you smash that like button and maybe consider following my channel.
Thank you for watching and I will see you tomorrow!

ADOBE INC - BEARISH CENARIOTough times for Adobe and its investors.
The software giant is facing the biggest stock decline in years. The price already reached the COVID-19 bottom and it looks like this is not the end.
The rapid lifting of the interest rates by the central banks means more reduction in consumer demand and lesser price increases. In the near term, sales and profit margins are likely to drop from current estimates.
Adobe Inc recently announced a lowered revenue guidance for 2023 also affected by the change in the currency rates.
In a short-term correction is possible to the major resistance located at the $ 300.
The long-term scenario is a breakout of the local $ 270 support level and a new drop to the $ 205 support level.
Risk Disclosure: Trading Foreign Exchange (Forex) and Contracts of Difference (CFD's) carries a high level of risk. By registering and signing up, any client affirms their understanding of their own personal accountability for all transactions performed within their account and recognizes the risks associated with trading on such markets and on such sites. Furthermore, one understands that the company carries zero influence over transactions, markets, and trading signals, therefore, cannot be held liable nor guarantee any profits or losses.

ADOBE INCADOBE INC - Forming Bat Pattern. Which will give target as Marked in yellow 323 . Also there is huge gap down so gap filling will happen.
Disclaimer - This is my personal view for learning purpose. Not a trading recommendation.

Adobethe mm begins to tilt, we are on a weekly support, a pause is understandable, let's see if a flag forms, the volumes are correct

End of Adobe down to $6.90I popped on this chart on Daily and Weekly and it shows a morbid picture of the price heading to $6.90...
I hope I am wrong, because these eternal giants don't deserve such a crash.

Green on Adobe. ADBEFlat finished. We are due for another fractal. Betting on further growth given relative and short term growth in the indices.
We are not in the business of getting every prediction right, no one ever does and that is not the aim of the game. The Fibonacci targets are highlighted in purple with invalidation in red. Confirmation level, where relevant, is a pink dotted, finite line. Fibonacci goals, it is prudent to suggest, are nothing more than mere fractally evident and therefore statistically likely levels that the market will go to. Having said that, the market will always do what it wants and always has a mind of its own. Therefore, none of this is financial advice, so do your own research and rely only on your own analysis. Trading is a true one man sport. Good luck out there and stay safe.

Adobe on a sale!Adobe - 30D Expiry - We look to Buy a break of 301.11 (stop at 284.98)
With signals for sentiment at oversold extremes, the dip could not be extended.
Although the bears are in control, the stalling negative momentum indicates a turnaround is possible.
Trading close to the psychological 300.00 level.
We expect a significant move higher if prices manage to break the 300.00 resistance.
The measured move target is 360.00.
Our profit targets will be 349.49 and 359.49
Resistance: 290.00 / 300.00 / 312.00
Support: 275.00 / 265.00 / 255.00
Disclaimer – Saxo Bank Group. Please be reminded – you alone are responsible for your trading – both gains and losses. There is a very high degree of risk involved in trading. The technical analysis , like any and all indicators, strategies, columns, articles and other features accessible on/though this site (including those from Signal Centre) are for informational purposes only and should not be construed as investment advice by you. Such technical analysis are believed to be obtained from sources believed to be reliable, but not warrant their respective completeness or accuracy, or warrant any results from the use of the information. Your use of the technical analysis , as would also your use of any and all mentioned indicators, strategies, columns, articles and all other features, is entirely at your own risk and it is your sole responsibility to evaluate the accuracy, completeness and usefulness (including suitability) of the information. You should assess the risk of any trade with your financial adviser and make your own independent decision(s) regarding any tradable products which may be the subject matter of the technical analysis or any of the said indicators, strategies, columns, articles and all other features.
Please also be reminded that if despite the above, any of the said technical analysis (or any of the said indicators, strategies, columns, articles and other features accessible on/through this site) is found to be advisory or a recommendation; and not merely informational in nature, the same is in any event provided with the intention of being for general circulation and availability only. As such it is not intended to and does not form part of any offer or recommendation directed at you specifically, or have any regard to the investment objectives, financial situation or needs of yourself or any other specific person. Before committing to a trade or investment therefore, please seek advice from a financial or other professional adviser regarding the suitability of the product for you and (where available) read the relevant product offer/description documents, including the risk disclosures. If you do not wish to seek such financial advice, please still exercise your mind and consider carefully whether the product is suitable for you because you alone remain responsible for your trading – both gains and losses

SPY Fractal: will SPY re-capture 390 after a hammer & engulfing?Pessimism is all over with analyst calling for recession & another 20% drop from 390. SPY already made an impressive recovery from June Low even touching ma200 line but then falls back to the 390 zone after high inflation data. Further rally was again delayed by FDX declaring recession & slashing guidance. Adobe also contributed to the pessimism after investors didn’t like its over-priced purchase of a competitor.
POSITIVE VIEW: UPS’s announcement did not quite agree with FDX so maybe FDX is just losing its logistics business to UPS & AMZN. Market may have over-reacted. If after today, FED raises by 75 basis points which was already priced in, SPY may continue to bounce especially now that it already made a hammer & a bullish engulfing candle in the last 2 days. Maybe SPY will initially tank to make a bigger bulltrap before rising above 390 again. This will confirm the ongoing bullish divergences & a rally
may follow soon. SPY now at the crossroad of my dotted 0.786 Fib Channel line & the pandemic trendline.
Also, price action is somewhat similar to the fractal in the chart which ends bullish.
NEGATIVE SIDE: End of September is historically bearish before a rally in the 4Q.
BUT this time it may be different.
Not trading advice

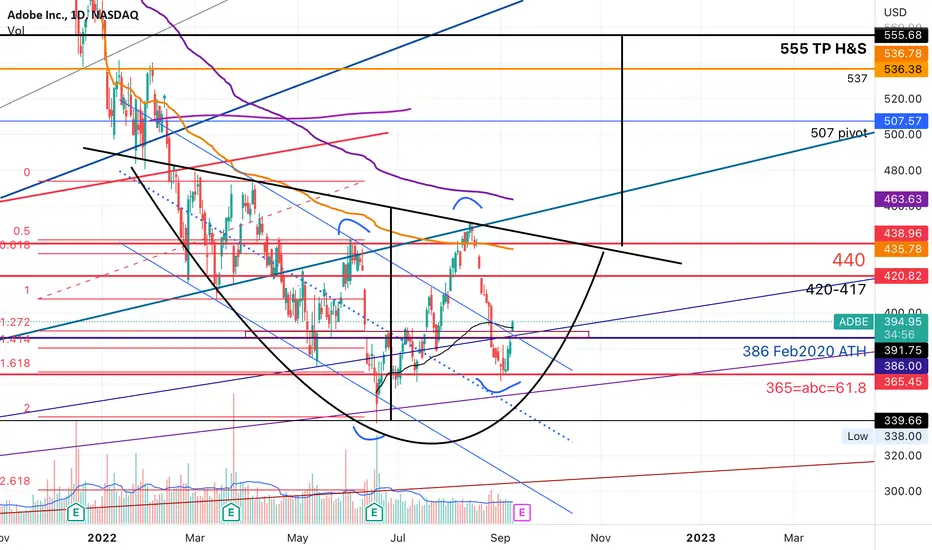
ADBE higher high higher low; Target of Inv H&S id 555ADBE just broke above some resistance lines as shown in the chart. Here I used GANN lines.
It broke above a small resistance zone & the downward channel. If the huge inverse H&S pattern plays out, there
Will be a huge upside with TP at 555.
A fundamental very good company with a lot of moat.
Not trading advice
ADBENot financial advice.
The essence of investing & trading is the intelligent and patient preying on the greed, fear, impatience, addiction and ignorance of the majority. It's definitionally Darwinian.
