ADBE formed a consolidation PatternSeek for entry opportunities in the 1D chart above the 450.
Target Price: 535
Expected Return:19%
Adobe

ADBE Preparing to Breakout off RetracementNASDAQ:ADBE FWB:ADB NASDAQ:ADBE
ADBE is completing the retracement wave - symetri triangle.
Long upon breakout for next impulsive wave.

ADBE short with LONG entry levelsADBE just broke the support around $463, and we are heading to another support around $438. This could be a good entry-level for long positions. The area from $417 to $438 is a big support zone.
ADOBE INC is a strong company with a strong base of customers. The perfect subscription model with a monthly fee and irreplaceable software that is used worldwide guarantees stable profits.
Entry levels LONG positions:
$438
$423
$417 - STRONG BUY

Adobe / long / 21 day trade prediction. ( for study )NASDAQ:ADBE
This is a test entry post (no1) to examine platform and explore personal study / theory only.

2/10 Quarterly Update (End of year 2020)Hey guys,
as you know, each quarter 10 Videos/Charts.
This is a number, enjoy it :)
Today we discuss some stocks, the first video was about the crypto asset class. There will be other asset classes, like main videos them for example about spx or dow jones or dax, as well as other financial derivates. In between them, the other videos will contain random stocks, which we encounter, while streaming.
So the next one will discuss a few stocks of the "good stocks" list.
The next asset class video will be about forex or commodities.
Thereafter will be more stock examples and finally, the last videos will again be about a major asset class and the last one will be about trading ideas for 2021.
And as always, thank you for tuning in, happy trading everybody,
roman from -ger-quality-trades-


Bearish divergence around earnings?To 470 dip at earnings. If it loses the support channel, it's going Tom Petty.
**Freeeeee Fallinngggggggg**

ADOBE INC. LONG📈 NASDAQ:ADBE LONG D1
🛒BUY above = 503
🎯Target1 = 518.40
🎯Target2 = 528
🛑Stop loss or cancel trade = 477.80
🙈Recommended risk = (2%-3%)

$ADBE Adobe Poised for a Run$ADBE Broke out of a falling wedge pattern to the upside today on the daily chart, held the 20d ema line as support and closed above recent highs. Expect to see a strong continuation move in the coming days.
Also of note, we saw some bullish unusual options activity late last week with 5k $420.00 strike (deep ITM) Jan'21 calls traded Friday vs open interest <300 or 19 times OI. These contracts were over $8k each for a total premium outlay of $42.1M - this was likely a large hedge fund trade.
Near term target - $540-$560 range by late October
Note This is NOT investment advice.


ADOBEHere might be a great deal, if it crosses and sustained above my trend line for some time !! (all levels marked) !


ADBE in the eye of the bullPpSIgnal has developed a MACD NRP, which uses moving averages that are more sensitive to price movement.
As we can see in the weekly chart, it is very successful and can give us information prior to a market movement in lower timeframes.
CORRECTION at marked Fibonacci levels
Espanish
PpSignal ha desarrollado un MACD NRP, que utiliza medias móviles más sensibles al movimiento del precio.
Como podemos observar en el gráfico semanal es muy acertado y puede darnos una información previa a un movimiento del mercado en timeframe menores.
CORRECCIÓN a niveles de fibonacci


ADBE - Ready to Break Out (9.8% Potential Profit)Support tested multiple times in an Uptrend Corridor.
RSI + Stoch well above 50.
MACD above Signal.
Target price +/- $487.00 and 9.8% potential profit.


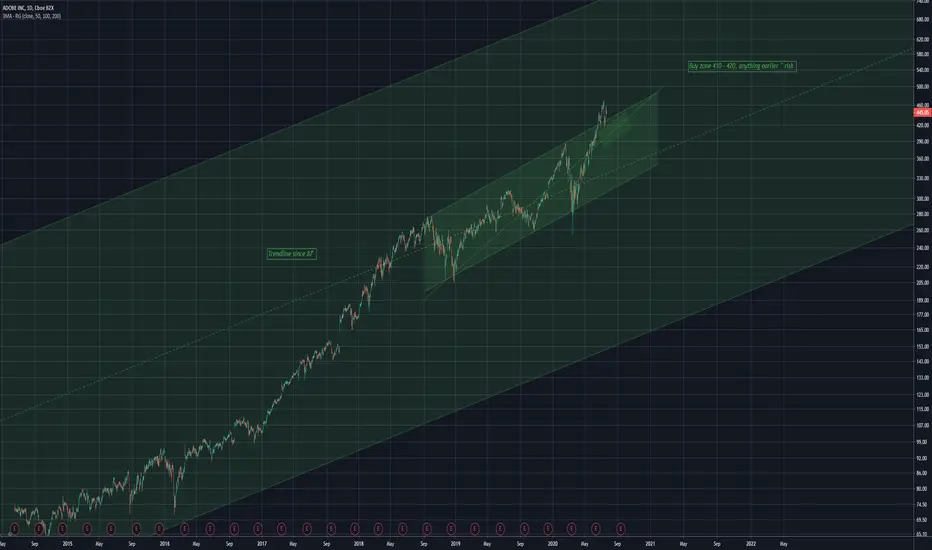
ADBE ChannelsChannels forming for adobe
A strong uptrend since 87' has formed
Currently it is sitting above the middle of that trendline
Listed buy zones, risk increases any entry earlier than these levels

ADOBE, Major Break Below Key Trendline, Continuation Possible!Hello Traders Investors And Community, welcome to this analysis about the stock market and a single stock value ADOBE INC, we are looking at the 4-hour timeframe perspective, the recent events, the current interesting formational structure and finally what we can expect from the stock the next days, hours and weeks. I already mentioned PAYPAL some days ago which is actually building a really similar formation to the one in within this stock, I highly recommend you to watch this to have a full-depth-overview and a suitable to this stock, furthermore, this does not mean the whole stock market is building the same structure there are stocks which looking still bullish and strong while stocks which even did not rally and trading below the established all-time-highs.
As you can watch when looking at my chart is that ADBE INC just fell below this meaningful trendline which is marked in red, this trendline held the whole uptrend to the upside and is now broken to the downside which is firstly a strong bearish signal, besides that the breakdown occurred with high volume as you can see in my chart which is increasing the strongness of this move. Another factor which is also confirming the actual current bearish pressure is the fact that ADBE INC builds a possible head and shoulder reversal top formation here which you can see marked with the blue neckline and the other details of this formation, currently forming the right shoulder of this formation.
Taking all these signs into consideration we can assume that the volatile bearish breakdowns seen since the established highs aren't over yet and a great possibility is given for continuation to the downside when the head and shoulder confirm properly. When this happens and the neckline breaks to the downside the head and shoulder target zone marked in green in the 370-365 level will be activated. On the way to this target zone, there is still strong resistance formed by previous highs at 385 but when the trend is strong enough this can only play a marginal role. Overall it is a high possible bearish setup when the head and shoulder confirms which can be traded either aggressive with immediate entry or conservative with an entry below the neckline confirmation.
As more than one stocks in the bigger market cap stocks showing these bearish signs which before showed strongness and rallied to new highs, it should be considered with caution because it can indicate a follow up of other stocks in the large market-caps which can signal a possible bearish shape in the rest market, as the corona pandemic is still going on and a second way is not from the desk we should not keep the bearish perspective out of the sight now as the S&P is still below its all-time-high and did not confirm the full bullish continuation and bear-market-ending till now. We will examine how this whole situation develops and if these are just correction or resulting in bigger and stronger bearish environments concerning other stocks and main market also.
In this manner, thank you for watching, support for more market insight, have a great day, and all the best to you!
Enlightenment is under our feet as well as over our heads.
Information provided is only educational and should not be used to take action in the markets.

