AMD is a strong short-term BuyAdvanced Micro Devices (AMD) has been practically consolidating since the October 13 Low. As the long-term trend has been bearish within a Channel Down pattern since the November 30 2021 Market High, the current consolidation following the rebound on the (dashed) Lower Low (diverging) trend-line can be seen as an Accumulation Phase preparing for the next bullish leg to the top of the Channel.
As you see all previous legs within the Channel Down have been following a certain pattern. After a (near) 30.00 1D RSI reading, and a MACD Bullish Cross, the price rebounds to at least the 0.618 Fibonacci retracement level. That is currently at 85.68 buy is outside the Channel Down, so we will settle for a Target within 73.50 - 77.50. Only a break above the 1D MA200 (orange trend-line) can be considered a long-term trend change to bullish.
See how the 1D MACD prints Higher Highs and each break above the Pivot is larger. More or less this is consistent with the price breaks above the 1D MA50 (blue trend-line).
-------------------------------------------------------------------------------
** Please LIKE 👍, SUBSCRIBE ✅, SHARE 🙌 and COMMENT ✍ if you enjoy this idea! Also share your ideas and charts in the comments section below! This is best way to keep it relevant, support me, keep the content here free and allow the idea to reach as many people as possible. **
-------------------------------------------------------------------------------
You may also TELL ME 🙋♀️🙋♂️ in the comments section which symbol you want me to analyze next and on which time-frame. The one with the most posts will be published tomorrow! 👏🎁
-------------------------------------------------------------------------------
👇 👇 👇 👇 👇 👇
💸💸💸💸💸💸
👇 👇 👇 👇 👇 👇
Advancedmicrodevices

AMD Advanced Micro Devices Options Ahead of EarningsLooking at the AMD Advanced Micro Devices options chain, i would buy the $60 strike price Puts with
2022-11-4 expiration date for about
$1.81 premium.
If the options turn out to be profitable Before the earnings release, i would sell at least 50%.
Looking forward to read your opinion about it.

AMD (NASDAQ: $AMD) Ready To Rocket Higher 🚀Advanced Micro Devices, Inc. operates as a semiconductor company worldwide. The company operates in two segments, Computing and Graphics; and Enterprise, Embedded and Semi-Custom. Its products include x86 microprocessors as an accelerated processing unit, chipsets, discrete and integrated graphics processing units (GPUs), data center and professional GPUs, and development services; and server and embedded processors, and semi-custom System-on-Chip (SoC) products, development services, and technology for game consoles. The company provides processors for desktop and notebook personal computers under the AMD Ryzen, AMD Ryzen PRO, Ryzen Threadripper, Ryzen Threadripper PRO, AMD Athlon, AMD Athlon PRO, AMD FX, AMD A-Series, and AMD PRO A-Series processors brands; discrete GPUs for desktop and notebook PCs under the AMD Radeon graphics, AMD Embedded Radeon graphics brands; and professional graphics products under the AMD Radeon Pro and AMD FirePro graphics brands. It also offers Radeon Instinct, Radeon PRO V-series, and AMD Instinct accelerators for servers; chipsets under the AMD trademark; microprocessors for servers under the AMD EPYC; embedded processor solutions under the AMD Athlon, AMD Geode, AMD Ryzen, AMD EPYC, AMD R-Series, and G-Series processors brands; and customer-specific solutions based on AMD CPU, GPU, and multi-media technologies, as well as semi-custom SoC products. It serves original equipment manufacturers, public cloud service providers, original design manufacturers, system integrators, independent distributors, online retailers, and add-in-board manufacturers through its direct sales force, independent distributors, and sales representatives. The company was incorporated in 1969 and is headquartered in Santa Clara, California.

Advanced Micro Devices Analyze!!!😉Advanced Micro Devices (AMD) completed a Double Zigzag correction in Descending channel.
AMD is completing one of the impulsive waves in my resistance zone, and I expect AMD goes down again to the support zone.
Also, Every time AMD has risen slightly above the EMA 111, it has fallen again (this is the fourth time).
Advanced Micro Devices Analyze, Daily Timeframe (Logscale).
🔴Resistance Zone🔴: 100.4$ until 98.3$
🟢Support Zone🟢:85$ until 82.9$
❗️Note❗️: If AMD breaks(valid) the resistance zone, then we can verify the end of the correction.
Do not forget to put Stop loss for your positions (For every position you want to open).
Please follow your strategy, this is just my idea, and I will be glad to see your ideas in this post.
Please do not forget the ✅' like '✅ button 🙏😊 & Share it with your friends; thanks, and Trade safe

Why is AMD stock starting to look like a chip bargain?/Lately, everyone seems to have forgotten what an important company Advanced Micro Devices (NASDAQ: AMD ) is. Some traders have dumped AMD stock as if it were toxic. They appreciate the ongoing tension between the US and China. Still, investors shouldn't dismiss Advanced Micro Devices, as the chipmaker's products are still cutting edge and indispensable.
The modern world cannot exist without microprocessors. They control our cars, computers, and phones. There would be no Internet of Things without semiconductors. And Advanced Micro Devices makes some of the most powerful chips on the market, InvestorPlace writes.
So contrarian investors can lean into the volatility and grab Advanced Micro Devices stock before it gets expensive again. Chip market opportunities like this are rare and can be quite lucrative for daring traders.
//Positive catalysts are not included in AMD stock
It's amazing how quickly investors can forget about positive news. As soon as an obvious disaster happens (like the Sino-US tech war), it grabs people's attention and sometimes they panic and sell perfectly good stocks.
///What can you do now?
To a large extent, the tension between the US and China has already affected AMD shares. Surprisingly, the stock has lost half its value this year.
In addition, Advanced Micro Devices continues to threaten its competitors with premium products. Therefore, AMD investors should stay in the trade and consider adding to their positions while the stock is still cheap.

$AMD Inverse Head & Shoulder - Bring the dip ill buy the chips!Semi-conductors/chip stocks took a big dip this week after more negative earnings reported.
I am watching this inverse head & Shoulder pattern for a reversal with huge upside potential.
Declining selling volume.
Near oversold RSI
High risk (manage risk) as we are at a major support level. If we lose this level, the weight could get really heavy back into the 70's range.. are you catching my drift?

AMD Advanced Micro Devices Options Ahead Of EarningsLooking at the AMD Advanced Micro Devices options chain, i would buy the $110 calls with
2022-9-16 expiration date for about
$1.54 premium.
Looking forward to read your opinion about it.

AMD:Bear market rally or turnaround?Advanced Micro Devices
Short Term - We look to Buy at 76.98 (stop at 72.75)
The primary trend remains bearish. We are assessed to be in a corrective mode higher. The daily chart technicals suggests further upside before the downtrend returns. Trend line support is located at 76.00. Dip buying offers good risk/reward.
Our profit targets will be 90.00 and 95.00
Resistance: 90.00 / 110.00 / 125.00
Support: 76.00 / 60.00 / 40.00
Please be advised that the information presented on TradingView is provided to Vantage (‘Vantage Global Limited’, ‘we’) by a third-party provider (‘Signal Centre’) . Please be reminded that you are solely responsible for the trading decisions on your account. There is a very high degree of risk involved in trading. Any information and/or content is intended entirely for research, educational and informational purposes only and does not constitute investment or consultation advice or investment strategy. The information is not tailored to the investment needs of any specific person and therefore does not involve a consideration of any of the investment objectives, financial situation or needs of any viewer that may receive it. Kindly also note that past performance is not a reliable indicator of future results. Actual results may differ materially from those anticipated in forward-looking or past performance statements. We assume no liability as to the accuracy or completeness of any of the information and/or content provided herein and the Company cannot be held responsible for any omission, mistake nor for any loss or damage including without limitation to any loss of profit which may arise from reliance on any information supplied by Signal Centre.

$AMD Advanced Micro Devices $AMD has been on a downward spiral printing bearish consolidation patterns after each drop.
The negative earnings report recently didn't help the stock price as you can see it has plummeted to a major support level.
It hasn't shown any signs of reversal yet. If it breaks below $72 it doesn't have much support until $59 area. YIKES!
As most tech stocks, AMD is overvalued in its current price.
The company has initiated a pullback on the consumer PC department (as sales have declined) and acquired a company this year to position growth in AI, apps and robotics.
AMD is well positioned and one of my top tech picks for bear market accumulation, as our world continues to develop in the digital age, AMD is a leader in memory and storage and is modeling change for future growth.
I believe AMD is a solid company that is positioned for new heights.
This is NOT Financial Advice.

AMD shortEthereum going PoS => gpus for mining not needed. Gpus will flood aftermarket from the miners and retail consumers can buy gpus cheap, thus reducing sales. Roughly 20B$ worth of gpus will be unusable which is more than AMDs yearly earnings. Granted AMD does not have 100% market share(NVIDIA). But this should greatly affect their gpus sales late 2022 and early 2023. Also the FED is raising rates and starting to tighten up, which could affect growth stocks and tech negatively if the market becomes risk off. I think this thesis can be applied to NVIDIA as well although AMD gpus are a bit more popular among the miners.

AMD Forward P/E discountIf you haven`t bought AMD here:
or here:
then you should know that AMD is trading at a 61% forward P/E ratio discount versus the 5 year average!
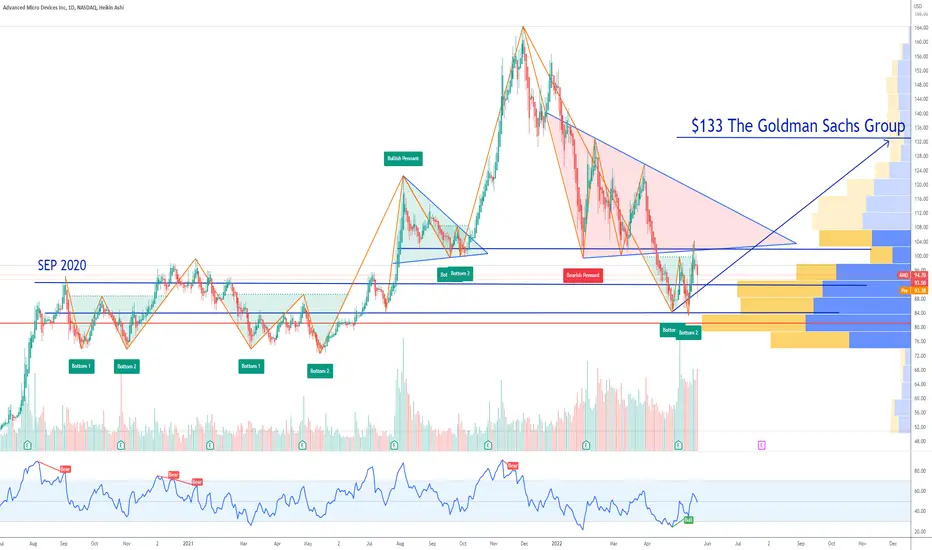
The Goldman Sachs Group has an $133 price target for it!
Looking forward to read your opinion about it.
5/4/22 AMD Advanced Micro Devices ( NASDAQ:AMD )
Sector: Electronic Technology (Semiconductors)
Market Capitalization: 161.076B
Current Price: $99.42
Breakout price: $100.00
Buy Zone (Top/Bottom Range): $97.85-$84.75
Price Target: $113.80-$117.60 (1st), $138.30-$141.40 (2nd)
Estimated Duration to Target: 20-21d (1st), 38-40d (2nd)
Contract of Interest: $AMD 5/20/22 100c, $AMD 6/17/22 110c
Trade price as of publish date: $4.41/contract, $3.45/contract

AMD earnings beat | Strong Buy Rating AMD entered the Buy area on oversold level predicted here:
AMD Q1 2022 Earnings:
EPS $1.13 vs $0.91 expected
Revenue $5.9B vs $5.2B expected
On 4/25/2022 Raymond James Upgraded AMD from Outperform to Strong-Buy setting a price target of $160.00
I think a reversal to $102 is most likely.
Looking forward to read your opinion about it.

Advanced Micro Devices (AMD) | Approaching Strong Support Zone!Hi,
2022 first Q results on May 3.
Technical criteria:
1. Strong horizontal price areas
2. Mid-number $50
3. Channel projection
4. AB=CD
5. Fibo retracement
6. Fibo Extension
7. Different timeframe EMA's
8.* 50% from ATH
Do your own research and if it's matching with my TA you are ready to invest.
Regards,
Vaido

AMD I like $166 next target, big run ahead I think So much confluence, volume profile looks ripe and similar to previous capitulations, looking so good.
AMD (Advanced Micro Devices) - Bearish Weekly Price DowntrendAMD (Advanced Micro Devices) stock price has been in a weekly downtrend, and is currently seeking a lower-low in the price.
If quarterly financial earnings and news this year are not satisfactory, AMD stock price could test support levels to the downside.
Bearish Price Targets: $85, $75, $65.
Head-and-shoulders chart pattern confirmed, loss of $100 price support level, breakdown of parabolic support curve -- all are bearish technical chart events.
All content is Not financial advice. Trade at your own risk.

AMD at $100Advanced Micro Devices
Short Term - We look to Sell at 102.78 (stop at 111.05)
Preferred trade is to sell into rallies. Previous support at 100.00 now becomes resistance. 20 1day EMA is at 107.00. Short term oscillators have turned negative. Trading close to the psychological 100.00 level.
Our profit targets will be 74.92 and 69.10
Resistance: 100.00 / 125.00 / 155.00
Support: 80.00 / 73.00 / 60.00
Disclaimer – Saxo Bank Group. Please be reminded – you alone are responsible for your trading – both gains and losses. There is a very high degree of risk involved in trading. The technical analysis, like any and all indicators, strategies, columns, articles and other features accessible on/though this site (including those from Signal Centre) are for informational purposes only and should not be construed as investment advice by you. Such technical analysis are believed to be obtained from sources believed to be reliable, but not warrant their respective completeness or accuracy, or warrant any results from the use of the information. Your use of the technical analysis, as would also your use of any and all mentioned indicators, strategies, columns, articles and all other features, is entirely at your own risk and it is your sole responsibility to evaluate the accuracy, completeness and usefulness (including suitability) of the information. You should assess the risk of any trade with your financial adviser and make your own independent decision(s) regarding any tradable products which may be the subject matter of the technical analysis or any of the said indicators, strategies, columns, articles and all other features.
Please also be reminded that if despite the above, any of the said technical analysis (or any of the said indicators, strategies, columns, articles and other features accessible on/through this site) is found to be advisory or a recommendation; and not merely informational in nature, the same is in any event provided with the intention of being for general circulation and availability only. As such it is not intended to and does not form part of any offer or recommendation directed at you specifically, or have any regard to the investment objectives, financial situation or needs of yourself or any other specific person. Before committing to a trade or investment therefore, please seek advice from a financial or other professional adviser regarding the suitability of the product for you and (where available) read the relevant product offer/description documents, including the risk disclosures. If you do not wish to seek such financial advice, please still exercise your mind and consider carefully whether the product is suitable for you because you alone remain responsible for your trading – both gains and losses.

AMD Tested 38 Year ResistanceSo the question on everyone's mind is, what now? Well, the answer isn't always so simple.
This is a High Time Frame so it takes a long while for things to set into motion. All we can do here is gauge exactly how far this cycle is extended and how far AMD has come.
By any measure from this chart, to say we aren't approaching the end of this cycle would be pretty absurd at this point.
RSI showing Bearish Divergence on HTFs, paired with testing 38-year resistance.
Can it have a bounce and ride another small wave up? Sure, markets can stay irrational. But simply put, it can only run on for so long.
Here is a Lower Time Frame representing the Parabola it has been respecting for almost 4 years now. This breakdown clearly shows weakness as we are heading into the later stage of this cycle. A break of roughly 4-year market structure shouldn't be understated.
A different perspective measuring each wave up and down since 1975. Notice how similar each and every correction is (between 91-96%).
This post is just meant to show some perspective of how far we actually have pumped this cycle; if there was ever any question. Seems like most still are expected huge incredible rallies, and Im not sure to what extent we get that.
For further confirmation, here is my previous post on USOIL/SPX. (Very in-depth and informative analysis)
Hope this helps!

Advanced Micro Devices (NASDAQ: $AMD) Nearing 100-Day MA! 💻Advanced Micro Devices, Inc. operates as a semiconductor company worldwide. The company operates in two segments, Computing and Graphics; and Enterprise, Embedded and Semi-Custom. Its products include x86 microprocessors as an accelerated processing unit, chipsets, discrete and integrated graphics processing units (GPUs), data center and professional GPUs, and development services; and server and embedded processors, and semi-custom System-on-Chip (SoC) products, development services, and technology for game consoles. The company provides processors for desktop and notebook personal computers under the AMD Ryzen, AMD Ryzen PRO, Ryzen Threadripper, Ryzen Threadripper PRO, AMD Athlon, AMD Athlon PRO, AMD FX, AMD A-Series, and AMD PRO A-Series processors brands; discrete GPUs for desktop and notebook PCs under the AMD Radeon graphics, AMD Embedded Radeon graphics brands; and professional graphics products under the AMD Radeon Pro and AMD FirePro graphics brands. It also offers Radeon Instinct, Radeon PRO V-series, and AMD Instinct accelerators for servers; chipsets under the AMD trademark; microprocessors for servers under the AMD EPYC; embedded processor solutions under the AMD Athlon, AMD Geode, AMD Ryzen, AMD EPYC, AMD R-Series, and G-Series processors brands; and customer-specific solutions based on AMD CPU, GPU, and multi-media technologies, as well as semi-custom SoC products. It serves original equipment manufacturers, public cloud service providers, original design manufacturers, system integrators, independent distributors, online retailers, and add-in-board manufacturers through its direct sales force, independent distributors, and sales representatives. The company was incorporated in 1969 and is headquartered in Santa Clara, California.

AMD miscalculated. AMDGoals 101, 92, 81.
We are not in the business of getting every prediction right, no one ever does and that is not the aim of the game. The Fibonacci targets are highlighted in purple with invalidation in red. Fibonacci goals, it is prudent to suggest, are nothing more than mere fractally evident and therefore statistically likely levels that the market will go to. Having said that, the market will always do what it wants and always has a mind of its own. Therefore, none of this is financial advice, so do your own research and rely only on your own analysis. Trading is a true one man sport. Good luck out there and stay safe

AMD Aimed Higher? Advanced Micro Devices
Short Term - We look to Buy at 101.31 (stop at 96.59)
We look to buy dips. 100.00 continues to hold back the bears. Trading close to the psychological 100.00 level. We expect a move higher in a corrective sequence, targeting Fibonacci retracement levels.
Our profit targets will be 114.62 and 123.06
Resistance: 120.00 / 145.00 / 155.00
Support: 100.00 / 84.00 / 72.00
Disclaimer – Saxo Bank Group. Please be reminded – you alone are responsible for your trading – both gains and losses. There is a very high degree of risk involved in trading. The technical analysis, like any and all indicators, strategies, columns, articles and other features accessible on/though this site (including those from Signal Centre) are for informational purposes only and should not be construed as investment advice by you. Such technical analysis are believed to be obtained from sources believed to be reliable, but not warrant their respective completeness or accuracy, or warrant any results from the use of the information. Your use of the technical analysis, as would also your use of any and all mentioned indicators, strategies, columns, articles and all other features, is entirely at your own risk and it is your sole responsibility to evaluate the accuracy, completeness and usefulness (including suitability) of the information. You should assess the risk of any trade with your financial adviser and make your own independent decision(s) regarding any tradable products which may be the subject matter of the technical analysis or any of the said indicators, strategies, columns, articles and all other features.
Please also be reminded that if despite the above, any of the said technical analysis (or any of the said indicators, strategies, columns, articles and other features accessible on/through this site) is found to be advisory or a recommendation; and not merely informational in nature, the same is in any event provided with the intention of being for general circulation and availability only. As such it is not intended to and does not form part of any offer or recommendation directed at you specifically, or have any regard to the investment objectives, financial situation or needs of yourself or any other specific person. Before committing to a trade or investment therefore, please seek advice from a financial or other professional adviser regarding the suitability of the product for you and (where available) read the relevant product offer/description documents, including the risk disclosures. If you do not wish to seek such financial advice, please still exercise your mind and consider carefully whether the product is suitable for you because you alone remain responsible for your trading – both gains and losses.

AMD Expressing Tech Weakness?As anyone with any tech knowledge knows, chips arent going anywhere. They are the future and they are here to stay.
But at the moment AMD is showing us something very interesting, which is it is starting to break 4-year long market structure. As you can see price has respected this channel 6 times as I've marked on the chart.
5 out of 6 of those touches brought strong volume and strong price action.
On this last touch, there was a nice bounce initially with good volume but the price quickly reversed and has since been moving further from the trendline under the 200MA.
The FED policy is going to be the biggest factor going forward. How they plan to combat inflation and how much they actually want to follow through with what they say.
Right now tech is in a situation where it must start gaining momentum soon or trouble could already be at our doorstep.
Only time will tell!

AMD analysis 01/04/2022Weekly chart Analysis
Potential H&S pattern in the making
Support confluence on 100EMA, Horizontal support zone, Diagonal support line, Ichimoku Cloud supports all lineup well.
The concern I have is a fundamental one, when looking at tech stocks, they may be dropping further if we keep printing higher yields (US10Y & US30Y) (since they are negatively correlated).
Also, the NQ reached 0.618 level ( retracement from the last high )
