Bearish DragonPrice should break below the pattern neckline level to trigger sell entry . Profit target is on the chart .
Advancedpatterns

Emerging Bull BatThe pattern still needs to complete the D leg then we go long . Profit targets and stop loss are on the chart .

Bullish DragonThe pattern needs to trigger with price going beyond the neckline of the pattern . Profit target is on the chart .

Bullish GartleyPrice is at a strong support zone and it may reverse due to the harmonic pattern . Profit targets are shown on the chart .

Bearish Butterfly + Bearish CrabTwo harmonic patterns formed with price showing signs of reversal by a double top price pattern . profit targets are on the chart .

Bearish ButterflyThe pattern formed at a strong resistance zone and price may reverse to hit profit targets shown on the chart .

Bearish SharkPrice is at a strong resistance level and showing sign of reversal . profit target is on the chart

Bearish GartleyThe pattern is at a strong resistance zone and price may reverse to hit profit targets shown on the chart .

Bearish ButterflyThe pattern may make price retest the previous resistance after price broke out of it . Profit targets are on the chart .

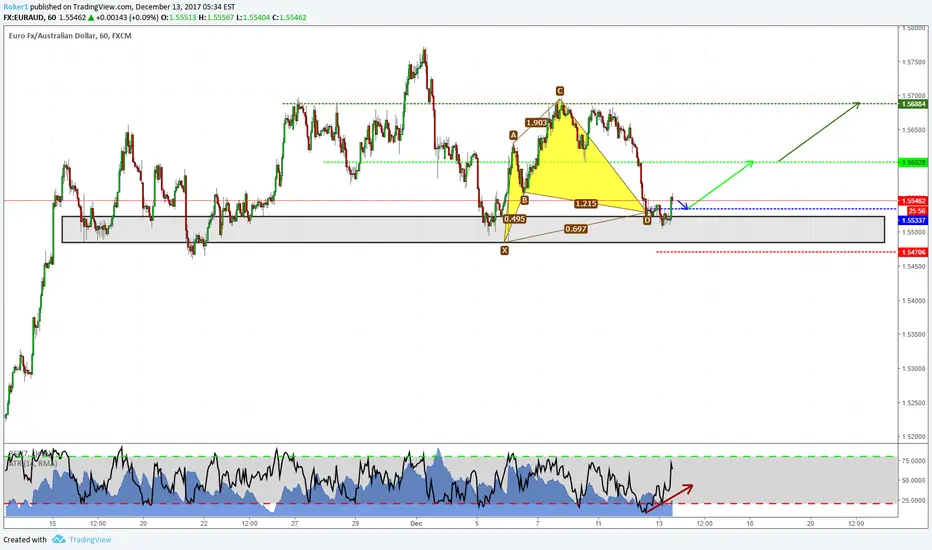
Harmonics + Structure on EURAUDHey guys,
i'm ready to go long in this market and here i'll explain you why. On the daily chart, we've recently broken a major resistance level and when price broke that level it wasn't immediately pushed back by sellers but calmly came down to that former resistance as if sellers weren't strong enough to turn that break into a false breakout. With these conditions, i want to look for trading opportunities on the lower timeframes, such as the 4H and 1H. Here you can see the hourly chart that provided me with an harmonic pattern completed right at the intraday support level that's the last before a nosedive. After the completion price immediately was bought and created an engulfing candle, both here and on the 4H, with a strong RSI divergence on top of that. All this clues add up and i'm ready to go long, with stops below the low and targets as shown on the chart!
If you have any question, feel free to ask.
If you have your stance to share, feel free as well.
See you in the next chart!
Harmonics in play on GBPNZD!Hi guys,
on the daily chart on GBPNZD we've recently created a new structure high. This makes my bias directed to the upward direction and therefore more incline to take long opportunities. As i went down on lower timeframes such as the 4H, i've identified a nice harmonic pattern (a Gartley formation) that's right near the completion point (brown line). Since the overall picture is toward the upper direction, i'm taking this trade directly at the D point, with stops below the low and targets as shown above.
If you have any question, please let me know.
Share your ideas if you want.
Otherwise, see you in the next chart!

Gartley pattern on GBPNZDHi guys,
on the daily chart on GBPNZD we've recently created a new structure high. This makes my bias directed to the upward direction and therefore more incline to take long opportunities. As i went down on lower timeframes such as the 4H, i've identified a nice harmonic pattern (a Gartley formation) that's right near the completion point (brown line). Since the overall picture is toward the upper direction, i'm taking this trade directly at the D point, with stops below the low and targets as shown above.
If you have any question, please let me know.
Share your ideas if you want.
Otherwise, see you in the next chart!

Bullish Gartley 4Htechnicals show market forming a bullish gartley on the 4H. D leg completion would form HL. BTFD.

Bearish BatThe pattern is at a strong resistance level and price may reverse to hit targets shown on the chart .

Bearish Max GartleyThe pattern is at a strong resistance level and price may reverse to hit profit targets shown on the chart .

EURUSD - Weekly Outlook 26/11/2017 I have been trying to get a better understanding of the waves in the market and seeing where other patterns come into play and can help give some confluence to the direction.
Although we have had a very bullish close last week, what the chart is presenting me with is a very Bearish opportunity.
Price has been consolidating in the channel and From what I can see I think there is some further down side to come before a further impulse in price up.
There have been a couple of Advanced patterns in the last couple of months on the Daily Timeframe / Weekly.
First a Bullish Bat which if you had 2 target approach you would of hit the 0.382 fib and pushed up at high as the 0.50 fib, at this point price moved back down giving us an equal measured moved.
Second pattern which has just completed is a Bearish Cypher, this along with price respecting the top of the channel & making a Higher Low I believe we are going lower.

bullish shark set upWe could go as far down as 146.50 before another bullish impulse as the 1.13 and 2.24 fibs line tighter than the 88.6 and 1.618 but overall market structure is still bullish. Pair has been consolidating since it established a new HH back in September but the completion of the shark pattern will give us an excellent R:R entry to the upside.

Bullish GartleyThe pattern is at a strong support zone and price may reverse to hit profit targets shown on the chart .

Bearish CypherThe D point may go higher but still within the potential reversal zone . Profit targets are on the chart .

Bearish Shark inside a channelThe pattern completed at the border of the channel and price may hit profit target shown on the chart .

Bullish Bat inside a channelThe pattern completed on the lower line of a price channel and price may reverse to hit profit targets shown on the chart .

Advances Butterfly @ 112.642Already completed, but still in good area for entry. Trader this with caution and pick your own stop in relation to previous support.
Risk reward is less than 1:1 for TP #1
I do like this butterfly as it also has RSI divergence,
Entry @ 112.642
Stop @ 111.624 ( please choose your own according to your own risk tolerance )
TP #1 113.294
TP #2 113.849

EURUSD Long/Bullish, Advanced Gartley Pattern @ 1.17738Advanced Gartley Pattern
Buying opportunity is close completion on a 15min time frame @ 1.17738
Good R/R Target 1:1
Stop @ 1.17556
TP #1 1.17921
TP #2 1.18035
