GBP.CHF - Short Opportunity @ MarketOn the GBP.CHF 1hr chart we have a potential short opportunity at the D leg completion of bearish Bat setup.
The price reversal zone on this pair is between 1.2832 & 1.2851
The PRZ zone is only a guideline of where we will be paying attention for trade setups and opportunity's.
Potential targets for the Bat setup placed at the .382% and .618% retracement of the C to D move.
There is also an opportunity to look for extended targets at around 1.2700
Stop loss would be placed above X leg structure resistance.
Target 1 - 1.2776
Target 2 - 1.2742
Advancedpatterns


AUD.JPY - Long Opportunity @ 83.153On the AUD.JPY 15min chart we have a potential long opportunity's at the D leg completion of bullish Bat setup.
The price reversal zone on this pair is between 83.153 & 83.048
The PRZ zone is only a guideline of where we will be paying attention for trade setups and opportunity's.
Potential targets for the Bat setup placed at the .382% and .618% retracement of the A to D move.
There is also an opportunity to look for extended targets at 84.000
Stop loss would be placed below X leg structure support .
Target 1 - 83.485
Target 2 - 83.687

GBP.USD - x2 Short OpportunitiesOn the GBP.USD 1hr chart we have 2 potential trade opportunity's at the D leg completion of bearish Bat & Cypher setup.
Bearish Cypher Setup ( White ) - D leg completion 1.2872
Target 1 - 1.2827
Target 2 - 1.2798
Bearish Bat Setup ( Blue ) - D leg completion 1.2883
Target 1 - 1.2835
Target 2 - 1.2804
Please trade this setup with caution.


EUR.NZD - Long Opportunity @ Market On the EUR.NZD 1hr chart we have a potential long opportunity's at the D leg completion of bullish Bat setup.
The price reversal zone on this pair is between 1.5222 & 1.5200
The PRZ zone is only a guideline of where we will be paying attention for trade setups and opportunity's.
Potential targets for the Bat setup placed at the .382% and .618% retracement of the A to D move.
There is also an opportunity to look for extended targets at 1.5350
Stop loss would be placed below X leg structure support.
Target 1 - 1.5278
Target 2 - 1.5313

EUR.USD - Short Opportunity @ 1.0757On the EUR.USD 1hr chart we have a potential short opportunity at the D leg completion of bearish Cypher setup.
The price reversal zone on this pair is between 1.0757 & 1.0777
The PRZ zone is only a guideline of where we will be paying attention for trade setups and opportunity's.
Potential targets for the Cypher setup placed at the .382% and .618% retracement of the C to D move.
There is also opportunity to look for extended targets at around 1.0695
Stop loss would be placed above X leg structure resistance.
Target 1 - 1.0728
Target 2 - 1.0710

Confirmed short opportunity in the EUR-CADHi Freedom-Traders,
in the daily chart of the EUR-CAD a completion of a bearish Cypher Pattern would offer us a nice swing trading opportunity.
Find possible levels for entry and exit in the chart.
Happy Trading!

AUDUSD potential bat pattern formationgood day everyone
we have on the radar a potential bat pattern into the process of formation
we are waiting for a lower low sign and then take the trade for short
happy hunting everyone .

Is it crazy to short pound? Let's check price action!Hey guys,
i know what you may think, probably after one day like this for the pound you wouldn't even consider a shorting possibility. However, patterns are always repeating, and our job, as techincal trader, is to find those patterns and keep trading them.
So here on the daily timeframe on the GBPCHF you can see that the today's rally has brought price up to the completion point of the Gartley pattern and the AB=CD pattern.
This level also lines up with a psychological number, and most likely after today's close we'll be in overbought condition.
All the usual clues are there, the only part missing is a price action signal, that this time should be very strong; be careful when trading against the actual trend.
I'm going to pay attion to 4hr and 1hr charts to find trading opportunities within as long as price is in the blue box.
I'll keep you updated.
If you want to share your view, or simply ask questions, feel free to comment below.
Otherwise, see you in the next chart!

EUR.NZD - Short Opportunity @ 1.5399On the EUR.NZD 4hr chart we have a potential short opportunity at the D leg completion of bearish Cypher setup.
The price reversal zone on this pair is between 1.5399 & 1.5483
The PRZ zone is only a guideline of where we will be paying attention for trade setups and opportunity's.
Potential targets for the Cypher setup placed at the .382% and .618% retracement of the C to D move.
There is also opportunity to look for extended targets at around 1.5100
Stop loss would be placed above X leg structure resistance .
Target 1 - 1.5284
Target 2 - 1.5211

Intraday Pattern on AUDJPYHey guys,
i don't usually trade in these lower timeframe, but this time i think it could be a nice level to short. The blue line represents a previous level of structure, and price has created new lows breaking through that level. So i'm thinking it could turn into resistance and hold the price's rally.
Stops above X, targets as usual for harmonic patterns.
If you have any questions, feel free to comment below.
Otherwise, see you in the next chart!
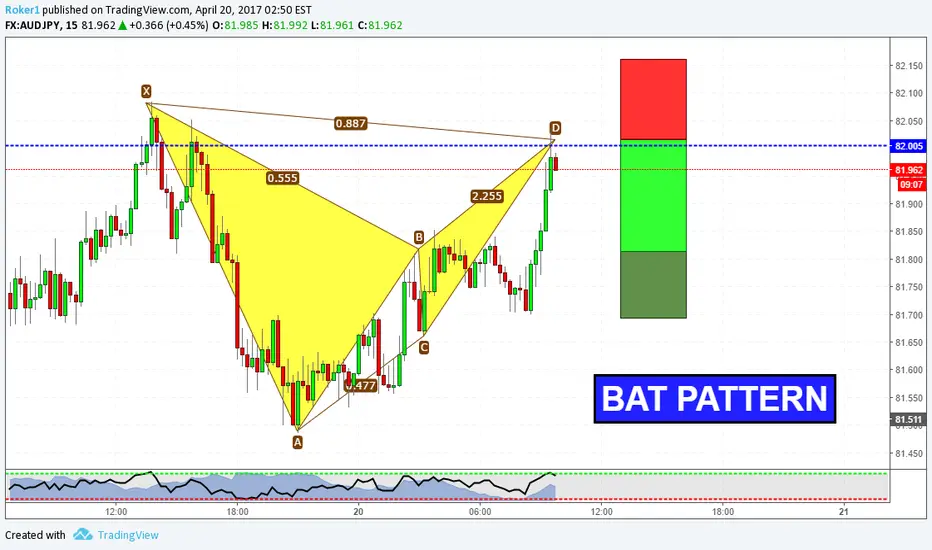
Intraday Bat Pattern on AUDJPYHey guys,
i don't usually trade in these lower timeframe, but this time i think it could be a nice level to short. The blue line represents a previous level of structure, and price has created new lows breaking through that level. So i'm thinking it could turn into resistance and hold the price's rally.
Stops above X, targets as usual for harmonic patterns.
If you have any questions, feel free to comment below.
Otherwise, see you in the next chart!

possible bat pattern on USDJPYgood day everyone
i got on the radar possible formation for the USDJPY
as per the showing results .
we shall wait and see

Bat pattern on USDCADHi guys,
this is an advanced pattern formation called Bat, its completion point comes around 1,3430s. Stops above X, targets at the 382 and 618 retracement of AD leg.
If you have questions or if you want to share your view, feel free to comment below.
Otherwise, see you in the next chart!
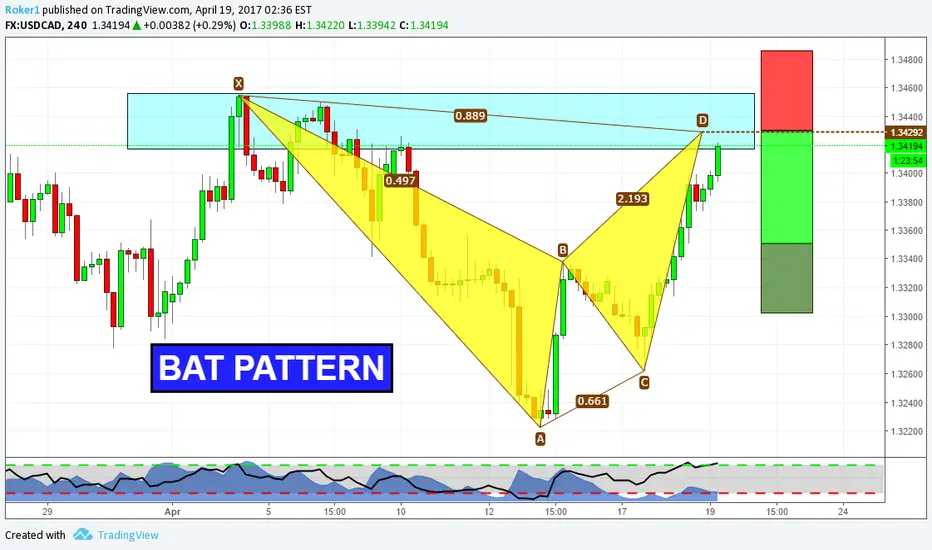
Bat on USDCADHi guys,
this is an advanced pattern formation called Bat, its completion point comes around 1,3430s. Stops above X, targets at the 382 and 618 retracement of AD leg.
If you have questions or if you want to share your view, feel free to comment below.
Otherwise, see you in the next chart!

Short Gartley with Trend DirectionHi traders, We have a potential Gartley pattern forming on the USDJPY. It is in the bigger trend direction, thus you can aim for bigger profit targets if it completes without invalidating. My stop losses are placed above X with ATR based amount.
I would appreciate your opinion and comments. thank you
Sam

AUDUSD 2618 / Bearish Bat We have had a 2618 happen which was my initial reason for entry. this also tied with a possible completion of a abcd pattern at previous highs which gives us the 1.618 fib extension at a monthly key level.
When I was looking at the Daily time frame we have had our impulse leg down, 50% fib and also a strong 618 retracement from the recent push upwards. All of this again gives further confluence with the 886 level right at the previous daily highs and Key level

EURAUD: Deep Bearish Gartley Formation Had some down time so I decided to post! Deep Bearish Gartley Formation on the EURAUD

GBP-USD short opportunityHi Freedom-Traders,
in the daily chart of the GBP-USD a completion of a bearish bat pattern would offer us a nice high probability trading chance.
Find possible levels for entry and exit in the chart.
Happy Trading!

EUR.AUD - Short Opportunity @ 1.4268On the EUR.AUD 4hr chart we have a potential short opportunity at the D leg completion of bearish Bat setup.
The price reversal zone on this pair is between 1.4268 & 1.4310
The PRZ zone is only a guideline of where we will be paying attention for trade setups and opportunity's.
Potential targets for the Bat setup placed at the .382% and .618% retracement of the C to D move.
There is also an opportunity to look for extended targets at around 1.4000
Stop loss would be placed above X leg structure resistance.
Target 1 - 1.4158
Target 2 - 1.4089


Bat pattern ready to complete!Hi guys, on the daily chart on GBPCAD you can see price is bouncing back and forth between two levels of structure. In consolidation periods like this it's quite frequent to see harmonic patterns unfolding. I think this could be a nice trade.
Stops above X, targets as usuale for patterns.
If you have questions, or simply share your view, you're welcome in the comment section below.
Otherwise, see you in the next chart!
