BABA.Medium-term analysisOn the weekly timeframe we have a sideways market. The current buyer vector is 5-6.
Advancedvsa

BABA. The buyer shows strengthHello traders and investors!
Let's take a look at what happened since the last post where I suggested considering purchases. You can find the post linked below. Just a reminder, the solid line represents the main scenario, while the dashed line indicates possible price movements to realize the main scenario.
The price has increased by 13%, with the maximum drawdown so far being 5%.
The situation is most clearly visible on the 2-day timeframe. I explained how and why to use different timeframes in a separate article, the link to which is provided below. On the 2-day timeframe, the price has formed a sideways movement where volume accumulation is taking place. Currently, we see 7 points within the sideways movement. The buyer's momentum from point 7 broke through the upper boundary of the sideways movement at 78.34.
If the buyer defends the breakout above the upper boundary of the sideways movement, I expect the first target to be 96.68. This is approximately 18% from the current price. This is the primary scenario.
If the seller absorbs the last buyer's candle and brings the price back into the sideways movement, there is a possibility of retesting the local minimum.
The ultimate target on the weekly timeframe remains the same - 121.3.

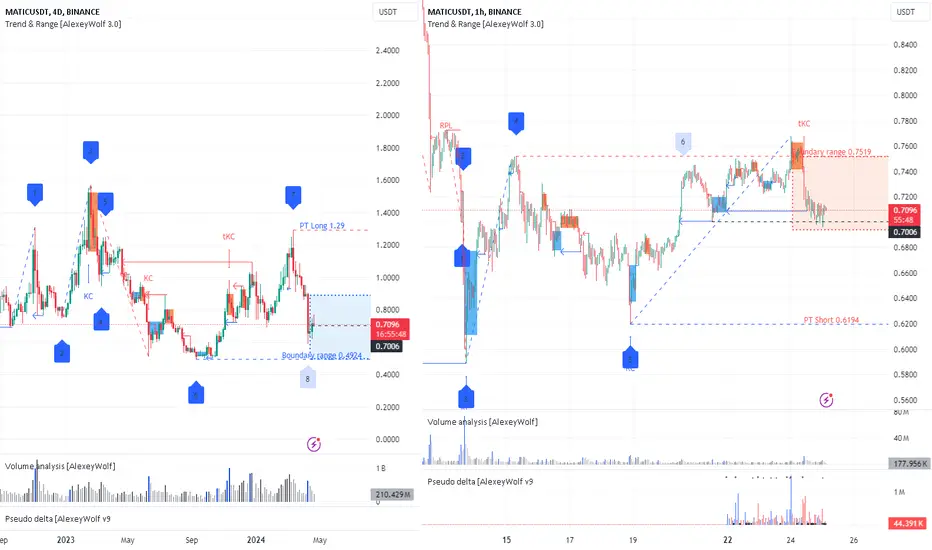
MATICUSDT. Trading opportunityA sideways range has formed on 4D TF. The seller's vector has reached the obligatory goal. The buyer has not yet shown strength. I will wait for buyer action to buy. The target could be 1.29.
A sideways range has formed on the hourly timeframe. Buyer vector 5-6 has been won back. The seller vector (6-7) is currently relevant.
If the seller breaks the 0.7006 level and defends it, then I believe the price could reach 0.6194. I think 0.6194 is a good price to buy.
How to use different timeframesHello traders and investors!
Today I'll talk about choosing the right timeframe and how you can use different timeframes when looking for trades. This will help us uncover what is hidden in this candle on the chart.
When we look at something, we are usually limited by a certain viewpoint. From this point, we only see part of the whole picture. But if we move and look from a different perspective, we will discover new details and aspects that were previously unnoticed. The same applies to analyzing the chart of a financial instrument when using different types of charts or different timeframes. This post will focus on using different timeframes. On one timeframe, it may be difficult to understand the essence of what is happening, while on another, everything can become clearer and more understandable.
I've already talked about using different timeframes when looking for trades in an educational article a few weeks ago (see the related post below). In that article, I highlighted 5 skills that help effectively trade in sideways markets. Discussing the first of them - how to combine higher and lower timeframes when looking for trades, I provided a practical example on the OPUSDT chart using the daily and hourly timeframes. In that practical example, I formulated target levels that are likely to be reached. You can see the results in the related post (see below).
I'll provide another example of choosing the right timeframe and the correlation between timeframes, using the BTCUSDT chart. This will help us uncover what is hidden in this candle on the chart.
In the update of this idea I noted that on the hourly timeframe at the contextual point of the seller (the beginning of the last seller impulse, level 66867), I didn't see an active seller and wasn't ready to join the sales at that moment. As a potential target, I indicated 62776.
So, I looked at the chart on different timeframes and searched for what remains unnoticed. On the 7-minute timeframe, I discovered a sideways movement at the contextual point of the seller (level 66867), as mentioned in the idea update with a recommendation to look for a trade after exiting the sideways movement and protecting this exit:
Now, let's analyze what happened next (on the bars chart, as bars take up less space and additional marks are better visible).
The seller broke through the lower boundary of the sideways movement at 65626.87.
The seller's impulse ended at 10:49 (New York time), when after breaking through the lower boundary of the sideways movement, the first buyer bar appeared.
The key candle(bar) of the impulse (the largest volume in the impulse) is marked on the chart as "KC". Therefore, the seller's defense of this candle or the lower boundary of the sideways movement (65626) increases the probability of further price decrease. The price range of the key candle of the impulse is highlighted on the chart (from high to close). Now let's pick a lower timeframe to see more clearly what happened before and after 10:49.
On the 1-minute timeframe by 10:49, a sideways movement formed, and at 10:49, the price attacked the upper boundary of the sideways movement (level at point 2).
The key candle of the buyer's impulse ("KC" on the chart) is in the middle of the impulse. At 10:59, the buyer attacked a new boundary of the sideways movement (level at point 6 - 65249.01). Pay attention to the volume of the attacking candle. At 11:02, the seller pressed the attack candle, forming a seller zone (red background on the chart). On the buyer's candle at 11:04 (black downward arrow on the chart), you can sell because:
On the hourly timeframe, the price is in the seller's impulse in the seller's area of interest, which defended the level 66867.
On the 7-minute timeframe, the seller broke through the lower boundary of the sideways movement.
On the 1-minute timeframe, the seller defended the level (65249.01) from the buyer's attack on a significant volume, which is within the price range of the key candle of the 7-minute timeframe impulse.
And one more interesting point. Look where the seller's resumption on the minute timeframe came from - from the 50% of the key candle of the 7-minute timeframe seller impulse.
Could the price, without reaching the target of 62776, go up? Yes, the probability of this event is not zero. And we see how the price did not reach the target by 18 dollars (black upward arrow on the chart) and turned upward. Where did the seller stop it? It stopped right there inside the key candle of the sideways movement exit on the 7-minute timeframe (black downward arrow on the chart). After that, the target of 62776 was reached.

BTCUSDT. No context for salesHello traders and investors!
I've seen several ideas for selling based on different patterns, but I'm not seeing the context for selling just yet.
On the daily timeframe, we still have a sideways range. The seller's vector 9-10 has hit the obligatory target, but it hasn't reached the lower boundary of the range at 59005. This lower boundary represents a buyer's area. Selling would be advisable below this boundary if it's defended by the seller.
On the hourly timeframe, we also still have a sideways range. The seller's vector 5-6 closed below the lower boundary at 64493. However, the buyer brought the price back into the range and absorbed the key bar of the seller's vector (with the highest volume). The key bar on the chart is marked as "KC."
Again, the lower boundary is a buyer's area. Selling would be advisable below this boundary if it's defended by the seller.
There are threats to buying at 67929 (the high of the last seller's bar on the daily timeframe). Under certain conditions, I'll be looking for buys with targets at 69000 and 71305.

ETHUSDT. Medium-term and short-term analysisHello investors and traders!
On the weekly timeframe, we have a sideways movement. The current vector is for buyers 8-9. The first target, 3580.34, has been reached by the buyer. The next target (if the buyer surpasses 3580) is 4372. If the weekly bar closes below 3056.56, the likelihood of further price decline will increase. Considering an investment deal would be advisable if the price falls below 2800.
On the daily timeframe, we observe a sideways movement, and yesterday the seller played out their vector 7-8 and closed the bar below the boundary of the sideways range, at 3056.56. I am monitoring the actions of the buyer. If they bring the price back into the sideways range (above 3056.56), I will assess their strength and possibly consider buying.

USDJPY. Medium-term analysisOn the weekly timeframe, we have a sideways market. The current short-term trend vector is 5-6

ETHUSDT. Are waiting for a buyerOn the daily timeframe we have a sideways market. The bearish vector 5-6 has been played out. After the price interacts with the level of 3200 and the buyer’s strength shows, we can consider long positions with a target of 3722.

ORDIUSDT. The seller has reached targets The seller has reached their targets from the previous review - 55.2 and 49.
On the daily timeframe, there is a sideways market, and the seller's vector 7-8 has hit all targets. The price touched the lower boundary of the sideways market at 40.685 and showed a bullish reaction. I am observing the actions of the buyer. There is a threat for purchases - the seller's zone with a lower boundary at 51.532 (red background).
On the hourly timeframe, there is a downtrend. The beginning of the last seller's impulse is at 54.68. Notice how the buyer cannot overcome 50% of the seller's last impulse (46.84).
I will be looking for a selling opportunity from the seller's zone on the daily timeframe.
Pay attention to the 5-minute timeframe. There is a sideways market. If the buyer attacks point 4 of the sideways market (49.88) and enters the zone of 51.532 (while on the hourly timeframe, the buyer does not absorb the last seller's bearish bar), and then the seller defends 49.88, we can look for sales to play against the opposite boundary of the 5-timeframe sideways market and possibly update the local minimum.

AVAXUSDT. Looking for salesHello traders and investors!
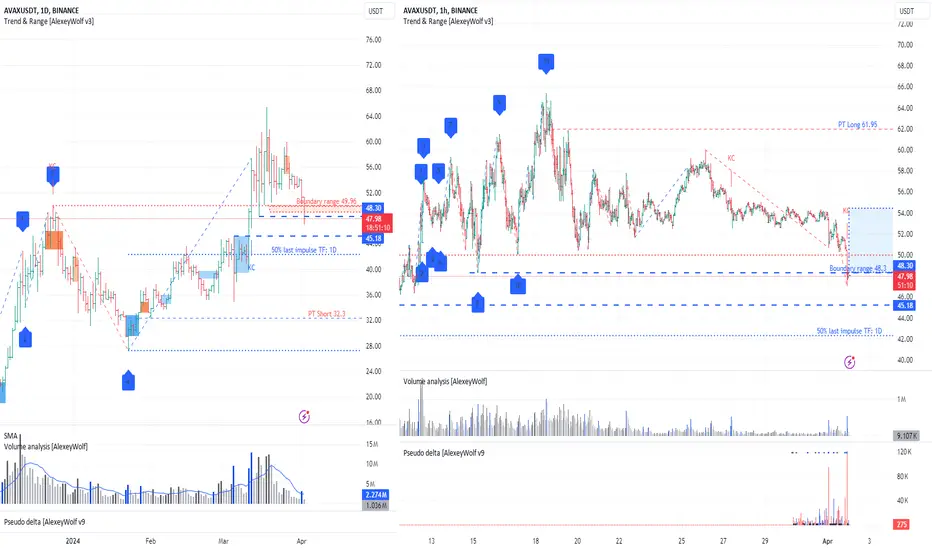
On the daily timeframe, we observe a sideways trend. The buyer's vector 4-5 has played out. The price is at the upper boundary of the sideways trend, and we can consider looking for sales as an idea to implement the seller's vector 5-6 with the first target at 40.07 (then 34.83, 32.3). After the previous review, we notice a strong resumption of the seller from the upper boundary of the sideways trend at 49.96. I anticipate that the price will test the local minimum of 44.97.
On the daily timeframe, we also see a sideways trend. The current seller's vector is 8-9 with the first target at 45.17.
It's preferable to look for sales from the upper boundary of the sideways trend on the hourly timeframe, ideally from the seller's protection level at 48.17. Alternatively, look for sales below the level of 44.97 in the absence of buyers there.

ORDIUSDT. Looking for salesOn the daily timeframe, there is sideways movement. The bearish vector 7-8 is relevant.
On the hourly timeframe, there is sideways movement. The bearish vector 11-12 is relevant.
I believe that we will see a bearish movement.
Sales should be looked for in the red zones - seller zones (blue zones - buyer zones).
Targets on the hourly timeframe - 61, 60.
Targets on the daily timeframe - 55.2, 49.

OPUSDT. The seller has reached their goalsIn educational article some week ago, I wrote that most financial instruments spend more than 75% of their time in this sideways market mode. So, knowing how to trade in sideways markets is a important skill for traders and investors.
I highlighted 5 skills that help effectively trade in sideways markets. Discussing the first of them - how to combine the higher and lower timeframes when looking for trades, I provided a practical example on the OPUSDT chart using the daily and hourly timeframes. Quote:
On the daily TF, we observe sideways movement since December 22, 2023, with the bearish vector (11-12) being relevant. The first target of the bearish vector, 3.119, was reached on March 19, 2024. The second target (2.822) and the third (2.611) remain valid
The seller has reached their goals.
Currently, the price is below the lower boundary (2.611) of the sideways trend on the daily timeframe. We haven't seen any buyers yet - there's no bullish candle.
It is advisable to look for buying opportunities when the buyer brings the price back into the sideways trend. Sales can be sought from the defense of the seller at the level of 2.611.

EURUSD. Medium-term analysisOn the weekly timeframe, we have a sideways market. The current short-term trend vector is 5-6

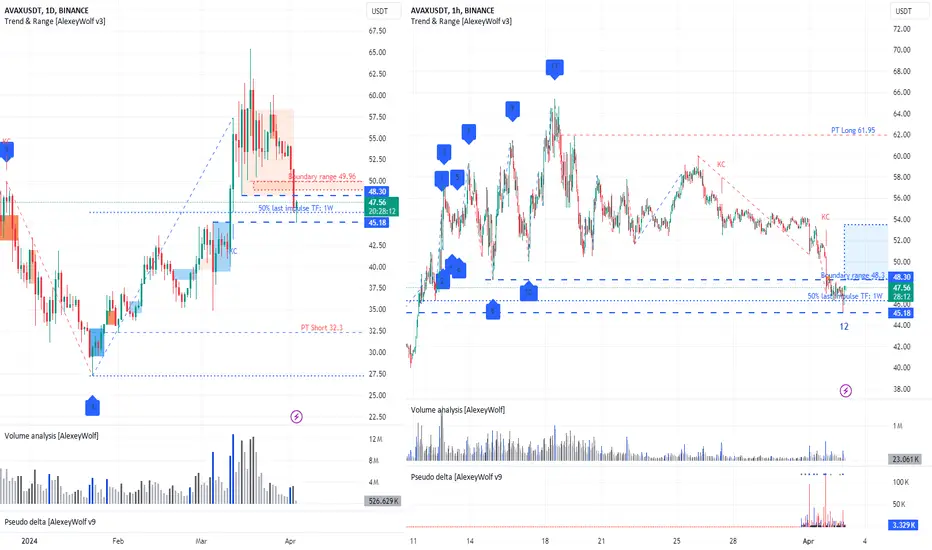
AVAUSDT. We have context for both selling and buying. It's an interesting situation. We have context for both selling and buying.
On the daily timeframe, there's a sideways movement (upper boundary - 49.96). The price has now returned to it, but the daily candle has not yet closed. If the daily candle closes inside the sideways movement, then we can look for sales, and the bearish vector 5-6 with a target at 32.3 will be relevant. There are two threats for the bears along the way in the form of buyer zones (blue background). The first one is at 48.3, which is currently being interacted with. The second threat is the buyer zone with the upper boundary at 45.18.
On the hourly timeframe, the price is at the lower boundary of the sideways movement (48.3). The bearish vector 11-12 has played out. The launch of the bullish vector 12-13 with a target at 61.95 is possible.
In summary, the daily and hourly buyer levels coincide (48.3). If the buyer shows itself at this level, then we can consider buying, taking into account the seller zones on the daily chart (red background). If the seller defends the breakout of the level 48.3, then we can consider selling, taking into account the daily buyer zone (upper boundary 45.18), inside which, by the way, lies 50% of the last daily buyer impulse.
For a more detailed explanation of how to read charts and consider different timeframes when looking for trades, you can refer to the article
AVAXUSDT. On the Daily timeframe, selling takes precedenceOn the daily timeframe, we see a sideways movement with the upper boundary at 49.96. The price has been above the upper boundary for the last 20 days, but yesterday it returned to it and stopped at the 50% level of the last buyer's impulse on the weekly timeframe. This is clearly visible on the hourly timeframe:
At the top, a seller's zone has formed with the upper boundary at 48.3 (red background), and at the bottom, a buyer's zone with the upper boundary at 45.18 (blue background). I anticipate price interaction with the seller's zone of interest. If the seller defends the range of 48-50, we can consider the possibility of sales, and the bearish vector 5-6 will become relevant with a target at 32.3. However, on the way to this target, sellers may be hindered by the buyer's zone, with which there was just interaction and a bullish reaction began, as clearly seen on the hourly timeframe.
On the hourly timeframe, the price is below the lower boundary of the sideways movement at the level of 48.3. The bearish vector 11-12 has already played out, and we can expect the launch of the bullish vector 12-13 with an ambitious target at the level of 61.95 (ambitious, because the buyer will have to overcome the seller's zone on the daily timeframe). To launch the bullish vector, the buyer needs to raise the price above the range of 48-50 and protect it.
For a more detailed explanation of how to read charts and consider different timeframes when looking for trades, you can refer to the article
BTCUSDT. Monitoring the seller's actions.Hello traders and investors!
It's time to update the forecast. During the last review (23/03/2024), we observed a short vector 7-8 within the sideways movement on the daily timeframe. The target of the long vector 8-9 was 72419 (see the chart from the previous review). Currently, the long vector 8-9 has reached this target.
It is advisable to look for sales at the upper boundary of the sideways movement. However, for short positions, the first threat is the buyer zone (blue color) with the upper boundary at 69674, which formed on the daily timeframe. And the seller has not yet shown itself on the hourly timeframe - the price at 17 hours is near the level of 72419.
There is a high probability that the buyer will reach the upper boundary of the sideways movement at 73777. I am waiting for a reinteraction of the price with the level of 72419.
For a more detailed explanation of how to read charts and consider different timeframes when looking for trades, you can refer to the article

BTCUSDT. Short term analysisHello traders and investors!
On the daily timeframe we see a resumption of buyers from the buyer's zone (blue background) with an upper boundary of 69674.
On the hourly timeframe, a sideways trend has formed, where the buyer's vector 4-5 has already reached the obligatory target. Searching for sales is risky because there is a resumption from the buyer's zone on the daily timeframe. It is not systematic to look for purchases at the upper boundary of the sideways.
It is better to look for purchases at the lower boundary of the sideways trend, for example, from the buyer's protection levels at 69071, 67518.
Sales are advisable to look for below the level of 67518 as an idea for implementing the seller's vector 9-10 of the sideways trend on the daily timeframe with the first target at 64493 (second - 60775).
As before, I am waiting for a repeated interaction of the price with the level of 72419.
By the way, purchases could be found yesterday on the 30-minute timeframe (see the chart).

ETHUSDT. Looking for purchasesOn the daily timeframe we have a sideways market. The bearish vector 5-6 has been played out. The price has already interacted with the level of 3200. Priority is given to considering purchases, preferably from the zone between 3200 and 3400, with the initial target at 3722.

ETHUSDT. Monitoring the seller's actions.Hello traders and investors!
It's time to update the forecast. During the last review (22.03.2024), we observed a short vector 5-6 in the sideways trend on the daily timeframe. The target of the long vector 6-7 was 3722 (see the chart from the last review). Currently, the long vector 6-7 has reached this target. At the top, there is a seller's zone with a lower boundary of 3722 (red background). So far, we haven't seen any reaction from the seller in this zone.
It is advisable to look for sales at the upper boundary of the sideways trend. However, for short positions, the first threat is the buyer's zone (blue color) with an upper boundary of 3505, which formed on the daily timeframe. There is a high probability that the buyer will reach the level of 3822.
On the hourly timeframe, a sideways trend has formed with boundaries of 3727 and 3665. I am waiting for the price to interact with these boundaries. We can look for a trade opportunity based on the protection of these boundaries.
For a more detailed explanation of how to read charts and consider different timeframes when looking for trades, you can refer to the article

Trade in a sideways marketMain price pattern of financial instruments
So, when we talk about the price of financial stuff, like stocks or crypto, it often moves in specific ranges over different timeframes, right? Whether it's weekly, daily, hourly, or even minute charts, prices tend to hang out in these ranges for a while. Traders call this kind of price movement "consolidation," "range-bound," or simply a "sideways market."
In this article, we'll just call it a sideways market or range. When prices are stuck in this sideways action, they can break out with a sudden burst of momentum, kickstarting a trend, or they might just keep bouncing around, forming a new sideways pattern.
Let's check out the daily chart of BTCUSDT starting from October 2021. On the chart (see above), we've marked those periods where the price was moving sideways with blue markers. Since October 2021, we've spotted 7 of these sideways patterns. We label the first point of each sideways move as "1". Out of 884 trading days, the price was stuck in this sideways action for 758 days (884 - 72 - 39 - 15), which makes up about 85%. This means that throughout this whole period, you could've been looking at trades from one edge of the sideways range to the other.
Based on my estimates, most financial instruments spend more than 75% of their time in this sideways market mode.
So, knowing how to trade in sideways markets is a super important skill for traders. And for investors, understanding these sideways moves can really amp up the profitability of their investments by pinpointing better entry and exit points.
For example, right now, considering buying BABA stocks might be a good idea because the price is chilling at the bottom of a sideways range on the weekly chart.
Example1
Mastering the Skills for Successful Trading in Sideways Market
Being able to effectively trade within trading ranges, between their boundaries, requires not only a certain amount of knowledge but also the development of specific skills. Initially, one must grasp the theoretical foundations and then apply them in practice, gradually honing their skills. Let's look at the necessary skills:
Skill 1: Understanding and applying the Concept of Time Frame (TF) Interconnection: higher TF, lower TF. Grasping the context of the higher TF in relation to the sideways market TF.
Skill 2: Identifying sideways market: determining the absolute and current boundaries of the range, as well as the current direction (vector) of price movement.
Skill 3: Recognizing zones of interest for buyers and sellers.
Skill 4: Determining the presence of buyers at the lower boundary (bottom protection by buyers) and sellers at the upper boundary (top protection by sellers).
Skill 5: Adhering to risk management principles when entering trades (especially crucial for traders).
Each of these skills is based on a vast amount of knowledge that needs to be absorbed first and then applied in practice. The journey can be long and sometimes tedious. Is there a way to hack this system and shorten the time it takes to acquire knowledge, develop skills, and start trading? Well, there are options. For example, you can use technical indicators (such as RSI, Bollinger Bands, ATR, etc.) to make buying or selling decisions. Or you could completely bypass the process of acquiring knowledge and skills and rely on signals from Telegram channels or expert opinions. But what will you find there about trading in sideways market (ranges), where the market spends more than 75% of its time?
This series of articles is written for those who are ready to take control of their financial destiny, who strive to understand how financial markets work, and who want to master the skills of independent trading and making more informed investment decisions. Here you will find the knowledge and tools to start understanding what is happening in the financial markets and how to profit from it. I don't promise any magic pills or "money" buttons:).
So, let's get started.
Skill 1: Applying the Concept of Time Frame Interconnection
The higher time frame (TF) always takes precedence over the lower one. For instance, if we observe on the daily chart that the market is in a seller's zone (which is determined by Skill 3), then on the hourly chart, we need to analyze the seller's actions (Skill 4) and primarily look for selling opportunities. However, there might be a situation where the seller is inactive, and the price starts to rise due to buyer pressure (in this case, Skill 4 comes into play again).
Example2
On the provided chart, areas of seller interest are marked in red, while buyer interest areas are marked in blue. Let's examine the period from March 25th to March 27th, highlighted in yellow on the chart.
On the daily TF, we observe sideways movement since December 22, 2023, with the bearish vector (11-12) being relevant. The first target of the bearish vector, 3.119, was reached on March 19, 2024. The second target (2.822) and the third (2.611) remain valid. On March 25th, the price returned to the seller's zone on the daily chart (the red zone with the lower boundary at 3.680).
On the hourly chart, on March 25th, the price trend reached the daily seller's zone and formed a range with 7 points. The breakout from this range occurred downwards on March 27th. Therefore, in this range, it was advisable to look for selling opportunities from the upper boundary and riskily consider buying from the lower one.
Similarly, you can make investment decisions by analyzing, for example, the weekly and daily TFs.
To be continued...
P.S. This is indeed an interesting point! Despite the fact that the market spends more than 75% of its time in sideways movement, indicators and strategies specifically designed for trading in this mode have not gained as much popularity as other trading approaches. Even on the internet, including TV and trading Telegram channels, signals or analyses based on identifying sideways movement are very rarely encountered. If you have experience or knowledge about trading methods in sideways markets (including indicators), please share them in the comments!

KMB.Medium-term analysisOn the weekly timeframe we have a sideways market. The current buyer vector is 16-17.

BTCUSDT. Correction or range?On the daily timeframe the market is consolidating sideways. A short vector of 7-8 is observed. It is not advisable to seek sales at the bottom of the range. It is advisable to look for purchases after the price interacts with the zone of 59000-61500 and a buyer emerges (result, spread, volume).

SOLUSDT. Intraday tradeIf the price returns to 197.95 now and if the seller defends this level, then we can look for a short with a target of 178.55."
