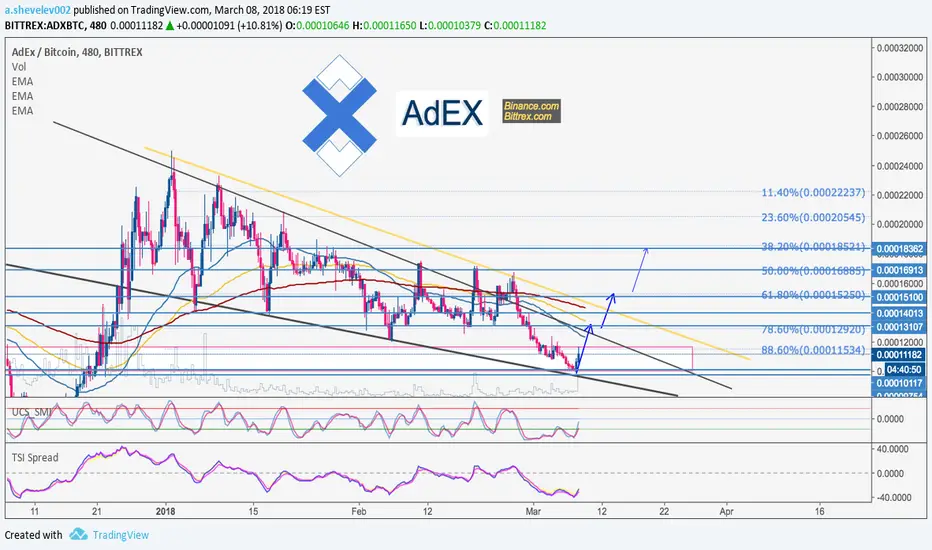
ADXBTC in two timeframes trend confirmedYesterday we gave the signal on ADX, and now the trend is confirmed, we earned a little profit already, and expect to have far more in the short term. Trend analysis and technical indicators are positive. There is a BB contraction which may lead to impulse growth according to the retrospective analysis and overall trend, however Ichi cloud is flat and the price may follow sideways trend for a while.
ADX

ADX is getting ready for rally, check it outHello Friends,
Our last call on ADX was spot on. You can call it as "I nailed it"
I have mentioned that ADX would reach 8000 SATs and bounce back considering the volume studies, Yes. ADX touched 8000 SATs and now it is trading at 9500 SATs (~20%.)
Now, the price is forming a CUP formation, interesting setup and Price is within the triangle formation. So my trade would be
Buy now (9300-9400 SATs) and Target: 16000 SATs, (70%), Sl : Below : 8000 SATs (20%)
Note: Resistance levels are marked as dotted lines, in which I would sell and Buyback at the lower levels.
And Note: My current trade is range bound, Lower side of the triangle to Upper side of the Triangle. Once it breaks the Triangle, the targets would change and it is going to be massive returns.

Good Morning - have a cup of crypto - ADXBTC possible cup&handleGood morning my friends,
buy this pumping awesome looking coin and it would give you enough money for your daily caffeine punch.
Cup & handle?
Buy in:
9000 sats
Sell:
9900 sats
10800 sats
11700 sats
...
...
..
.
Market penetrade... incoming.


Reversal? Low Volume & Downtrend BUT ADX rising(-DI above +DI)..I would feel more confident if the ADX (black line) is above 20 but in a falling state. In this case it looks as if it increasing...
My interpretation of Volume and Price:
Volume Share Price Interpretation
Decline Uptrend Bearish
Decline Downtrend Bullish
Increase Uptrend Bullish
Increase Downtred Bearish
What are your thoughts on GLBS ? How do you translate volume and price increase/decrease?
If you have recommendations or tips - please, let me know below at the comment section.
/Pat


BTCUSD Bear NarrativeMuh narrative says that the failure of DMI's to cross on 4h reinforces dominance of the bear trend. MACD crosses imply further downward momentum is imminent, supported by rising ADX on -DMI dominance on lower time frames. Also looks like a fractal of the move down to 6k.
May God save us all.


Adex on weeklySimple chart does not means it is wrong. Expecting huge movements in folowing month. The chart alligns with the Adex development progress ( beta prototype was realeased). I'm holding and expecting as high as x50 returns in a year(same max supply as Neo with price at 140$ and adex at 1.4$ so the potential is there). Fingers crossed...

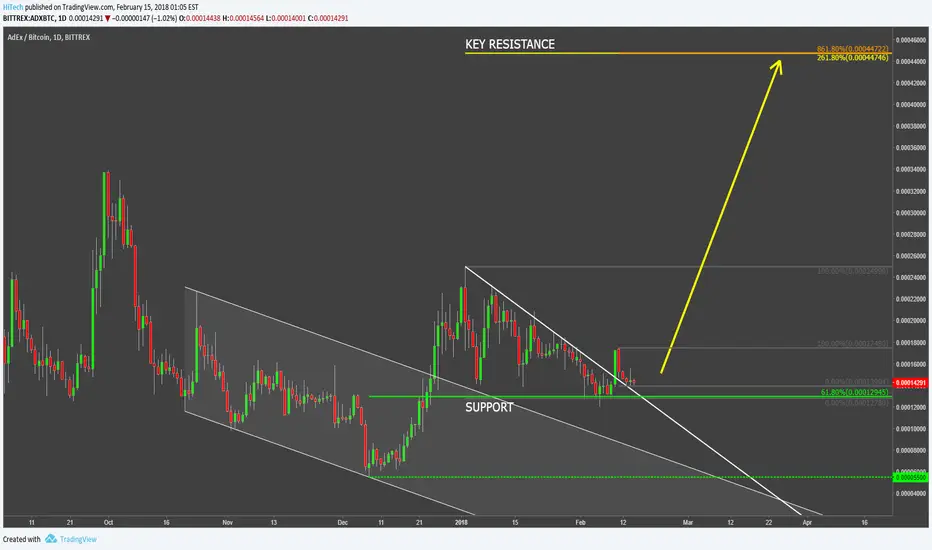
Adex VS Bitcoin 200% Growth PotentialThe downtrend of the Adex has ended at 5500 satoshi where it found the bottom and then went up breaking above the descending channel and hitting the 25k satoshi high. The corrective wave followed resulting in a rejection of the 61.8% Fibonacci retracement level, after which the downtrend trendline was penetrated, suggesting the beginning of an uptrend.
Fibonacci applied to the corrective waves down after the descending channel and the downtrend trendline breakouts show the strong resistance at 44k satoshi, that is over 200% potential gain from the current price. Although the timing and the price seem to be right, the consolidation could also take place.
On a downside, daily break and close below the 12k sathoshi could invalidate bullish outlook.
ADX/BTC Time Frame 1 Hour on Binance Exchange.BUY:
13622 - 13904 Satoshi
SELL:
14474 - 14934 - 15394 - 15964 Satoshi
STOP-LOSS:
12984 Satoshi
Join on my Telegram Channel @kripto_koin (t.me) for more Technical Analysis , Coin Events and Information about Big Pumping coin on Binance and Cryptopia Exchange.


Current SituationLooks bearish to me. Bitcoin broke the important $9500 support last hour. Next support is $9000. ADX is increasing in number, to be more specific, it crossed 50, which indicates a very strong trend. VWMACD is also gaining bearish momentum.


Where to now?10K support has broken. ADX is starting up again and it looks like DI- is still in control. The resistance from Feb 3. will likely act as support now. If this support falls, we may see falls to 8500.


Looking BearishVWMACD is gaining momentum, both short term and long term. Also, ADX is increasing, whilst having DI- higher than DI+, meaning that a bearish trend is forming. In addition, SuperTrend's descending supertrend is beginning to fall. Considering the last few Heikin-Ashi candlesticks have been red, I think it looks bearish.

Possible Bear TrendSuperTrend's ascending line has collided with the candle this hour. DI- trumps DI+, and the ADX is poised to begin a new trend. "Long-term" VWMACD is still green, but is rapidly approaching the negative. In addition, there has a very large amount of volume in the past 3 hours. Also, the price dropped back into the price range of the descending channel (not shown, but is produced from the 20K and 17K tops). I could be wrong but I think I'm right.


ADX pointing a first eye at the moon again (100% profit potent.)Another one set for a potential upward break-out!
AdEx is trading on a strong support and has just formed a Heikin Ashi doji (those who follow me will know by now that I sometimes refer to this trading technique (e.g. Previous post on BlockMason resulting in a 100%+ trade in a matter of days).
The setting of this one is quite similar, although ADX is already trading under it’s longer term blue Fibonacci retracement (78,6). The daily graph shows us a triangle (or even a bull flag if you will). We have to break through it on strong volume to confirm upward momentum . Given that we have a doji right now, ànd a bullish cross in the MACD , makes me believe this one could be ready to provide us some nice returns as well in the upcoming days.
We also see very low volume for the time being, if there is a nice spike there soon, together with upward momentum, we will be in for a treat.
FYI – I also highlighted some previous dojis & spinning tops that preceded and indicated a trend reversal in the graph (see white rectangles that highlight them!).
We should break around 16000 sat to be in the clear (nice entry point).
Note that the horizontal lines are Fibonacci retracement levels; + the white horizontal is a separate support line.
Good luck

No Trend Movement ATM, Possibly Bearish ThoughTrends have died down as shown by a static SuperTrend, Near 0 VWMACD, and Below 25 ADX. However, It may be the beginning of a bear market, as SuperTrend has gone to the red and long-term VWMACD has flipped to the negative.
