Why I took a 2x Trade on $ETH to 1450When all your signals line up in a systematic quant world, you take the trade as the statistics tell you to on ETH/USD $ETH. We have a few beautiful bottom signals that confirmed last week, with FloFi X, and Flux both firing quick bottoms that sometimes will act as springs to the nearest resistance/liquidity level. Willing to lose 16% on this trade based on the past results, with a 60% upside. Onward and Upward!
ADX

ADX + FAST + SLOW WIN 70%This indicator is an indicator with a high win rate
This indicator is an indicator with a high win rate
Change the settings you want to trade coins
I am a bitget user and trying to monetize this metric

USDCAD: Potential Beaflag Forming Below The Moving AveragesThe ADX looks like it will soon be crossing below the 25 Line and Confirming the Downtrend as the USD/CAD Bearishly Consolidates below the Daily Moving Averages. My Targets will be the Square-Up between the 78.6% and 100% Retraces

NASDAQ 100 PREDICTION FOR 14-11-2022 Dear trader our prediction for today depend on the the chart analysis 1h , d , 15m
We find the price had moved up a lot without correction and now it make a consolidate for correction in important resistance the price try to break it many time but can't so if the price still not break this resistance then ,, we advice you to be ready to take short position until next support as you see in the chart
Also all the indicators give us same analysis
Be careful today the market not clear until now

BTC/USD Short apportunity 8-11-2022 > 15m > 3:1 win Dear Investor we found today short apportunity depend on 15m chart analysis as you see in the chart there's a clear bearish flag brackout
also the price it under all the ema 20 , 50 , 200 and depend on the adx indicator the sginal give us short apportunity
so our advice to enter short postion in (19547.8) with 3:1 profit ratio ,, stop lose 19815.4 take profit 18829.2

Bitcoin volume and momentum predict impulse buildingTLDR On Balance Volume 10 and 20 SMA Rossing bullish below the 100 SMA is mega bullish, the Stoch RSI above 80 confirms momentum is shifting. In the idea text ADX also looks hella bullish. Impulse to $41-50k very likely next couple of months before stall.
Introduction
I got my start trying to swing trade on 2018 on bitcoin. Before then I was pretty lucky at buying and holding, as many of us are, and tried to step up my game. I got wrecked pretty bad. I later complete miss the April Fools Day pump of 2019 and watch in doubt for months as Bitcoin rallies to a lower high in June 2019.
I spent a lot of time trying to see why I missed the uptrend and found the On Balance Volume with SMA indicators by mattzab and I learned its strengths and its weaknesses (it is kinda hard to look for bearish volume divergences on a asset that has flow like bitcoin does).
I renewed my understanding of the basics like zooming out to higher time frames and use of simple momentum indicators like the Stoch RSI or using common pairing of indicators, like the Parabolic SAR and the ADX.
All that to say a big move to the upside is very likely.
Main Chart
The similarities between the 2019 and current 2022 bottoms are very clear on this set of indicators and price action. Bitcoin is basing out and showing strength after some long tern topping structure. The 2018 low was proceeded by a yearlong descending triangle and the 2022 low was preceded by a double top that took over a year to play out.
Price and the Stochastic RSI
The blue circle shows that price where price has been slowly strengthening and the orange circle shows that the Stochastic RSI has breached above 80. When that happened in 2018 the indicator ran across the top for several periods before having a massive pump.
On Balance Volume with SMAs
While the Stoch RSI was climing the On Balance Volume was also strengthening and showing bullishness. Generali accumulating when the OBV is below the 100 SMA is a good idea. Even better, if you have trust in the project, when both the 10 and 20 OBV both get below the 100 SMA. That is a sign you are in a deep and painful bear market and you are buying what other people don't want.
Waiting to see the 10 and 20 cross bullishly under the 100 SMA means we have confirmation that volume as transition's to the bulls at least temporarily. It is possible for some double and triple crosses to appear. That means it is an even longer accumulation period which suggest an prolonged uptrend once the indicators and price fully turn bullish.
More cautuious traders can wait tull the OBV is above the 100 or when the 10 and 20 OBV also get above the 100 EM.A. This does not get them the best prices but does get them in the trade when volatility has picked up.
.
The Second Chart
Parabolic SAR and ADX
The ADX and Parabolic SAR are often combined into the same chart. I currently favor a weekly chart for the ADX and a monthly chart for the Parabolic SAR. This gives me the sensitivity I desire on the weekly timeframe but keeps me alert to where major stalls or reversals in a move could occur.
With the D+ and D- converging on one another a cross is very likely. It is very high probability when taking into consideration the main charts bullishness. A cross of the D+ and D- means a move to the monthly SAR is very likely. It also seems likely that price will have a stall in the red zone based off of previous support and resistance. I am going to use any potential stall to look at alts that are showing relative strength and rotate into them.
That massive pump broke the long term downtrend of resistance shown in black and then price pumped to the red zone. For our 2022 bottom we have not seen a return to the red zone in over six months. A stall here could mean several things. Price could run beneath or at the red zone sideways and strengthen or it could impulse above all time high and then spend time confirming the previous all time high as support deep into the red zone. It way to soon to be sure.
Linked Ideas and my operating assumptions
These have not changed for a couple of months. The "OG" coins that did not set higher highs during the last crypto bull will set higher highs. Most of the top runners of 2021 will still be in consolidation for this cycle but we may still see a stand out. Some new coins like Optimism will have their first bull markets and go crazy then have over 90% draw downs.

BTC USD long opportunity 29/10dear investor our anaysis today on 1 hour chart we found opportunity for long position if the price break the hirozantel line and break this important rsistance then it give us very clear confirmation for moving up , also this confiramtion depend on ou strategy ( RT MAAX ema cross strategy ) you see the strategy already guve us long postion opportunity depend on :the price moving up 200 ema and we find crossover between 20 , 50 ema and the price moving up all of htem ,,
and depend on adx indicator you see on the chart it give us a long signal ,,
so we hope our idea it clear and we hope all the best for our investor with profitable trade
thanks

very strong sginal for long postion EUR/USDwow depend on our deep analysis in news and indecators >> we found very good apportonatiy for long postion
as you see in the chart the price borke downtrend and moving up also today the price make backtest for the trend and keep moving up so in this condition the price confirm long moving
also you see in rsi indecator the price broke 50 line so this very good signal for long moving
and in adx indecator you see the price broke 20 ine and also ad+ and adx line moving up 20 line this very good signal for long moving
in the end we advice our investor to open long postion and take profit to ema 200 on daily time frame
this postion 1.5 reward ratio / see the postion on the chart

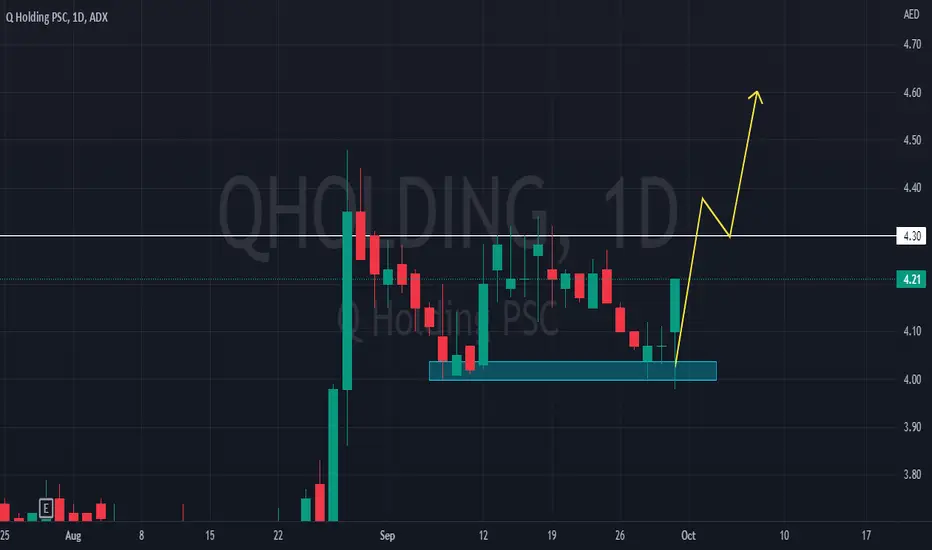
Ready to go up?Back to support zone, need some buying pressure but can be good if it opens with a small gap up. Quick entry and exit is recommended on this one.
Hit like & follow guy ;)

New ListingThis stock got listed without IPO people are ready to buy this one and more upside is expected. Ride this one!!
Hit like & follow ;)

My FAVORITE STOCKIt have become one of my favorite stock in ADX, I think from here it is ready to go here provided market sentiments are not negative tomorrow.
Hit like & follow guys :)
MGT- wick broke above 200 ema
- candle broke res and wick approached more res
- ADX at 27 with the pdi above ndi

Ready to go higher!!Over all market index is looking very promising and more upside is expected. Bulls are in the house!!!
!
Hit like & follow guys ;)

Get Set go GO!!!I think Invictus is now ready for the move, if market will be positive coming week this stock will outperform. Watch out for this one and enter at the right time before it goes away!!
Hit like & follow guys ;)


Retest 348?There are good chances if it survives at current level. Buyers will accumulate here and then push the price higher. Over all this stock is in a strong uptrend.
Hit like & follow guys;)

TSLA 7D chart UPDATE POST SPLIT / FED NEWSTSLA as shown on the weekly chart
has hit the top of a megaphone pattern ( increasing volatility)
where it printed a Doji candle to demarcate a reversal
while the relative strength topped out testing its Ichimoku Cloud
but failing.
The ADX has little magnitude ( distance from zero) nor rate
of change ( momentum) and is now pointing downward.
All in all, TSLA on the weekly chart is at a bearish inflection
in the context that TESLA has put out more news about impending
layoffs.

COGT a botechology stock with a great uptrend SHORTCOGY a biotechonology stock is doing what others
in the sector typically do in their performance when they
ignore general market dynamics and often hold up in recessions.
COGT has 4Xed since May earnings so ALPHA is high.
Right now the RSI is down trending so showing bearish divergence.
Additionally, the mass index went over the threshold and
then under the trigger suggesting an impending reversal.
The ADX indicator which has been as high as 100 for both up and down
trends is nearly zero. Although not shown on the chart, the mass
index indicator has triggered.
I conclude that COGT has ran up and extended too far and is now
set up for a short trade.


adx/usdtentry from this lvl or wait until retest down trend
target 20 % ( look at chart )
stop lost : 0.1873

ADX USDT* The purpose of my graphic drawings is purely educational.
* None of what i write here is not an investment advice. Please do your own research before investing in any asset.
* Never take my personal opinions as investment advice, you may lose your money

MAYApproaching key levels with Tl & res, bit of confluence. ADX at 30 with pdi above ndi is always helpful. Would like to see a close above the ema's

RNEabove emas recently broke the 200, ADX @ 38 with bullish PDI momentum - looking for breakout and use the 200
as support
