#ADX/USDT#ADX
The price is moving within a descending channel on the 1-hour frame, adhering well to it, and is heading for a strong breakout and retest.
We are seeing a bounce from the lower boundary of the descending channel, which is support at 0.0914.
We have a downtrend on the RSI indicator that is about to break and retest, supporting the upward trend.
We are looking for stability above the 100 moving average.
Entry price: 0.0935
First target: 0.0951
Second target: 0.0966
Third target: 0.0986
ADXUSDT

ADXUSDT 1D ADX ~ 1D Analysis
#ADX Buy after successfully penetrating this resistant line with a short -term target of at least 15%+.
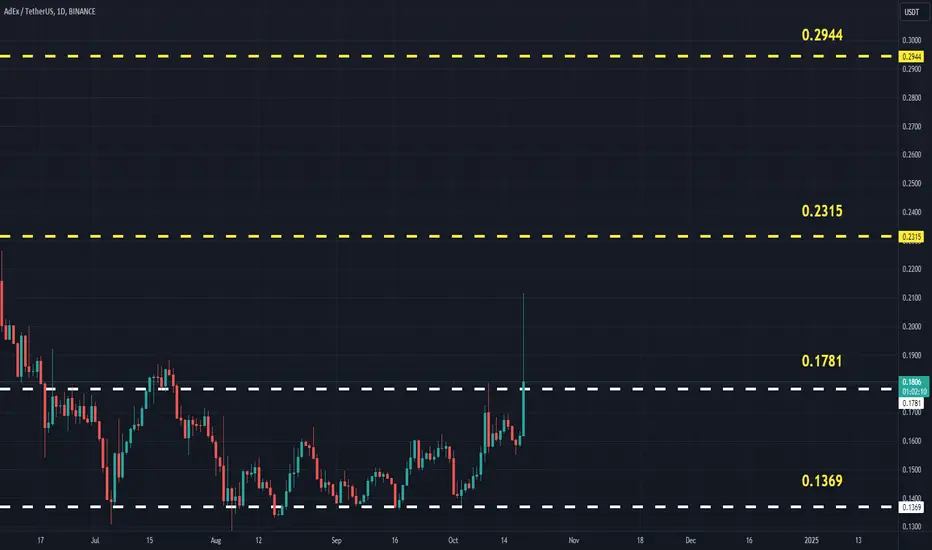
ADXUSDT (AdEx) Updated till 19-10-24ADXUSDT (AdEx) Daily timeframe range. many alts got similar pattern now. from a accumulation zone its trying to get out of its local low. but volume still not there if it can stay above 0.1781 than it got chances to continue.
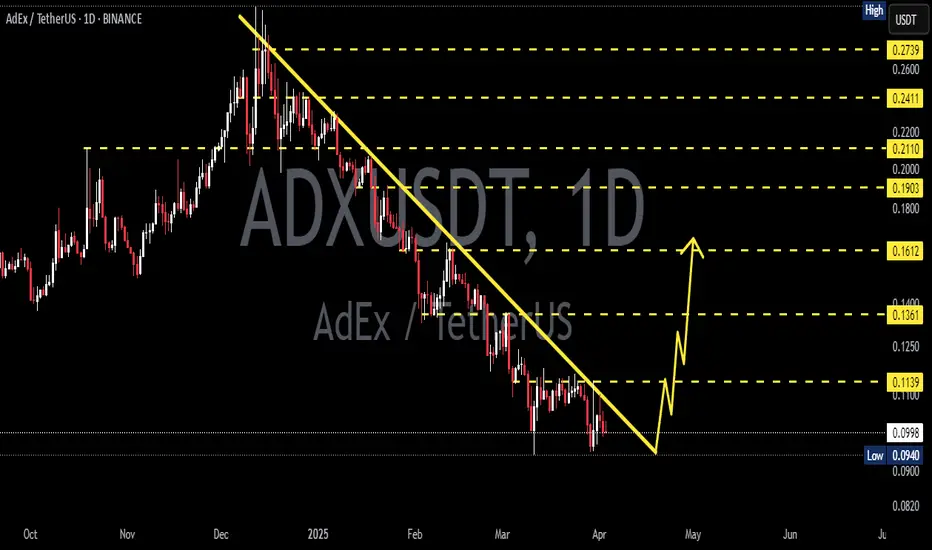
Finally Adx Testing Multi Year Trendlineseems like bottomed out and getting ready for massive recovery
in downtrend from last year now testing trend line in 3 days tf expecting breakout too
incase of successful breakout expecting solid recovery in coming weeks expecting 120 to 140% bullish rally incase of breakout

Ambire AdEx (ADX) formed a bullish Shark for upto 51% moveHi dear friends, hope you are well and welcome to the new trade setup of Ambire AdEx (ADX) with BTC pair.
On a 4-hr time frame, ADX has formed bullish Shark move for next price reversal.
Note: Above idea is for educational purpose only. It is advised to diversify and strictly follow the stop loss, and don't get stuck with trade

ADX BUY SETUPHi, dear traders. how are you ? Today we have a viewpoint to BUY/LONG the ADX symbol.
For risk management, please don't forget stop loss and capital management
When we reach the first target, save some profit and then change the stop to entry
Comment if you have any questions
Thank You

$ADX/#USDT [#Ambire AdEx]: Resistance_Breakout_ConfirmationWe've detected a Resistance Breakout and Confirmation on the $ADX / $USDT chart. The price has broken above a key resistance level and has been confirmed by a strong candle, indicating a potential bullish trend. The next resistance key levels are at 0.1922 | 0.2103 | 0.2405 and the major support zones are respectively at 0.162 | 0.1499 | 0.1197. We may consider entering a trade at the current price zone at 0.1736 and targetting higher levels.
Technical Metrics :
Current price: 0.1736
24H Volume: 1,277,477.5643 ₮
24H Price change: 4.264%
- Pivot Points - Levels :
Resistance: 0.1922 | 0.2103 | 0.2405
Support: 0.162 | 0.1499 | 0.1197
Indicators recommandation :
Oscillators: SELL
Moving Averages: STRONG_BUY
Technical Indicators Summary : BUY
- In-depth ADXUSDT technical analysis on > Tradingview TA page
What do you think of this analysis? Share your insights and let's discuss in the comments below. Your like, follow and support would be greatly appreciated!
Welcome to the home of charting big: TradingView
Benefit from a ton of financial analysis features, instruments and data. Have a look around, and if you do choose to go with an upgraded plan, you'll get up to $30.
Discover it here

ADX / BTC price Analysis | #ADX at buying area | A good buyingLooking for a good buying opportunity in the #ADX cryptocurrency? You might want to take a look at the current forming buying area! In this video, we'll be analyzing the current ADX / BTC price and giving you a good buying opportunity.
If you're looking for a good way to invest in the #cryptocurrency market, then you should definitely check out this ADX / BTC price analysis. We'll be revealing the current buying area and telling you all about the good news that's happening with this cryptocurrency!

ADXUSDTHello Crypto Lovers,
Mars Signals team wishes you high profits.
This is a 4-hour-time frame analysis for ADXUSDT
There are R2 and R1 as our resistance areas which both contain the disability of the price to rise. And S1 and S2 are the support areas with their support of price at different points. Presently, we have the price fluctuating over S1 and our expectation would be a decline to reach S1 and then at this point, we will have two scenarios to happen. One of them includes a rise which is done through some rising signs. Or even it is possible that the price is not supported here and falls to some lower amounts such as S2. The point is to be attentive to everything for better trades.
Warning: This is just a suggestion and we do not guarantee profits. We advise you to analyze the chart before opening any positions.
Wish you luck


ADX bounce?On 0,786 fib, 200sma on 30m, and previous resistance,
The oscillators look nice, good chance for some kind of bounce...
mind the market if entering this...
Tight SL...
Dont expect much...
Trail it with SL up the levels...
Good luck traders

adx/usdtentry from this lvl or wait until retest down trend
target 20 % ( look at chart )
stop lost : 0.1873

ADX USDT* The purpose of my graphic drawings is purely educational.
* None of what i write here is not an investment advice. Please do your own research before investing in any asset.
* Never take my personal opinions as investment advice, you may lose your money


ADX PUMB SOONBuy zone 0.44 sell 30%-50%-100% -500% thank you later. there was a breakout in each of these price zones. buy it and wait for the risk of losing only 10% of your account

ADX/USDT#ADX usdt
BUY AROUND 0.37 0.4130
SEL--0.4437-0.4611-0.4866-$0.5209
Trendy Coin and Sitting at Very Strong Support

adxusdt is in buy area!!adxusdt is in buy area after making new HHs.
this could be the best place to get adxusdt.

ADXUSDTHello Crypto Lovers,
Mars Signals team wishes you high profits.
We are in the daily time frame. There is the R1 line which is a resistance line. You can see the price accumulation below that line. If the line is broken, the price can go up to R2 and then R3. It is also possible for the price to come down to the S1 zone and then go up to the R2 zone after breaking the R1 line.
Warning: This is just a suggestion and we do not guarantee profits. We advise you to analyze the chart before opening any positions.
Wish you luck


AdxUsdt#1234567890
#Abcdefghijklmnobqrstuvwxyz
I think It will fly soon
Not advice to buy or sell
just expectation

Adx UsdtYou can give a chance with a close stop loss and a close buy order.
New currency. Therefore risk must be taken into account.
Note: This is not an investment advice.

ADX/BTC (Bullish Descending Channel?)BINANCE: ADXBTC
-AdEX is trading inside a Bullish descending channel
-The confirmation of this pattern is a break to the upside
-The price is now trading at the previous resistance area
-The 200D MA dynamic support is approaching the price
-I recommend buying the break or retest of trendline resistance
-Upside potential is up to 2600 sat
^Trading involves High Risk
^Not Financial Advice
^Please exercise Risk Management
**If you like my daily Published Ideas
**Please don't forget to leave a thumbs up & comment
**Thank you! :)

ADX/BTC (Potential Support @ 1350 sat area)ADX/BTC
-After the recent over 200% price pump
-The price has retraced already by -50%
-ADX just broke the local support at 1800 range
-It is likely to fall further around 1350 support area
-If we can see any reversal signs in that region
-I recommend to open a Buy position and target up to 1700 or higher
-Stoploss is determined once a position enter is opened
