#AGLD/USDT Alert! Imminent Rise#AGLD
The price is moving within a descending channel on the 1-hour frame, adhering well to it, and is on its way to breaking strongly upwards and retesting it.
We have support from the lower boundary of the descending channel, at 0.850.
We have a downtrend on the RSI indicator that is about to be broken and retested, supporting the upside.
There is a major support area (in green) at 0.835, which represents a strong basis for the upside.
Don't forget a simple thing: ease and capital.
When you reach the first target, save some money and then change your stop-loss order to an entry order.
For inquiries, please leave a comment.
We have a trend to hold above the 100 Moving Average.
Entry price: 0.850
First target: 0.885
Second target: 0.909
Third target: 0.943
Don't forget a simple thing: ease and capital.
When you reach your first target, save some money and then change your stop-loss order to an entry order.
For inquiries, please leave a comment.
Thank you.
Agldusdt

Adventure Gold 679% Easy Target, High Profits & TA (8X Lev)I can translate all of the signals and all the chart data but the truth is that "bullish" because that is what the chart is screaming to me. The chart is saying "bullish" and my intuition is telling me that Adventure Gold (AGLD) is going to move next.
Notice I continue to pick the ones trading low near support. Those trading within the "opportunity buy zone" for our trades. When it comes to those already moving, I only give updates. When it comes to buying and trade-numbers, I choose the ones with low risk vs a high potential for reward.
AGLDUSDT has been closing green four weeks slowly rising, but prices remain very low. This is a bullish type of consolidation. It is a tricky signal because it might look weak but the truth is that this pattern tends to transform into a bullish explosion. The choice is yours.
I give you the chart, the translation, the basics, the training, the learning, the entertainment, the inspiration. I give you peace of mind and the right price. You have to take care of the rest. I can show you the door, but you have to cross it. You have to buy and hold, and be ready to sell when prices are at resistance or near resistance where I show in these charts.
We are a team. It is a huge sacrifice to be able to read the charts without losing focus, without going crazy due to all the distractions, all of the attacks and all of the stress. I have to develop a Buddha kind of meditative mind to be able to keep up and give you only the best. You know I can do it because I've been doing it, the results will speak for themselves, but is it not easy. I have to give my life for these charts and this market, but it is worth it if you take action and use this information to achieve your goals and financial success.
Thank you for reading. We are in this together.
I love you, truly. We've been together for so long, and this is only the start.
Namaste.

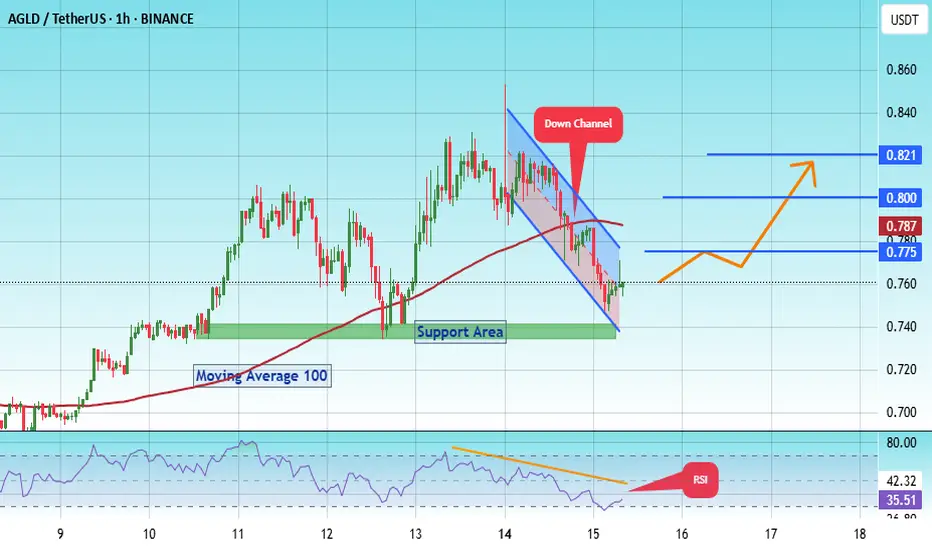
#AGLD/USDT Alert! Imminent Rise #AGLD
The price is moving within a descending channel on the 1-hour frame, adhering well to it, and is on its way to breaking it strongly upwards and retesting it.
We have a bounce from the lower boundary of the descending channel. This support is at 0.740.
We have a downtrend on the RSI indicator that is about to break and retest, supporting the upside.
There is a major support area in green at 0.737, which represents a strong basis for the upside.
Don't forget a simple thing: ease and capital.
When you reach the first target, save some money and then change your stop-loss order to an entry order.
For inquiries, please leave a comment.
We have a trend to hold above the 100 Moving Average.
Entry price: 0.761
First target: 0.775
Second target: 0.800
Third target: 0.821
Don't forget a simple thing: ease and capital.
When you reach your first target, save some money and then change your stop-loss order to an entry order.
For inquiries, please leave a comment.
Thank you.
#AGLD/USDT Alert! Imminent Rise#AGLD
The price is moving within a descending channel on the 1-hour frame, adhering well to it, and is heading for a strong breakout and retest.
We have a bounce from the lower boundary of the descending channel. This support is at 0.685.
We have a downtrend on the RSI indicator that is about to be broken and retested, supporting the upside.
There is a major support area in green at 0.680, which represents a strong basis for the upside.
Don't forget a simple thing: ease and capital.
When you reach the first target, save some money and then change your stop-loss order to an entry order.
For inquiries, please leave a comment.
We have a trend to hold above the 100 Moving Average.
Entry price: 0.0695
First target: 0.700
Second target: 0.718
Third target: 0.734
Don't forget a simple thing: ease and capital.
When you reach the first target, save some money and then change your stop-loss order to an entry order.
For inquiries, please leave a comment.
Thank you.

#AGLD/USDT#AGLD
The price is moving within a descending channel on the 1-hour frame, adhering well to it, and is heading for a strong breakout and retest.
We are experiencing a rebound from the lower boundary of the descending channel, which is support at 0.900.
We are experiencing a downtrend on the RSI indicator, which is about to break and retest, supporting the upward trend.
We are looking for stability above the 100 moving average.
Entry price: 0.970
First target: 1.00
Second target: 1.065
Third target: 1.12

#AGLD/USDT#AGLD
The price is moving within a descending channel on the 1-hour frame, adhering well to it, and is heading for a strong breakout and retest.
We are seeing a bounce from the lower boundary of the descending channel, which is support at 0.848.
We have a downtrend on the RSI indicator that is about to be broken and retested, supporting the upward trend.
We are looking for stability above the 100 moving average.
Entry price: 0.900
First target: 0.939
Second target: 0.986
Third target: 1.06

Adventure Gold Bullish Confirmed — Alert! Imminent RiseHere is one with a very small variation, Adventure Gold.
AGLDUSDT produced a higher low on the 7th of April compared to early August 2024. This is only a shy higher low but still a bullish signal. This is technically a double-bottom. With a double-bottom in place, we can start the next bullish phase.
This is a time based chart. This chart is showing potential for an imminent rise. Let me explain.
After the 7-April low the action has been bullish but the rise quiet and small; things are starting to speed up though.
Today, AGLDUSDT hit the highest price in a month and since the final stop-loss hunt event. With the action turning full green and many Altcoins also going green, we can expect a strong advance next.
Consolidation has been going for almost three months, since February 3. When 5-May comes we will have a full green candle already on the chart with really high volume, followed by additional growth.
This is a good pair and project, can grow within days.
Maximum, 1-2 weeks but we are at the start of the next major bullish wave.
The targets on the chart can be hit short-term.
The time is now.
Thank you for reading.
Namaste.

#AGLD/USDT#AGLD
The price is moving within a descending channel on the 1-hour frame and is expected to break and continue upward.
We have a trend to stabilize above the 100 moving average once again.
We have a downtrend on the RSI indicator, which supports the upward move by breaking it upward.
We have a support area at the lower limit of the channel at 0.853, acting as strong support from which the price can rebound.
Entry price: 0.890
First target: 0.900
Second target: 0.921
Third target: 0.943

#AGLD/USDT#AGLD
The price is moving within a descending channel on the 1-hour frame, adhering well to it, and is heading for a strong breakout and retest.
We are seeing a bounce from the lower boundary of the descending channel, which is support at 0.808.
We have a downtrend on the RSI indicator that is about to be broken and retested, supporting the upward trend.
We are looking for stability above the 100 moving average.
Entry price: 0.825
First target: 0.844
Second target: 0.862
Third target: 0.884

AGLD/USDT — Accumulation Zone Setup 4-2025AGLD/USDT — Accumulation Zone Setup
Buy Zone: $0.80 – $0.60
Panic Key: Daily close below $0.50
Breakout Targets: $0.90 / $1.15
Long-Term Targets: $1.80 / $2.80
Low-cap project (Rank ~500), high volatility play.
Accumulation in progress — manage risk wisely.
Breakout above $0.90 could trigger momentum towards higher targets.
Note:
This is not financial advice but an analysis of coin movements. Conduct your own research and practice risk management before making any investment decisions. Remember, the cryptocurrency market carries significant volatility and risks.
Best wishes to all, we ask Allah reconcile and repay. 🙏

Adventure Gold Breaks Downtrend —Easy 400%+ Within 3 MonthsThis is a very simple trade-idea. A perfect trendline is being broken, a downtrend, together with rising volume. The break of this descending trendline signals the start of a new bullish wave.
Keeping it short and simple, Adventure Gold (AGLDUSDT) is ready to grow. Profits potential goes to 437% in the mid-term. Easy and short-term a 149% profits target (249% total earnings) can be hit.
Strategy: Buy and hold. Set the sell orders on target right after buying and wait patiently. When the targets are hit, collect the profits and move on to the next trade. Just one set of actions and the market takes care of the rest.
Thank you for reading.
Namaste.

#AGLD/USDT
#AGLD
The price is moving within a descending channel on the 1-hour frame, adhering well to it, and is heading for a strong breakout and retest.
We are experiencing a rebound from the lower boundary of the descending channel, which is support at 0.960.
We are experiencing a downtrend on the RSI indicator, which is about to break and retest, supporting the upward trend.
We are looking for stability above the 100 Moving Average.
Entry price: 1.00
First target: 1.02
Second target: 1.05
Third target: 1.087

AGLDUSDT – First Resistance at the Blue Box! AGLDUSDT – First Resistance at the Blue Box!
“Testing a key level—will buyers break through or get rejected?”
🔥 Key Insights:
✅ Blue Box = Strong Resistance Zone – Expect high volatility here.
✅ Breakout = Bullish Confirmation – Retest entries only, no chasing.
✅ Rejection = Short Opportunity – But only with LTF breakdown confirmation.
💡 The Smart Plan:
Monitor LTF (15M & 1H) for Clues – The breakout or rejection will be clear there.
Use CDV & Volume Profile – Smart money leaves tracks, follow them.
Trade the Reaction, Not the Prediction – We respond, not guess.
“Discipline wins, watch the blue box and let the market speak!” 📉
A tiny part of my runners:
🎯 ZENUSDT.P: Patience & Profitability | %230 Reaction from the Sniper Entry
🐶 DOGEUSDT.P: Next Move
🎨 RENDERUSDT.P: Opportunity of the Month
💎 ETHUSDT.P: Where to Retrace
🟢 BNBUSDT.P: Potential Surge
📊 BTC Dominance: Reaction Zone
🌊 WAVESUSDT.P: Demand Zone Potential
🟣 UNIUSDT.P: Long-Term Trade
🔵 XRPUSDT.P: Entry Zones
🔗 LINKUSDT.P: Follow The River
📈 BTCUSDT.P: Two Key Demand Zones
🟩 POLUSDT: Bullish Momentum
🌟 PENDLEUSDT.P: Where Opportunity Meets Precision
🔥 BTCUSDT.P: Liquidation of Highly Leveraged Longs
🌊 SOLUSDT.P: SOL's Dip - Your Opportunity
🐸 1000PEPEUSDT.P: Prime Bounce Zone Unlocked
🚀 ETHUSDT.P: Set to Explode - Don't Miss This Game Changer
🤖 IQUSDT: Smart Plan
⚡️ PONDUSDT: A Trade Not Taken Is Better Than a Losing One
💼 STMXUSDT: 2 Buying Areas
🐢 TURBOUSDT: Buy Zones and Buyer Presence
🌍 ICPUSDT.P: Massive Upside Potential | Check the Trade Update For Seeing Results
🟠 IDEXUSDT: Spot Buy Area | %26 Profit if You Trade with MSB
📌 USUALUSDT: Buyers Are Active + %70 Profit in Total
🌟 FORTHUSDT: Sniper Entry +%26 Reaction
🐳 QKCUSDT: Sniper Entry +%57 Reaction
📊 BTC.D: Retest of Key Area Highly Likely

#AGLD/USDT#AGLD
The price is moving in a descending channel on the 1-hour frame and is adhering to it well and is heading to break it upwards strongly and retest it
We have a bounce from the lower limit of the descending channel, this support is at a price of 1.12
We have a downtrend on the RSI indicator that is about to break and retest, which supports the rise
We have a trend to stabilize above the moving average 100
Entry price 1.14
First target 1.19
Second target 1.24
Third target 1.29

#AGLD/USDT#AGLD
The price is moving in a descending channel on the 1-hour frame and is expected to continue upwards
We have a trend to stabilize above the moving average 100 again
We have a descending trend on the RSI indicator that supports the rise by breaking it upwards
We have a support area at the lower limit of the channel at a price of 1.27
Entry price 1.30
First target 1.34
Second target 1.834
Third target 1.43

#AGLD/USDT#AGLD
The price is moving in a descending channel on the 1-hour frame and is adhering to it well and is heading to break it strongly upwards and retest it
We have a bounce from the lower limit of the descending channel, this support is at a price of 1.08
We have a downtrend on the RSI indicator that is about to break and retest, which supports the rise
We have a trend to stabilize above the moving average 100
Entry price 1.22
First target 1.20
Second target 1.28
Third target 1.37

#AGLD Ready for a Major Breakout? Accumulation Phase Ending!🔹 Trend Overview: After a prolonged downtrend, #AGLD has entered a strong accumulation phase, signaling a potential trend reversal.
🔹 Key Levels to Watch:
Resistance: 1.4
Support: 0.865
🔹 Trading Plan:
We are watching for a breakout above resistance to confirm an uptrend. If volume supports the move, it could trigger a strong rally.
🔹 Confluence Factors:
Fibonacci Levels Aligned
Volume Increasing
RSI Showing Bullish Divergence
🔹 Trade Setup:
Long above 1.4
Stop Loss: 0.865
Targets: 2.18 & 3
🔹 What do you think? Will #AGLD break out or fake out? Drop your thoughts below!
🔹 Follow for more real-time setups & market insights!

MKRUSDT UPDATEMKRUSDT is a cryptocurrency trading at $1,116. Its target price is $1,700, indicating a potential 55%+ gain. The pattern is a Bullish Falling Wedge, a reversal pattern signaling a trend change. This pattern suggests the downward trend may be ending. A breakout from the wedge could lead to a strong upward move. The Bullish Falling Wedge is a positive signal, indicating a potential price surge. Investors are optimistic about MKRUSDT's future performance. The current price may be a buying opportunity. Reaching the target price would result in significant returns. MKRUSDT is poised for a potential breakout and substantial gains.

#AGLD/USDT#AGLD
The price is moving in a descending channel on the 1-hour frame and is expected to continue upwards
We have a trend to stabilize above the moving average 100 again
We have a descending trend on the RSI indicator that supports the rise by breaking it upwards
We have a support area at the lower limit of the channel at a price of 1.40
Entry price 1.51
First target 1.60
Second target 1.68
Third target 1.76

AGLD should close 50% of this wickGATEIO:AGLDUSDT
We should come back and close at least 50% of this huge wick on D1
✅Before we start to discuss, I would be glad if you share your opinion on this post's comment section and hit the like button if you enjoyed it.
Thank you.
Possible Targets and explanation idea
➡️Local picture since June we got signals to buy on Trade ON indicator. Strong signal to buy
➡️Usually when we got some huge wick candle it means in that level we got a liquidity. So we should come back and close at least 50% of this wick
➡️Possible retest local downtrend line after FOMC increasing rate in November
➡️50% of June wick is exactly "Exit" line on Take Profit indicator
➡️Trades possible retest 0.28 cents and exit point 0.56 cents
Hope you enjoyed the content I created, You can support with your likes and comments this idea so more people can watch!
✅Disclaimer: Please be aware of the risks involved in trading. This idea was made for educational purposes only not for financial Investment Purposes.
* Look at my ideas about interesting altcoins in the related section down below ↓
* For more ideas please hit "Like" and "Follow"!

#AGLD/USDT Ready to go higher#AGLD
The price is moving in a descending channel on the 1-hour frame and sticking to it well
We have a bounce from the lower limit of the descending channel, this support is at 1.64
We have a downtrend on the RSI indicator that is about to be broken, which supports the rise
We have a trend to stabilize above the moving average 100
Entry price 1.71
First target 1.85
Second target 2.00
Third target 2.20

AGLD Overview!BINANCE:AGLDUSDT
we can see that AGLD is in a bullish channel!
the price is near It's bottom So it should be able to start a bullish Movement from Here!👍
⚠️ Disclaimer:
This is not financial advice. Always manage your risks and trade responsibly.
👉 Follow me for daily updates,
💬 Comment and like to share your thoughts,
📌 And check the link in my bio for even more resources!
Let’s navigate the markets together—join the journey today! 💹✨

AGLDUSDT Long Setup - Spot BINANCE:AGLDUSDT
📈Which side you pick?
Bull or Bear
Low-risk status: 3x-4x Leverage
Mid-risk status: 5x-8x Leverage
(For beginners, I suggest low risk status)
👾Note: The setup is active but expect the uncertain phase as well. also movement lines drawn to predict future price reactions are relative and approximate.
➡️Entry Area: 1 step now
Yellow zone: 2nd step = 2.61-2.32
⚡️TP:
3.13
3.55
4.13
🔴SL:
1.99
🧐The Alternate scenario:
If the price stabilizes against the direction of the position, below or above the trigger zone, the setup will be canceled.
