Soybean Technical Update (6.8.22)Soybeans (July)
Technicals: July soybean futures were able to defend trendline support in the prior two sessions which helped spark a rally in yesterday’s trade. That rally has led to follow-through buying in the overnight/early morning trade with July futures making new contract highs. The market has been up here a few times in the past few weeks but failed to find more buyers. Time will tell if this time is different. With the market at new contract highs, the task of finding the next meaningful resistance point becomes more difficult. Going off the continuous chart you could use the February 24th high for the March contract, 1759 ¼ and the April 22nd high from the May contract, 1757 ½. Finding meaningful points above that is a game of pin the tail on the donkey.
Bias: Neutral
Previous Session Bias: Neutral
Resistance: 1757 ½-1760**
Pivot: 1750
Support: 1717-1720***, 1690**, 1673-1679 ½***
Agricultural Commodities

Technical Update for July CornCorn (July)
Technicals: July corn futures were able to chew through significant resistance during yesterday’s session, which has opened the door for an extension towards our next resistance pocket, 769-773. This pocket represents the lower high from the end of May, as well as the 50-day moving average. If the Bulls can keep the momentum going and chew through this resistance pocket, a retest of the psychologically significant $8.00 handle wouldn’t be out of the question.
Bias: Neutral
Previous Session Bias: Neutral/Bearish
Resistance: 769-773 ½***, 789 ½-790 ½**, 800-803 ¾**
Support: 747-753****, 729-733**, 716-720 ½****
Crude oil, Dow Jones, and Soybeans: Many things are currently driving the bullish Ag markets. Oil/energy are heavily weighted in providing this bullish enthusiasm. The supply and demand for Corn and beans will be directly and indirectly impacted by Oil/energy markets. Energy Markets have the potential to react hard and fast on diminishing economic data. A strong economy should keep Oil and Ag Markets elevated to potentially extremely high levels. A soft economy (using DJI as a gauge) moving into recessionary mode, will kill oil demand and take down Ag markets for some time as well (as it did in 08’). I don’t know for sure what to expect for our economy, sensitive and volatile ahead… 23’ Corn and Beans are in Pickle. Inputs are expected to rise considerably so naturally we want today’s Cash prices (or better) for a more expensive 23’ Crop. It’s hard to price something (23’ crop) that is $1-$3 below the current Cash Market. But when this drops, the markets won’t ask you for your costs of production before dropping… Don’t fall asleep on multiple crop years, especially if we see “Blow off Top” activity in Oil and old Crop Ag markets.

Real economy beating expectations yet markets trading in red 🤔INVESTMENT CONTEXT
President Vladimir Putin said that Russia was not blocking Ukrainian wheat from being exported, and that the grain could be dispatched via ports controlled either by Russia or Ukraine. Before the war, Russia and Ukraine accounted for ca. 29% of international annual wheat sales
U.S. economy added 390,000 jobs in May, beating analyst expectations (325,000) and showing resilient real economy in the face of rampant inflation and higher interest rates
Crude oil inventories in the U.S. fell to 414.7 million barrels in the wake of strong demand, yet limiting chances of further releases to cool domestic energy prices
Goldman Sachs COO John Waldron followed JPMorgan's CEO Jamie Dimon saying “This is among if not the most complex, dynamic environment I’ve ever seen in my career". On a similar tone, in a leaked Tesla email, Elon Musk cited having a "super bad feeling" about the economy as the main reason for shedding 10% of the company's workforce
PROFZERO'S TAKE
When good news are met with S&P 500 dropping more than 1.50%, and Nasdaq doing even worse at 2.47% in the red, we know something is off. That's what happens when bears are in control, and policy makers are desperate to understand how far can they move with tightening before the backlash. A remarkably strong U.S. economy just added 390,000 jobs in May, beating analyst expectations and reassuring the Fed it could maintain the trajectory of 50bps rate hikes in July and August. ProfZero clearly welcomes Main Street's resilience and rising wages - yet, as anticipated in Step99 podcast, it cautions against the forward-looking effects of monetary policy vs. the actual state of the economy. As pointed out by The Economist, "A recession in America by 2024 looks likely" - today's strength of the real economy may at best soften its blow
Citigroup CEO Jane Fraser sees "three R" whiplashing EU economy - rates, Russia and recession, this latter happening in Europe ahead of the U.S. because of "the energy side (...) really having an impact". ProfZero has made energy a key theme of this Parlay, with potentially more decisive effects on the real economy than monetary policy. With Brent testing again USD 120/boe and fading cushion inventories from the U.S., it is hard to imagine how the EU will cope with the next cold season without rationing output, hence slashing GDP growth. Regasification plants and last-generation nuclear are definitely tools of the future; but by then, are seaborne imports going to be enough?
Equities are definitely off the lows witnessed in April and early May - perhaps Musk's "super bad feeling" and Mr. Dimon's "hurricane" are rather looming on the real economy? Not an inch less worrying...
BTC once again confidently breaking up the mid-term triangle pattern and trying to regain 32k after trading below 30k on June 4-5 - and yet ProfZero's eyes are set on the lurking death cross on 200MA
PROFONE'S TAKE
After sharing about lithium and nickel, ProfOne completes the overview of rare minerals that are crucial for the production of batteries setting its eyes are on cobalt. Cobalt prices soared from USD 30k/ton in January to USD 52k in May - on top of the 2x surge in 2021 vs. 2020. According to the Cobalt Institute, in the next five years cobalt demand is expected to hit 320k/ton, up from 175k/ton in 2021. ProfOne argues that meeting such demand won’t be operatively easy. For once, cobalt is yet another highly concentrated resource: about 70% of world’s cobalt comes from the Democratic Republic of Congo, where production is dominated by Chinese companies and commodities trader Glencore (GLEN). Adding to it that world's second supplier of cobalt is Russia, the metals puzzle turns out to be a fairly intricate one

Corn (Central Banks can't print Food)View On Corn (6 June 2022)
We are seeing some possible bottoming signs, and we shall see a lot higher price pretty soon.
So, it is better to buy in slowly and accumulate them.
Tip and Toe.
Let's see
DYODD, all the best and read the disclaimer too.
Feel Free to "Follow", press "LIKE" "Comment".
Thank You!
Legal Risk Disclosure:
Trading foreign exchange or CFD on margin carries a high level of risk, and may not be suitable for all investors.
The high degree of leverage can work against you as well as for you. Before deciding to trade foreign exchange you should carefully consider your investment objectives, level of experience and risk appetite.
The possibility exists that you could sustain a loss of some or all of your initial investment and therefore you should not invest money that you cannot afford to lose.
You should be aware of all the risks associated with foreign exchange trading, and seek advice from an independent financial advisor.

wheat & oil, 50 years channelIf you have access to historical data, you see correlation in commodities macro trends and especially same time cycles.
this chart is a small sample (which now affects the whole world) and we see same channel, same time sycle, same macro trends and same target for this trend...

Soy Bean update - 05/06/2022expecting more upside near 1850 to complete wave (5) of ((3)), key level at 1576.6

NQCIKCTR $NQCIKCTR Initial Short NQCIKCTR $NQCIKCTR Initial Short. SL and TP on chart. Move SL on TP.


SOYBEANS $SOYBEANS High-risk Initial Short SOYBEANS $SOYBEANS High-risk Initial Short . SL and TP on chart. 10-30x leverage. Move SL on TP.

Corn: 2 possible scenariosAn attempt to show potential paths that corn could take.
• Currently have an up-trending pitchfork (blue): If corn respects trend line support and makes another run up, the trajectory could warrant a move above $9.00 into mid July and into August. Sep Corn will have some work to do to chew through the large inverse but it can be done. The green bars illustrating the move is a ghost feed from this same time frame on 2012’s move higher.
• The down-trending pitchfork (red) will make an attempt to it’s own median line at 6.11 and could theoretically make that move into last half of June (July contract). At this point we could se an attempt back up to compete with recent highs.
So what to do. New crop (Dec22) will follow the course of front months, so use continuous chart to help make decisions on new crop.
On a break above the upper level downtrend line on the red pitch fork (following the green ghost feed) start looking at selling physical, buying puts, selling option premiums (spreads…), etc
On a move below the lower level up-trending blue pitchfork, look for support to re own or buy courage calls (against the red ghost feed). Keep targets on a recovery at retracement’s just below the high mark and be ready to lift out of calls or roll up calls in that area. Buy puts on the recovery to get 100% priced and protected.
All of this is in theory and not necessarily a decisive game plan. Just wanted to share some thoughts...

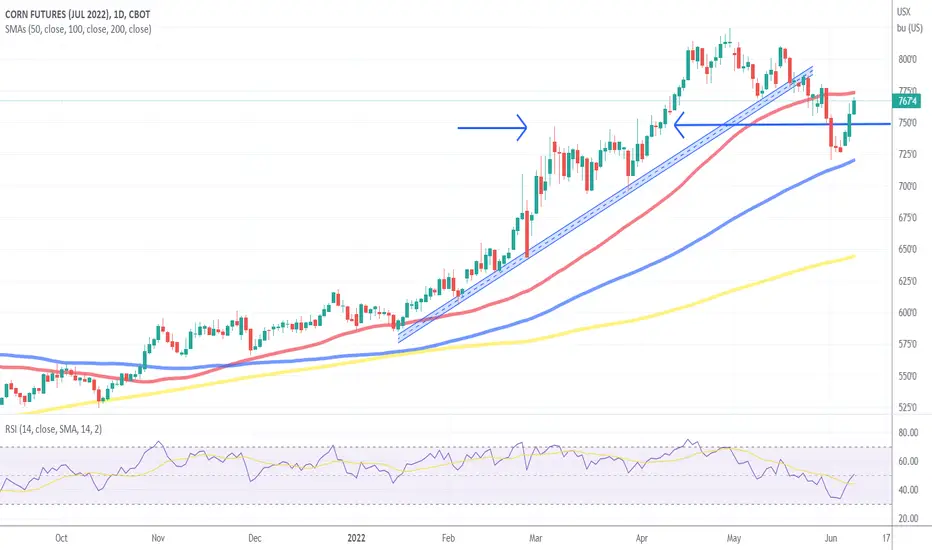
Corn - Monthly continuous Last years high of 7.35 met the median line of the long term pitch fork and turned lower. This year we have met the median line again with a high of 8.24. It appears that the median line has strong resistance. The momentum indicators (RSI and Stochastics) are turning lower. The divergence in lower pivots this year on each indicator accompanied by higher highs in corn cautions of a potential change in trend.
**Cautiously Bullish Corn, this chart is the reason to be cautious**

Corn - Weekly ContinuousThe weekly chart is showing divergence in momentum from 2/28’s pivot high at 7.82 to 4/25’s high of 8.24. Stochastics has turned lower as well. Corn has several areas of support but the lower uptrend line on the pitchfork should offer solid support. For the next few weeks the lower line support area at 6.85 to 7.10.
Targets above at 8.82 will find resistance through mid July. A move above the median line will next target 9.73.

Coffee Arabica Reached ResistanceHello friends,
Coffee has reached a resistance point after a long rally on the hourly timeframe.
Short, with stop loss set @ 2.30
Take profit -2% or more from current price.
Take care
Please follow and like!

The great 2022 rotation Tech/Crypto -> Agriculture.Opinion:
As oil prices increase, crop rotations kick-in favoring Wheat production where the climate is appropriate. Price of agricultural goods is affected by increased transport prices and crop production space rotations. I expect all agricultural produces prices to increase significantly in the coming months. Including sugar. TP1 looks attractive.
This is not intended or made to constitute any financial advice.
Notes on how I personally use my charts/NFA:
Each level L1-L3 and TP1-TP3 has a deployment percentage. The idea is to flag these levels so I can buy 11% at L1 , 28% at L2 and if L3 deploy 61% of assigned dry powder. The same in reverse goes for TP. TP1: 61%, TP2:28% and TP3:11%. If chart pivots between TP's, in-between or in Between Sell levels these percentages are still respected. I like to use the trading range to accumulate by using this tactic.
Just my personal way of using this. This is not intended or made to constitute any financial advice.
This is not intended or made to constitute any financial advice.
FED Macro Situation Consideration:
All TP's are drawn within the context of a return to FED neutral policy. I do not expect these levels to be reached before tightening is over.
NOT INVESTMENT ADVICE
I am not a financial advisor.
The Content in this TradingView Idea is for informational purposes only, you should not construe any such information or other material as legal, tax, investment, financial, or other advice. Nothing contained within this idea constitutes a solicitation, recommendation, endorsement, or offer to buy or sell any securities or other financial instruments in this or in in any other jurisdiction in which such solicitation or offer would be unlawful under the securities laws of such jurisdiction.
All Content on this idea post is information of a general nature and does not address the circumstances of any particular individual or entity. Nothing in the idea/post constitutes professional and/or financial advice, nor does any information on the idea/post constitute a comprehensive or complete statement of the matters discussed or the law relating thereto. You alone assume the sole responsibility of evaluating the merits and risks associated with the use of any information or other Content on the idea/post before making any decisions based on such information.

WHEATTREND IS DOWNWARD
Possible to sell
ratio 1:3
No need to care about other indicators such as RSI, MACD, MA, Stochastic.....

Daily Grain Futures Volatility Forecast 26 May 22 ZS ZC ZW WHEAT ZW 26 May 2022
The current volatility is expected with close to 90% chance to be below 4.17%
In this case, our channel for today is going to be
TOP 1180
BOT 1085
--------------------------------------------------------------------------------------------------------------------
CORN ZC 26 May 2022
The current volatility is expected with close to 90% chance to be below 2.41%
In this case, our channel for today is going to be
TOP 781
BOT 744
--------------------------------------------------------------------------------------------------------------------
SOYBEAN ZS 26 May 2022
The current volatility is expected with close to 90% chance to be below 2%
In this case, our channel for today is going to be
TOP 1709
BOT 1641
--------------------------------------------------------------------------------------------------------------------

Time to think out of the box 💡INVESTMENT CONTEXT
Equities failed to sustain May 23 uptick, with bears firmly in control of the market sending Nasdaq in the low 11k bracket
U.S. retailer Best Buy (BBY) missed EPS forecasts, but downplayed recession fears
S&P Global’s Composite Purchasing Managers’ Index (PMI), a measure of the services and manufacturing industries, fell to 51.8 in May, its lowest level since February 2021; meanwhile, new home sales in the U.S. fell 26.9% on a yearly basis
At Davos, Davos, George Soros remarked that “Indeed, the Russian invasion may turn out to be the beginning of World War III, and our civilization may not survive it“
After taking a leading role in Netflix (NFLX) one-day 30% slump, hedge fund manager Bill Ackman tweeted "Inflation is out of control (...) Markets are imploding because investors are not confident that the (Fed) will stop inflation. If the Fed doesn’t do its job, the market will do the Fed’s job"
PROFZERO'S TAKE
Tensions in Ukraine remain high after Russia's capture of the port-city of Mariupol. As EU's resolve is being tested by the concerns of some member States (Hungary in particular) on energy security, analysts see the conflict in Donbas dragging in a protracted war of attrition. ProfZero hasn't failed to notice the regained momentum of RUB in the wake of the growing fringe of European energy companies bowing to Moscow's request of supplies being paid in its own currency - yet the catch 22 is becoming thornier by the hour now that soft commodities vehemently entered the picture, escalating the crisis to a global level
Russia may in fact be nearing default, as the U.S. Treasury Department said it would end as of May 25 a waiver that allowed Russia’s central bank to process payments to bondholders in USD through U.S. and international banks, on a case-by-case basis. The first tranche of interest on debt is scheduled for May 27, when EUR 100mln are due on two bonds. ProfZero has long been reporting the eventual default of Russia as a further aggravating catalyst to the overall macro scenario - now that the moment of truth nears, ripples from the eventual default also must be accounted for, starting from the consequences to soft commodities
Buffett binging on U.S. equities while Soros calling the possible end of our civilization. Coincidence? As much as Bill Ackman, ProfZero only believes in the inescapable, cold efficiency of the market. Greed has all it takes to eat inflation's lunch
ProfZero is starting to feel uneasy about the prolonged range-bound trading pattern drawn by BTC. Whilst impressed by the resilience of the entire blockchain space to the broader turmoil, and even more so by the rebound after LUNA's demise, ProfZero argues the current trading structure conjures fears of sudden, major drops should bears launch a short attack on the segment (much akin to the meltdown on April 29)

Starbucks (SBUX) bullish scenario:The technical figure Triangle can be found in the US company Starbucks Corporation (SBUX) at daily chart. Starbucks Corporation is an American multinational chain of coffeehouses and roastery reserves headquartered in Seattle, Washington. It is the world's largest coffeehouse chain. As of November 2021, the company had 33,833 stores in 80 countries, 15,444 of which were located in the United States. Out of Starbucks' U.S.-based stores, over 8,900 are company-operated, while the remainder are licensed. The Triangle has broken through the resistance line on 21/05/2022, if the price holds above this level you can have a possible bullish price movement with a forecast for the next 4 days towards 79.10 USD. Your stop loss order according to experts should be placed at 70.36 USD if you decide to enter this position.
After 15 years in the country, Starbucks announced it was exiting Russia. Starbucks to close 130 stores in Russia, unionization push expands to over 260 U.S. stores. n addition, as a result of its exit from Russia, the fast food giant said it expected to record a charge of approximately $1.2 to 1.4 billion to write off its net investment in the market and recognize significant foreign currency translation losses.
Risk Disclosure: Trading Foreign Exchange (Forex) and Contracts of Difference (CFD's) carries a high level of risk. By registering and signing up, any client affirms their understanding of their own personal accountability for all transactions performed within their account and recognizes the risks associated with trading on such markets and on such sites. Furthermore, one understands that the company carries zero influence over transactions, markets, and trading signals, therefore, cannot be held liable nor guarantee any profits or losses.

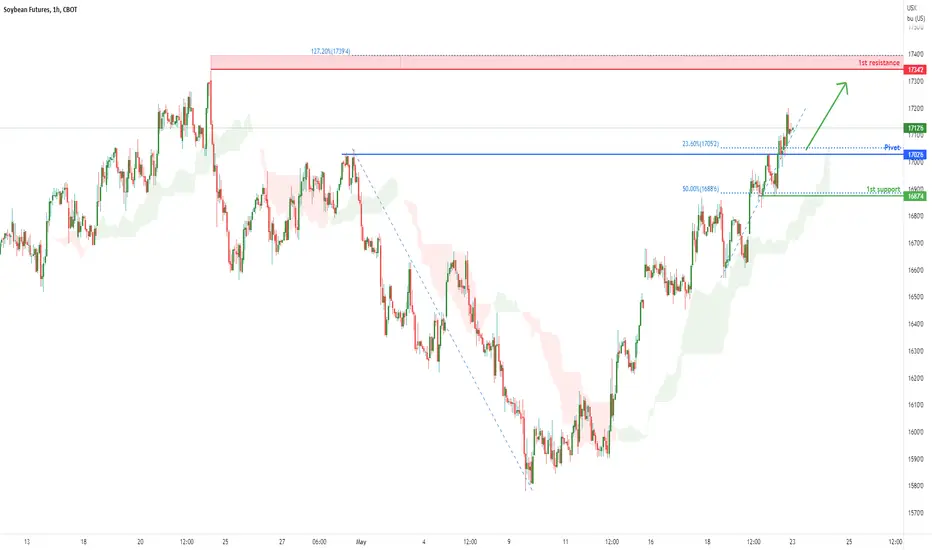
Soy beans Futures ( ZS1! ), H1 Potential for Bullish bounceType : Bullish Bounce
Resistance : 1734
Pivot: 1702
Support : 1687
Preferred Case: With price moving above our ichimoku cloud , we have a bullish bias that price will rise to our 1st resistance at 1734 in line with the 127.2% Fibonacci extension from our pivot of 1702 in line with the horizontal pullback support and 23.6% Fibonacci retracement.
Alternative scenario: Alternatively, price may break pivot structure and head for 1st support at 1687 in line with the horizontal overlap support and 50% Fibonacci retracement .
Fundamentals: No Major News

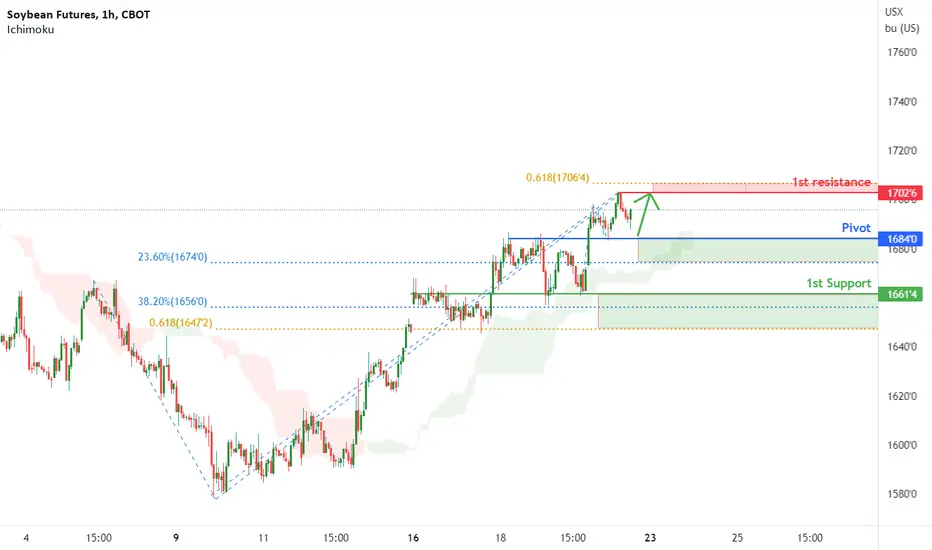
Soy beans Futures ( ZS1! ), H1 Potential for Bullish bounType : Bullish Bounce
Resistance : 1702'6
Pivot: 1684'0
Support : 1661'4
Preferred Case: With price being above our ichimoku cloud , we have a bullish bias that price will rise to our 1st resistance at 1702'6 in line with the swing high resistance and 61.8% Fibonacci projection from our pivot of 1684'0 in line with the horizontal overlap support and 23.6% Fibonacci retracement .
Alternative scenario: Alternatively, price may break pivot structure and head for 1st support at 1661'4 in line with the horizontal overlap support, 38.2% fibonacci retracement and 61.8% Fibonacci projection .
Fundamentals: No Major News
Any opinions, news, research, analyses, prices, other information, or links to third-party sites contained on this website are provided on an "as-is" basis, as general market commentary, and do not constitute investment advice. The market commentary has not been prepared in accordance with legal requirements designed to promote the independence of investment research, and it is therefore not subject to any prohibition on dealing ahead of dissemination. Although this commentary is not produced by an independent source, FXCM takes all sufficient steps to eliminate or prevent any conflicts of interest arising out of the production and dissemination of this communication. The employees of FXCM commit to acting in the clients' best interests and represent their views without misleading, deceiving, or otherwise impairing the clients' ability to make informed investment decisions. For more information about the FXCM's internal organizational and administrative arrangements for the prevention of conflicts, please refer to the Firms' Managing Conflicts Policy. Please ensure that you read and understand our Full Disclaimer and Liability provision concerning the foregoing Information, which can be accessed on the website.
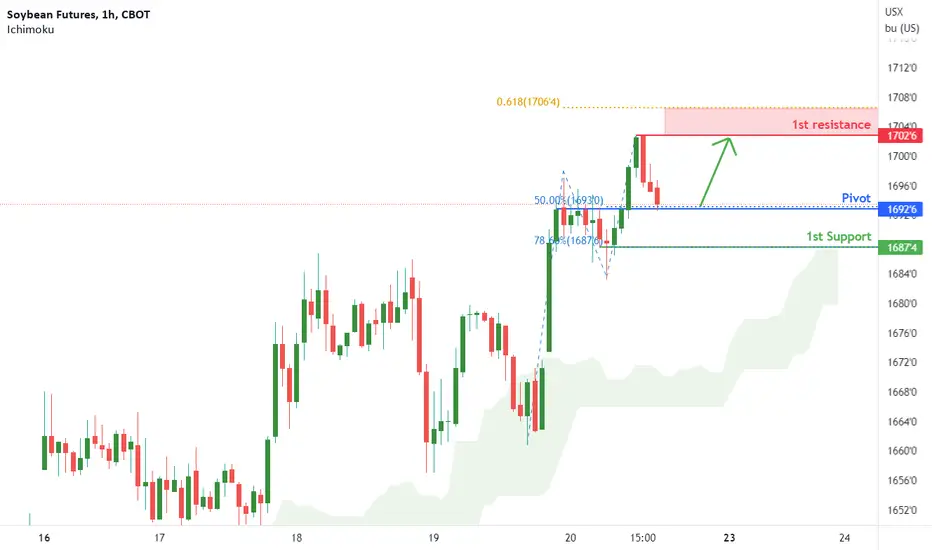
Soy beans Futures ( ZS1! ), H1 Potential for Bullish bounceType : Bullish Bounce
Resistance : 1702'6
Pivot: 1692'6
Support : 1687'4
Preferred Case: With price being above our ichimoku cloud , we have a bullish bias that price will rise to our 1st resistance at 1702'6 in line with the swing high resistance and 61.8% Fibonacci projection from our pivot of 1692'6 in line with the horizontal pullback support and 50% Fibonacci retracement .
Alternative scenario: Alternatively, price may break pivot structure and head for 1st support at 1687'4 in line with the horizontal swing low support and 78.6% Fibonacci retracement .
Fundamentals: No Major News
Any opinions, news, research, analyses, prices, other information, or links to third-party sites contained on this website are provided on an "as-is" basis, as general market commentary, and do not constitute investment advice. The market commentary has not been prepared in accordance with legal requirements designed to promote the independence of investment research, and it is therefore not subject to any prohibition on dealing ahead of dissemination. Although this commentary is not produced by an independent source, FXCM takes all sufficient steps to eliminate or prevent any conflicts of interest arising out of the production and dissemination of this communication. The employees of FXCM commit to acting in the clients' best interests and represent their views without misleading, deceiving, or otherwise impairing the clients' ability to make informed investment decisions. For more information about the FXCM's internal organizational and administrative arrangements for the prevention of conflicts, please refer to the Firms' Managing Conflicts Policy. Please ensure that you read and understand our Full Disclaimer and Liability provision concerning the foregoing Information, which can be accessed on the website.