SUGAR update - 28/04/2022expecting a strong move higher in wave 3, on the other side and as alternate count the move lower than 18.945 will let us expect a big flat pattern in wave 2.
Agricultural Commodities

Sugar Futures ( SB1!), H1 Potential for Bullish RiseType: Bullish Rise
Resistance: 19.37
Pivot: 18.98
Support : 18.84
Preferred case: We are expecting the price to potentially rise from our pivot level of 18.98 in line with 78.6% Fibonacci retracement and 100% Fibonacci projection towards our 1st resistance level of 19.37 which is in line with 50% Fibonacci retracement and 61.8% Fibonacci projection.
Alternative scenario: Otherwise, the price might break our pivot structure and trigger a dip to the 1st support level of 18.84 which is in line with previous graphical swing low support.
Fundamentals: No major news.

Soy Bean update - 27/04/2022upside focus remains, expecting a strong move higher near 1880 to complete wave 5, critical support at 1560.4

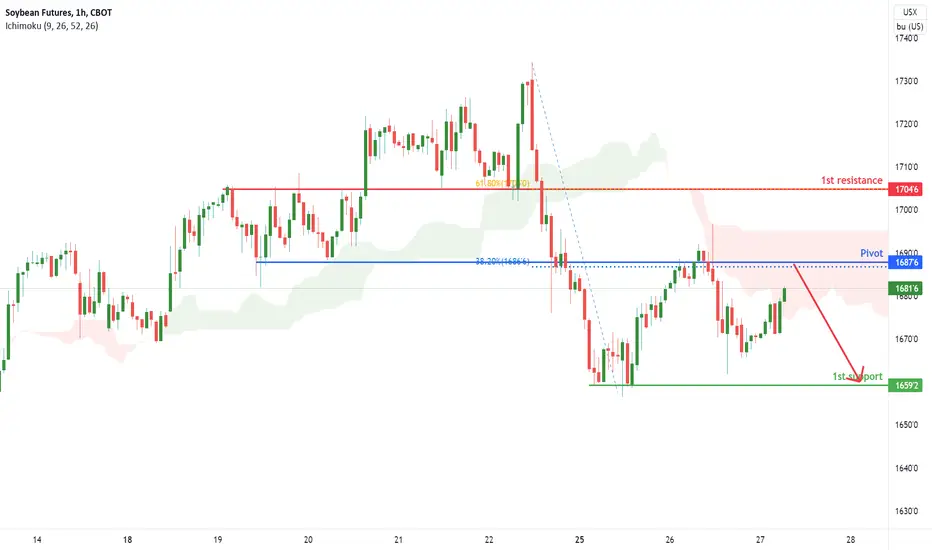
Soybean Futures (ZS1!), H1 Potential for Bearish ContinuationType : Bearish Continuation
Resistance: 1704'6
Pivot: 1687'6
Support : 1659'2
Preferred case: With price moving below the ichimoku cloud, we see a potential bearish continuation from our pivot level of 1687'6 which is in line with 38.2% Fibonacci retracement and horizontal pullback resistance towards our 1st support level of 1659'2 which is in line with the horizontal swing low support.
Alternative scenario: Alternatively, price may break our pivot structure and head for 1st resistance level of 1704'6 in line with 61.8% Fibonacci retracement and horizontal pullback resistance.
Fundamentals: No major news.

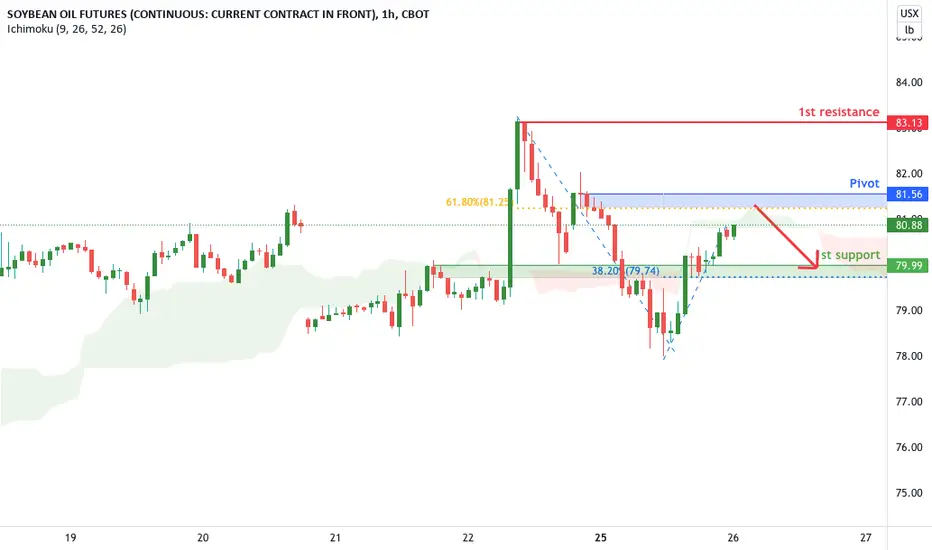
Soybean Oil Futures (ZL1!), H1 Potential for Bearish ContinuatioType : Bearish Continuation
Resistance: 83'13
Pivot: 81'56
Support : 79'99
Preferred case: With price expected to reverse off the resistance of the ichimoku cloud, we see a potential bearish continuation from our pivot level of 81'56 which is in line with 61.8% Fibonacci retracement and horizontal overlap resistance towards our 1st support level of 79'99 which is in line with the horizontal swing high resistance.
Alternative scenario: Alternatively, price may break our pivot structure and head for 1st resistance level of 83'13 in line with 38.2% Fibonacci retracement and horizontal pullback resistance.
Fundamentals: No major news.
Wheat and Oil are like twinsDaily chart of Crude Oil and Wheat are identical since 2021- Anyone has any idea what this means?

COTTON Supply And Demand AnalysisSee Picture For Analysis... Thoughts?
-Price inside HTF demand
-Trend = Uptrend
-Wait For LTF Confirmation (trend Line break/opposing zones removed)
-Need quality demand created

July 22' Sugar #11 Futures Technical Analysis Bearish CaseGoing back to November 18, 2021, July 22’ Sugar was in a downtrend, which was broken on Mar 1, 2022 with a close of 18.12. This began a new Primary uptrend, remaining intact until April 20, 2022.
Even though this trendline was broken with conviction (closing on the lows of the day April 20), the market rallied on April 21, closing at 19.81 (6 ticks from the high). This close touched that broken trendline, but this time, from the opposite side!
More importantly for April 21, the market bounced off 19.49 (low of the day), which was previous major resistance (Pink Line Mar 7-10). Previous resistance tends to become support when a market is in an uptrend.
Friday, April 22 brought a solid down day, taking out not only the 19.50 level, but closing below the first major Fibonacci Level (.382) of 19.29. This day brought the most volume (78.31k contracts) since April 13.
April 13 was the contract high yet closed the day forming a Gravestone Doji Top.
Moving onto technical indicators, the MACD (Moving Average Convergence Divergence) is currently below its 9 EMA (bearish), and below levels not seen since Mar 18 (Sugar had a high of 18.88 that day, well below where we are trading today!). This is considered Negative Divergence, as Sugar is trading higher today, then the last time period when MACD was at these levels.
Bearish Case:
Up trendline on a Daily chart that is broken.
Daily Gravestone Doji Top completed on the contract high.
Negative MACD divergence.
Currently trading below the .382 Fibonacci retracement level from the previous trendline.
18.92 (50% retracement level) is very likely to be seen sooner than later. One thing to keep in mind is that 19.50 could be revisited, yet this time acting as resistance. If 19.50 is revisited, and remains intact as resistance, a close below 19.17 in needed as confirmation to continue lower.
-Paul Wankmueller CMT

Long Soybeans1) Commodities are on a run
2) Soybeans is in an upward trend
3) Instrument $SOYB Teucrium Soybean ETF

Soybean Futures (ZS1!), H1 Potential for Bullish rise!Type: Bullish rise
Resistance : 1726'4
Pivot: 1704'6
Support : 1688'4
Preferred case: With price moving above the ichimoku cloud and the ascending trendline, we have a bullish bias that price will rise to our 1st resistance in line with the 1726'4 in line with the swing high resistance from our pivot of 1704'6 in line with the 50% Fibonacci retracement and the horizontal overlap support.
Alternative scenario: Alternatively, price may break pivot structure and head for 1st support at 1688'4 in line with the 50% Fibonacci retracement and the horizontal swing low support.
Fundamentals: No major news.

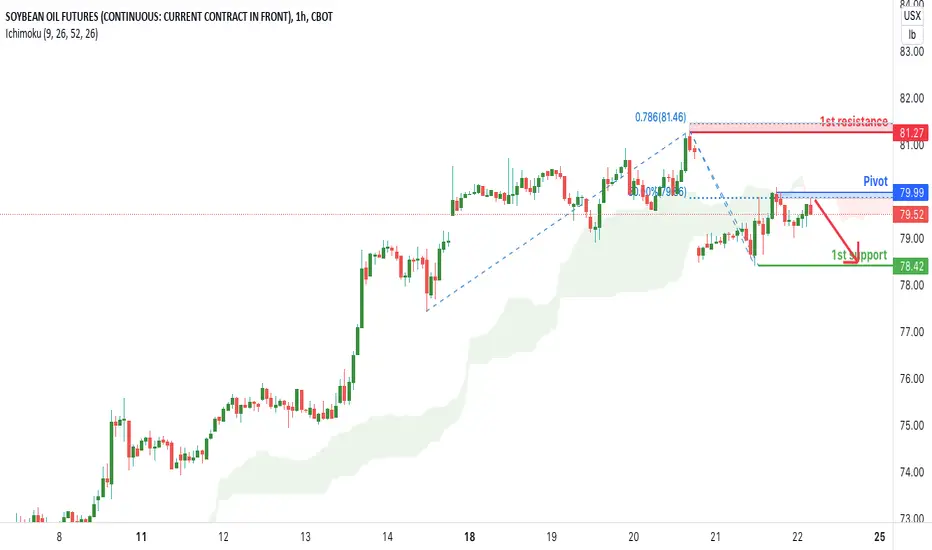
Soybean Oil Future (ZL1! ), H1 Potential for Bearish ContinuatioType : Bearish Continuation
Resistance: 81.27
Pivot: 79.67
Support : 78.42
Preferred case: With price moving below the ichimoku cloud, we see a potential bearish continuation from our pivot level of 79.67 which is in line with 50% Fibonacci retracement towards our 1st support level of 78.42 which is in line with the horizontal swing low support.
Alternative scenario: Alternatively, price may break our pivot structure and head for 1st resistance level of 81.27 in line with 78.6% Fibonacci projection.
Fundamentals: No major news.
Cocoa Futures (CC1! ), H1 Potential for Bearish ReversalType: Bearish Reversal
Resistance: 2645
Pivot: 2607
Support: 2557
Preferred case: We see the potential for a bearish reversal from our pivot level at 2607 which is in line with 38.2% Fibonacci retracement and 100% Fibonacci projection towards our 1st support level at 2557 which is in line with 100% Fibonacci projection along with a graphical swing low support. Our bearish bias is further supported by price trading below the Ichimoku cloud indicator.
Alternative scenario: Alternatively, the price might break our pivot structure and head for 1st resistance level at 2645 in line with 61.8% Fibonacci retracement.
Fundamentals: No major news.

Corn Futures (ZC1! ), H1 Potential for Bearish MomentumType: Bearish Momentum
Resistance: 814'4
Pivot: 807'4
Support: 795'4
Preferred case: We see the potential for a bearish dip from our pivot level at 807'4 in line with 38.2% Fibonacci retracement towards our 1st support level at 795'4 in line with 50% Fibonacci retracement, 61.8% Fibonacci projection and -27.2% Fibonacci expansion.
Alternative scenario: Alternatively, price might break our pivot structure and head for 1st resistance level at 814'4 in line with 78.6% Fibonacci retracement.
Fundamentals: No major news.

WHEAT Will Fall! Sell!
Hello,Traders!
WHEAT is retesting a horizontal level
While trading below a rising trend-line
And we are already seeing a bearish reaction
So I think that the price will fall further down
Sell!
Like, comment and subscribe to boost your trading!
See other ideas below too!

Sugar Futures ( SB1!), H1 Potential for Bullish BounceType: Bullish Bounce
Resistance: 20.32
Pivot: 19.96
Support: 19.81
Preferred case: We see the potential for a bounce from our pivot at 19.96 in line with 50% Fibonacci retracement and 61.8% Fibonacci projection towards our 1st resistance at 20.32 along with graphical swing high resistance.
Alternative scenario: Alternatively, the price may break our pivot structure and head for 1st support at 19.81 in line with 61.8% Fibonacci retracement.
Fundamentals: No major news.

Soybean Futures ( ZS1!), H1 Potential for Bullish BounceType: Bullish Bounce
Resistance: 1710'4
Pivot: 1690'6
Support: 1682'2
Preferred case: We see the potential for a bounce from our pivot at 1690'6 in line with 38.2% Fibonacci retracement and 61.8% Fibonacci projection towards our 1st resistance at 1710'4 in line with 100% Fibonacci projection and 161.8% Fibonacci extension.
Alternative scenario: Alternatively, price may break our pivot structure and head for 1st support at 1682'2 in line with 100% Fibonacci extension and 61.8% Fibonacci retracement.
Fundamentals: No major news.

Sugar and FCOJ Take the Bullish BatonThe soft commodities sector of the commodity market can be highly volatile. Historically, sugar, coffee, cotton, cocoa, and frozen concentrated orange juice futures that trade on the Intercontinental Exchange have doubled, tripled, and halved in value over short periods. While clothing and other consumer goods depend on the cotton market, the other sector members are foods.
The soft commodity sector rose in 2021, and Q1 2022
Coffee and cotton rose to multi-year highs in 2022
FCOJ takes off on the upside in April and makes a new multi-year high
Sugar could be next for three reasons
Trading softs from the long side- Buy those dips
Brazil is the world’s leading producer and exporter of three of the soft commodities; sugar, coffee, and oranges. Sugar comes from two sources, sugar beets and sugarcane. Brazil’s tropical climate makes it the leading sugarcane producer. Arabica coffee beans are popular in the US and other areas, while Robusta beans produce espresso coffees. Brazil leads the world in Arabica production. While many people associate orange production with Florida and California, Brazil is the world’s top orange producer. Cocoa, the primary ingredient in chocolate confectionery products, comes mainly from West Africa, as the Ivory Coast and Ghana produce over 60% of the world’s annual supplies.
Soft commodities are agricultural products, so the weather in growing areas typically determines the prices each year. Since the 2020 pandemic, the price action has been anything but ordinary.
The two latest soft commodities to lead the sector on the upside have been sugar and FCOJ futures.
The soft commodity sector rose in 2021, and Q1 2022
In 2021, the composite of the five soft commodities that trade in the futures markets on the Intercontinental Exchange rose 31.57%. In Q1 2022, the softs added to gains, rising 6.58%, with all five members posting gains.
Cotton futures led the softs higher with a 20.51% gain. Cocoa futures moved 5.16% to the upside, with FCOJ posting a 3.86% gain. Sugar rallied 3.23%, and Arabica coffee futures eked out a 0.13% gain.
Meanwhile, coffee and cotton rose to new multi-year highs during the first three months of 2022.
Coffee and cotton rose to multi-year highs in 2022
In June 2020, coffee futures made a higher low under the $1 per pound level before taking off on the upside.
The weekly chart shows the bullish trend of higher lows and higher highs that took coffee futures to $2.6045 per pound in early February 2022. Coffee futures rose to the highest price since 2011.
Cotton futures also rose to the highest level since 2011, peaking at the $1.4614 per pound level in April 2022.
Coffee futures were over the $2.20 level, with cotton above $1.40 on April 14.
FCOJ takes off on the upside in April and makes a new multi-year high
Frozen concentrated orange juice futures are the least liquid of the five soft commodities, based on daily volume and open interest metrics. While the FCOJ futures arena rose to a new multi-year high in Q1 2022, the bullish price action continued in April with higher highs.
The chart shows that nearby FCOJ futures rose to $1.8660 per pound last week, the highest level since March 2017. The all-time high in the orange juice market came in 2016 at $2.35 per pound.
Brazil is the leading producer and exporter of oranges and Arabica coffee beans. The South American country also is the leader in free-market sugarcane production and exports.
Sugar could be next for three reasons
Sugar futures rose to 20.69 cents per pound in November 2021, the highest price since February 2017.
The weekly chart shows that sugar futures were above the 20 cents per pound level last week. Sugar is approaching the first technical resistance level at the November 2021 20.69 cents high. Above there, the next target is at the October 2016 23.90 high, which is a technical gateway to the 2011 36.08 cents per pound peak.
Three factors support sugar prices in April 2022:
Rising inflation is lifting all commodity prices, and the trend is always your best friend in markets across all asset classes.
Rising crude oil and natural gas prices support sugar. Crude oil is over the $100 per barrel level, and natural gas stopped just short of $7 per MMBtu last week. Multi-year highs in the energy market support sugar as it is the primary input in Brazilian ethanol production. As more sugarcane goes into ethanol production, less is available for exports.
Sugarcane production costs are increasing as they are labor-intensive. The rising Brazilian real makes sugar more expensive to produce.
The chart illustrates the technical breakout to the upside in the Brazilian currency against the US dollar. A higher real increases the cost of production, putting upside pressure on sugar’s price.
Trading softs from the long side- Buy those dips
Stocks and bonds have been shaky in 2022, and cryptocurrencies have not yet of the slump that took prices lower since the November 2021 highs. Commodities have been the place to be for investors and traders over the first four months of 2022. The latest inflation report will likely keep the bullish party in raw material markets going.
I remain bullish on soft commodities as they are highly volatile and can offer explosive returns. Sugar is my top choice as of April 15, as the sweet commodity loosed poised to eclipse the 2021 high on its way to higher ground. Meanwhile, I favor all soft commodities in the current environment. The optimal approach to the sector has been buying on price weakness, and I expect that to continue. Bull markets rarely move in straight lines, and corrections can be the best route to optimizing returns over the coming weeks and months.
--
Trading advice given in this communication, if any, is based on information taken from trades and statistical services and other sources that we believe are reliable. The author does not guarantee that such information is accurate or complete and it should not be relied upon as such. Trading advice reflects the author’s good faith judgment at a specific time and is subject to change without notice. There is no guarantee that the advice the author provides will result in profitable trades. There is risk of loss in all futures and options trading. Any investment involves substantial risks, including, but not limited to, pricing volatility, inadequate liquidity, and the potential complete loss of principal. This article does not in any way constitute an offer or solicitation of an offer to buy or sell any investment, security, or commodity discussed herein, or any security in any jurisdiction in which such an offer would be unlawful under the securities laws of such jurisdiction.

ZW2! update -18/04/2022expecting a strong move near 1400 to complete wave (5), next key level to note at 1139.6, critical support at 967.2

Corn Futures Consolidating after S/R Flip$CORN $ZC1! futures currently consolidating above previous resistance turned support. Bull flag setup from a TA perspective. Will long closer to support for another leg up.

Coffee Futures ( KC1!), H1 Potential for Bullish BounceType : Bullish Bounce
Resistance : 227.70
Pivot: 221.75
Support : 219.20
Preferred case: We see the potential for a bounce from our pivot at 221.75 in line with 127.2% Fibonacci extension towards our 1st resistance at 227.70 in line with 38.2% Fibonacci retracement and 61.8% Fibonacci extension.
Alternative scenario: Alternatively, price may break our pivot structure and head for 1st support at 219.20 in line with 138.2% Fibonacci extension.
Fundamentals: No major news.

EXTREMELY BULLISH SUGAR Sugar has no place to go but up. Look at my golden lines, replicate them on your chart and go to the monthly timeframe. Look left and see the beauty of multi timeframe analysis.
Anyways, we don't control the market but I remain bullish till the market says otherwise.
What's your own view on sugar???

FOOD CRISIS bad for stocks?There has been a lot of talk since the Ukraine - Russia war started that the rising prices in the agricultural sector will cause a new Bear Cycle in the stock market. Commodities have been rising across the globe as a result of an inflation build up in recent years, accelerated by the COVID pandemic, but with agriculturals in particular, the story is a little different.
This chart illustrates Corn (blue trend-line), Sugar (orange), Soybeans (teal), Oats (black) and in the pane below them is the S&P500 index (green trend-line). As you see, even though price rallies on the agriculturals have caused minor (from a long-term perspective) pull-backs on S&P (as they did in February/ March), they only coincided with a Bear Cycle in the 2007/08 Bear Cycle, which of course was caused by the subprime mortgages.
So the conclusion we can draw is that global indices' reaction in February/ March with a strong pull-back, was very natural based on the long-term historic action. A Bear Cycle has to have a strongest macro-economic catalyst, strong enough to affect the fundamental structures of the capitalistic/ monetary system that supports the stock markets.
--------------------------------------------------------------------------------------------------------
Please like, subscribe and share your ideas and charts with the community!
--------------------------------------------------------------------------------------------------------
