US Oil ThesisFundamentally, oil can only go up. Since Russia is requiring countries to purchase oil using rubles, supply will go down due to current sanctions. With steadily increasing demand and decreasing supply, prices must increase. I think $200 is a realistic target for the coming year.
Agricultural Commodities

Sugar Long - SBK22Buy Signal
Entry - 19.06
TP#1 - 19.86
TP#2 - 20.23
SL - 18.44
**Trading commodity futures and options involves substantial risk of loss.
The recommendations contained in this letter is of opinion only and
does not guarantee any profits. These are risky markets and only
risk capital should be used. Past performance is not indicative of future results**

LEM22(June Live Cattle) Short SignalShort Signal
Entry LMT - 135.350
TP#1 - 131.600
SL - 138.600
**Trading commodity futures and options involves substantial risk of loss.
The recommendations contained in this letter is of opinion only and
does not guarantee any profits. These are risky markets and only
risk capital should be used. Past performance is not indicative of future results**

Apr 5, 22 Wheat Go Long My FriendsI've been watching whaet for a while now waiting for a bottom. Hopefully last week was the bottom. I put a Buy Order in at 1000 on Friday and wheat is slowly moving up.
With the war and drought going on, spring planting is screwed in Ukraine and Russia which account for about 25% of the worlds wheat.
I'm in this one for the long haul - hoping wheat will keep going up to 1300, maybe higher once the world realizes there is going to be a massive shortage.
Stay safe.
Heiko

COFFEE KC Supply And Demand AnalysisSee the picture for analysis.
-bullish commodities.
-4hr uptrend
-Price inside 4hr demand
-Looking for lower timeframe confirmation setups.

Sugar Futures (SB1! ), H1 Potential for Bearish DipType : Bearish Reversal
Resistance: 20.69
Pivot: 20.41
Support : 19.86
Preferred case: We see the potential for a bearish dip from our pivot at 20.41 in line with 138.2% Fibonacci extension towards our 1st support at 19.86 in line with 38.2% Fibonacci retracement and 78.6% Fibonacci projection. Our bearish bias is supported by stochastic indicator where price is trading near resistance level.
Alternative scenario: Alternatively, price may break our pivot structure and head for 1st resistance at 20.69 in line with 161.8% Fibonacci extension.
Fundamentals: No major news

Lean Hogs With Oil Futures CorrelationsLean Hog has a gap below that has me intrigued but I am not sure how or if it will fill. I will also note this interesting but obvious correlation that I found with oil. We have some interesting inverse correlations on 2/18, 3/17, 3/25 among other days but otherwise similar chart patterns between the two. I am not sure how or why lean hogs front ran the oil pump 2/14 - 2/25 I would be curious to anyone's thoughts on this. Just general observations from a neutral stance.

Corn Futures ( ZC1! ), H1 Potential for Bearish ReversalType : Bearish Reversal
Resistance: 778'0
Pivot: 772'6
Support : 762'0
Preferred case: We see the potential for a bearish reversal from our pivot at 772'6 in line with 61.8% Fibonacci retracement towards our 1st support at 762'0 in line with 78.6% Fibonacci retracement and 100% Fibonacci projection. Our bearish bias is supported by the stochastic indicator where price is trading at resistance level.
Alternative scenario: Alternatively, price may break our pivot structure and head for 1st resistance at 778'0 in line with 61.8% Fibonacci projection and 161.8% Fibonacci extension.
Fundamentals: No major news

Profiting From Higher Food Prices and Shortages in 2022March comes in like a lion and goes out like a lamb, and April showers bring May flowers. In the northern hemisphere, farmers are now planting the crops that will feed the world after the fall harvest season. Mother Nature is typically the primary determinate of agricultural products as the weather conditions determine if there will be enough supplies to feed the ever-growing global population. As the world addresses climate change, corn and soybeans requirements for biofuel have put additional upside pressure on prices over the past years. Moreover, rising inflation has increased production costs. The war in Ukraine presents a unique set of concerns for the products that provide nutrition and fuel.
Grains and oilseeds are going into the 2022 US crop year at very high prices
The weather is secondary as the war in Ukraine threatens supplies
Higher prices in the US- The potential for famine in other regions
Food shortages lead to political change
Beans above the teens, corn in the double digits, and wheat explosions could be on the horizon in 2022 and beyond
In 2021, a composite of grain, oilseed, and other leading agricultural products rose 29.71%. In Q1 2022, the composite moved another 18.89% higher. Corn, soybean, and wheat prices are sky-high in early April 2022 as the seeds go into the ground, and the prospects for even higher prices are rising each day.
Grains and oilseeds are going into the 2022 US crop year at very high prices
Nearby May CBOT corn futures settled at $7.4875 on March 31, up 26.21% in Q1.
The chart shows corn’s price was higher on April 8 at the $7.6875 per bushel level. Corn’s all-time high was in 2012 at $8.4375, and the coarse grain reached $8 in March before correcting.
Nearby CBOT soybean futures settled at $16.18250 per bushel on March 31, posting a 21.79% gain in Q1 2022.
Soybean futures were higher at around the $16.89 level on April 8 after reaching a high of $17.65 in February 2022. In 2012, the beans reached a record high of $17.9475 per bushel.
CBOT soft red winter wheat is the most liquid wheat futures contract and a global price benchmark. The CBOT wheat rallied 20.34% in 2021 and was 30.52% higher in Q1 2022.
The CBOT wheat settled at $10.06 per bushel on March 31 and was at over the $10.50 level on April 8. The wheat futures rose to a high of $13.40 in May, eclipsing the 2008 $13.3450 per bushel record peak.
As the seeds go into the ground in the US and other growing regions in the northern hemisphere, prices are at multi-year highs and not far from record levels.
The weather is secondary as the war in Ukraine threatens supplies
The weather typically causes price volatility during the annual planting and growing seasons. However, 2022 is anything but a typical year. Rising inflation has caused input prices to soar, pushing land values, rents, financing costs, energy, labor, equipment, seed, and other expenses higher. Moreover, Russia’s invasion of Ukraine has transformed Europe’s breadbasket into mine and battlefields. Russia and Ukraine export one-third of the world’s annual wheat requirements and substantial amounts of corn, barley, and other agricultural products. The Black Sea ports, a critical logistical hub in the region, is a war zone. Meanwhile, Russia retaliated against sanctions by “temporarily” banning fertilizer exports, sending prices higher, and limiting availabilities. The lack of fertilizers will translate to lower global crop yields.
In April 2022, the weather is secondary to the geopolitical landscape for the commodities that feed the world.
Higher prices in the US- The potential for famine in other regions
In the US, consumers will pay much higher prices for food in the coming months and years. However, as a world-leading agricultural producer, the US food supply is likely to fulfill domestic requirements, barring any catastrophic weather events. Other regions worldwide could face food shortages leading to famine.
In a sign that Russia may cut off agricultural exports, Russian President Vladimir Putin said that the West’s sanctions would make Russia keep a close eye on its food exports to hostile countries. The Russian leader said, “They will inevitably exacerbate food shortages in the poorest regions of the world, spur new waves of migration, and in general drive food prices even higher.”
Even if Russia continues to export to some countries, the production loss caused by the war looks likely to be substantial.
Food shortages lead to political change
When governments cannot feed people, revolutions tend to follow. The French Revolution that cost the last French Queen’s head began as bread riots in Paris. More recently, the 2010 Arab Spring came two years after wheat reached its previous record high. Bread riots in Tunisia and Egypt caused by rising prices and falling availability caused the sweeping political change in North Africa and the Middle East.
Inflation, the war in Ukraine, and sanctions on Russia will have severe ramifications for supplies over the coming years. Feeding people is a government’s primary task, and hungry citizens quickly lose patience with their leaders.
Beans above the teens, corn in the double digits, and wheat explosions could be on the horizon in 2022 and beyond
Soybean futures first traded in the teens in 2008. In 1973, the oilseed futures reached a high of $12.90 per bushel, beginning the chant of “beans in the teens” from those bullish on the oilseed. While it took three and one-half decades for beans to trade in the teens, the next time they move out of the teens could be on the upside at prices above the $20 per bushel level.
Corn has never traded above $8.50 per bushel, but it could head for over $10 in the current environment. CBOT wheat already reached a record high in March 2022, and higher highs could be on the horizon over the coming months and years.
While the weather is secondary for the 2022 crop year, a drought, flood, or other weather events that impact the growing season and weigh on supplies could make matters worse. Anything short of a bumper crop from the US and other growing regions away from Europe’s breadbasket could be disastrous for prices and availabilities.
The bull market that took the grain sector 29.71% higher in 2021 and 18.89% higher in Q1 2022 looks set to continue. The current environment limits the downside while the upside remains explosive. Risk-reward favors the upside in the commodities that feed and increasingly fuel the world.
--
Trading advice given in this communication, if any, is based on information taken from trades and statistical services and other sources that we believe are reliable. The author does not guarantee that such information is accurate or complete and it should not be relied upon as such. Trading advice reflects the author’s good faith judgment at a specific time and is subject to change without notice. There is no guarantee that the advice the author provides will result in profitable trades. There is risk of loss in all futures and options trading. Any investment involves substantial risks, including, but not limited to, pricing volatility , inadequate liquidity, and the potential complete loss of principal. This article does not in any way constitute an offer or solicitation of an offer to buy or sell any investment, security, or commodity discussed herein, or any security in any jurisdiction in which such an offer would be unlawful under the securities laws of such jurisdiction.

Sugar Futures ( SB1! ), H1 Potential for Bearish DipType : Bearish Dip
Resistance: 20.69
Pivot: 20.36
Support :19.86
Preferred case: We see the potential for a bearish dip from our pivot at 20.36 in line with Fibonacci extension towards our 1st support at 19.86 in line with 38.2% Fibonacci retracement and 78.6% Fibonacci projection. Our bearish bias is supported by the stochastic indicator where price is trading at resistance level.
Alternative scenario: Alternatively, price may break our pivot structure and head for 1st resistance at 20.69 in line with 161.8% Fibonacci extension.
Fundamentals: No major news


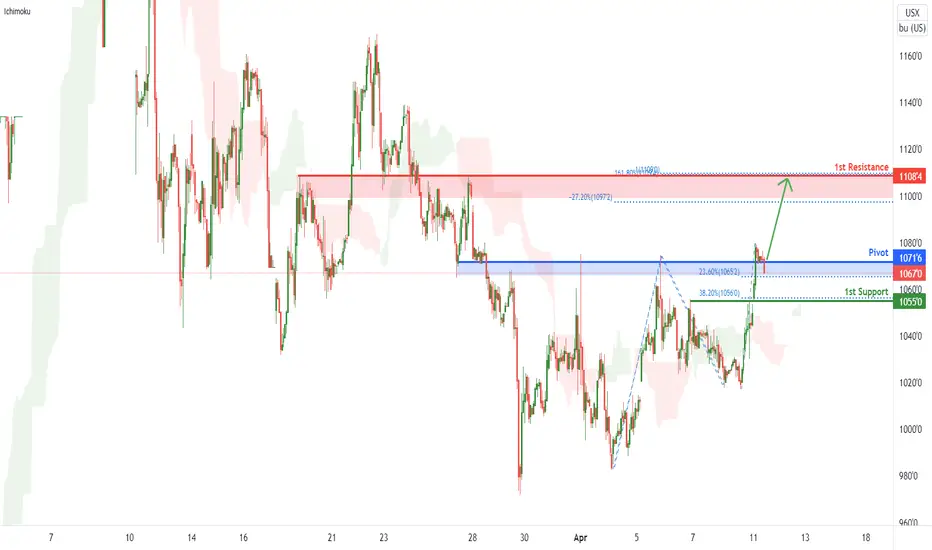
Wheat Futures ( ZW1! ), H1 Bullish Bounce!Title: Wheat Futures ( ZW1! ), H1 Bullish Bounce!
Type : Bullish bounce
Resistance : 1108'4
Pivot: 1071'6
Support : 1055'0
Preferred Case: Prices are at a pivot. We see the potential for a bounce from our pivot at 1071'6 in line with 23.6% Fibonacci Retracement towards our 1st resistance at 1108'4 which is an area of Fibonacci confluences. Prices are trading above our ichimoku clouds, further supporting our bullish bias.
Alternative scenario: Price might continue to dip towards the 1st support level of 1055'0 in line with 38.2% Fibonacci retracement.
Fundamentals: No Major News
Soybean Oil Futures (ZL1!), H1 Potential for Bullish rise!Type: Bullish rise
Resistance : 76.62
Pivot: 73.05
Support : 71.50
Preferred case: With price moving above the ichimoku cloud, we have a bullish bias that price will rise to our 1st resistance in line with the 76.62 in line with the swing high resistance from our pivot of 73.05 in line with the 38.2% Fibonacci retracement and the horizontal overlap support.
Alternative scenario: Alternatively, price may break pivot structure and head for 1st support at 71.50 in line with the 61.8% Fibonacci retracement and the horizontal swing low support.
Fundamentals: No major news.

Soybean Futures (ZS1!), H1 Potential for Bullish rise!Type: Bullish rise
Resistance : 1693'6
Pivot: 1681'4
Support : 1666'0
Preferred case: With price moving above the ichimoku cloud, we have a bullish bias that price will rise to our 1st resistance in line with the 1693'6 in line with the swing high resistance from our pivot of 1681'4 in line with the 23.6% Fibonacci retracement and the horizontal pullback support.
Alternative scenario: Alternatively, price may break pivot structure and head for 1st support at 1666'0 in line with the 38.2% Fibonacci extension and the horizontal pullback support.
Fundamentals: No major news.


SEB teasing a breakoutFundamentals: ~1mil shares, new $2.25 dividend, EPS over $103
Technicals: retesting high tested multiple times before.

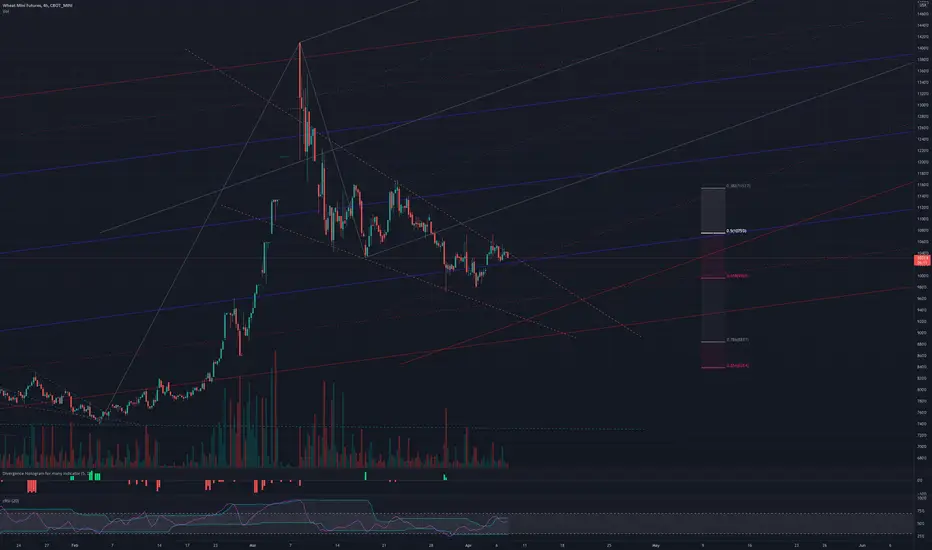
Waiting game on wheatConsolidation in price could lead to another strong move to the upside. Finding support near a lower medium line and inner warning line on two schiff pitchforks. Retracement from the high at 62%, but need to wait for confirmation of upward move.
$SBUX Key Levels, Analysis, & Targets$SBUX Key Levels, Analysis, & Targets
So I do think that here I’m going to start with target 2 - but target 1 might catch it. I’m still aiming for 2.
Swing setup
1 at 79.11
1 at 71.06
2 at 60.85
4 at 50.02
(Then multiply by your multiplier (x5, x10, x100, x1000, etc to find your position size)
---
I am not your financial advisor. Watch my setups first before you jump in… My trade set ups work very well and they are for my personal reference and if you decide to trade them you do so at your own risk. I will gladly answer questions to the best of my knowledge but ultimately the risk is on you. I will update targets as needed.
GL and happy trading.
IF you need anything analyzed Technically just comment with the Ticker and I’ll do it as soon as possible…

Long on sugarLook for this to move higher shortly or will it correct some more? I think we have another wave (V) up to complete this wave. But there is some bearish divergence building up on the RSI
So I think there is another corrective wave (C) down to form a running or expanding flat

Long on sugar, small correction then upSitting through a small correction on Sugar (hopefully) this may go down to the upper medium line to hit support and then start a Wave V to the upside to target the outer warning line of the pitchfork. This is inline with a previous high which may form resistance.

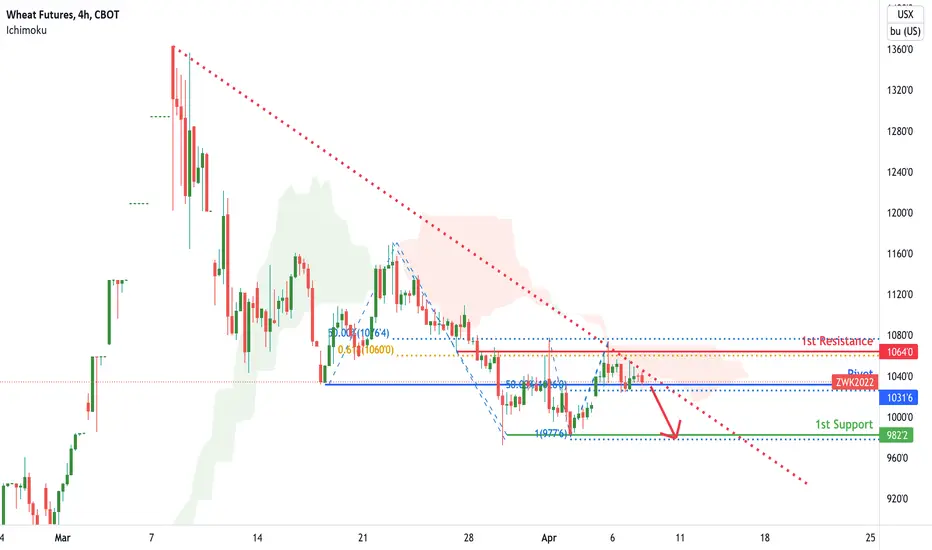
Wheat futures are momentum! | 7th April 2022Title: Wheat Futures (ZW1!), H4 Bearish Dip
Type : Bearish Dip
Resistance : 1064'0
Pivot: 1031'6
Support : 982'2
Preferred Case: Prices are on bearish momentum and abiding by a descending trendline We see the potential for a dip from our Pivot at 1031'6 in line with 50% Fibonacci Retracement towards our 1st support at 982'0 in line with 100% Fibonacci Projection . Prices are trading below our ichimoku cloud resistance, further supporting our bearish bias.
Alternative scenario: Price might continue to climb towards the 1st resistance level of 1064'0 in line with 50% Fibonacci retracement and 61.8% Fibonacci Projection.
Fundamentals: No Major News
Continuous Corn SpreadsWhen carry out stocks are plentiful and the market structure is more definable, spreads seem easy to manage.
In the current domestic and world market structure of strong demand and less supply, it seems that trying to add value to hedges with capturing carry may be more of a risk play.
It is wise to manage the risks we know and the risks we can.
Carry Spreads have their limits, Inverse markets have no Rules

Continuous Bean SpreadsWhen carry out stocks are plentiful and the market structure is more definable, spreads seem easy to manage.
In the current domestic and world market structure of strong demand and less supply, it seems that trying to add value to hedges with capturing carry may be more of a risk play.
It is wise to manage the risks we know and the risks we can.
Carry Spreads have their limits, Inverse markets have no Rules
