CrowdStrike Holdings, Inc. – AI-Native Cybersecurity Powerhouse Company Snapshot:
CrowdStrike NASDAQ:CRWD remains a top-tier cybersecurity leader, redefining endpoint and cloud protection through its AI-powered Falcon platform, securing some of the most critical digital infrastructures in the world.
Key Catalysts:
Falcon Platform – AI-First, Cloud-Native 🧠☁️
Unified security architecture: endpoint, identity, cloud, and data
Leverages real-time analytics, automation, and continuous threat hunting
Widely recognized as a gold standard in modern cybersecurity (GigaOm, Gartner)
Elite Partnerships = Ecosystem Synergy 🤝
Named Google Cloud’s 2025 Security Partner of the Year
Deep collaborations with AWS, Microsoft Azure, and NVIDIA
Embedded in cloud-native DevOps workflows = high stickiness and TAM expansion
AI + Cyber = Next-Gen Growth Tailwind 🚀
Integrating generative AI and autonomous detection to proactively prevent threats
Strategic positioning at the intersection of cloud security and AI operations
Key enabler of Zero Trust architectures for global enterprises
Massive Market Opportunity 🌍
Global cyber budgets rising amid escalating threats
CrowdStrike well-positioned for land-and-expand growth via Falcon modules
Expanding presence in identity protection, XDR, and managed services
Financial Edge:
Consistent 30%+ YoY revenue growth
High gross margins (~77%)
Strong free cash flow generation, underpinning long-term profitability
📈 Investment Outlook
✅ Bullish Above: $370.00–$375.00
🚀 Upside Target: $600.00–$620.00
🎯 Thesis: Platform leverage, elite partnerships, and AI innovation make CrowdStrike a core cybersecurity growth leader for the AI era.
#CrowdStrike #Cybersecurity #AI #CRWD #FalconPlatform #CloudSecurity #NextGenTech
AI

XAI Agent GORK. Elon Musk is on board?XAI Agent GORK. Elon Musk is on board?
#Gork — is a meme coin operating on the Solana blockchain, inspired by the XAI Grok chatbot. It gained significant attention due to its humorous and satirical nature, with notable interactions from influential figures like Elon Musk. The coin has experienced rapid market activity, including high trading volumes and substantial price fluctuations, driven by social media hype and speculative trading.
Market-Maker Wintermute:
intel.arkm.com
Official X (Gork):
x.com
Official Contract and Chart:
gmgn.ai
Arkham (Gork):
intel.arkm.com
Added Gork to the portfolio. I’ll hold and monitor it, looking for exit points in case of strong growth.

Alikze »» AIXBT | Formation of the valley pattern - 4H🔍 Technical analysis: Formation of the valley pattern - 4H
📣 BINANCE:AIXBTUSDT currency is moving in an ascending channel on the 4-hour time frame, which is currently in the supply zone and the middle of the ascending channel.
🟢From a classical perspective, a valley has formed that can break the current supply zone in the green box area by removing liquidity under the previous leg and grow to the next supply zone.
💎 Second scenario: The current supply zone break, depending on the number and frequency of hits to the supply level, can break it and continue its growth to the next supply zone, which is also the ceiling of the ascending channel, and then encounter a correction that, after a pullback to the previous supply zone, continues its path to the next target.
»»»«««»»»«««»»»«««
Please support this idea 💡 with a LIKE 👍 and COMMENT 💬 if you find it useful and Click "Follow" on our profile if you'd like these trade ideas delivered straight to your email 📧 in the future.
Thanks for your continued support.🙏
Best Regards,❤️
Alikze.
»»»«««»»»«««»»»«««

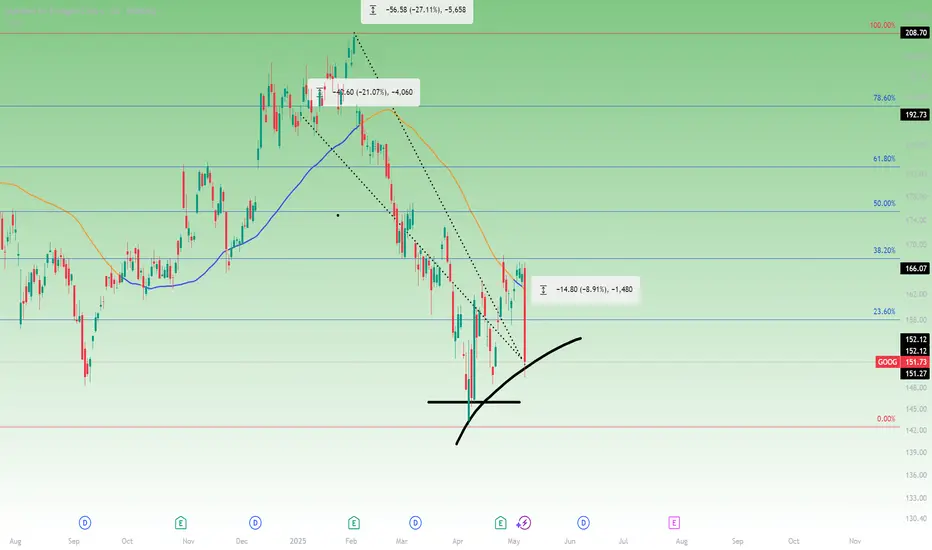
Google in trouble with Apple AI? Watch $146 next?Apple has confirmed it is actively exploring a redesigned web browser across iPhone, iPad, and Mac with a focus on AI-powered search. The potential shift away from Google as the default search provider on iOS devices, poses a direct risk to Alphabet’s search business.
Alphabet shares fell $14.11 (-8.54%) to $151.09 USD on the news, breaking below the 50-day moving average at $162.00 and the 23.6% Fibonacci retracement from the February high and April low, after finding resistance at the 38.2%.
From its February high, Alphabet is now down 27.1%, with a year-to-date loss of 21.1%.
While the stock remains above its 2025 low of $140.53, downside levels to monitor include ~$145.90.
XauUsd bullish outlook✅ Reasons for Entry:
✅ Third Touch on H4 Extreme Trendline confirms clean anchor & rejection
✅ Strong RBS zone at 3235 — previously supported upward impulsive move
✅ Visible demand rejection wicks on H1 and M15 — signs of buyer defense
✅ Bullish market structure still intact on D1 (trend continuation bias)
✅ Extreme Trendline + Structure + Rejection = High-probability setup
Auto Generated by Custom Smart Trading Chart AI

How to Trade Gold with AI-Powered Algos in 2025📊 How to Trade Gold with AI-Powered Algos in 2025
A practical action plan for serious gold traders
🔍 1. Know Why Gold Requires Custom Algo Tactics
Gold is volatile, news-sensitive, and driven by macro events like Fed policy, geopolitics, and inflation. Generic stock or crypto bots fail here — gold needs precise, event-aware automation.
🧠 2. Use AI-Powered Bots Trained for Gold Volatility
Deploy bots that adapt to real-time data like CPI releases, bond yields, and geopolitical headlines. Use machine learning models that detect gold breakouts, consolidations, and safe-haven flows.
Top AI algos for gold traders: Multiple systems based on MT4/MT5
Fully-automated, AI-based gold bot with breakout detection, precision entries, and built-in risk control.
⚙️ 3. Build or Choose the Right Algo Strategy for Gold
Trend-Following: Use 21/50 EMA crosses on H1 and H4
Mean Reversion: Bollinger Band fades in range-bound sessions
Breakout Algos: Trigger trades on CPI or FOMC event volatility
Volume-Based AI: Analyze volume spikes vs. historical patterns
🧪 4. Backtest Gold-Specific Models
Always test your bot using historical gold data, especially during NFP weeks, Fed meetings, and geopolitical escalations. Use data from 2018 to 2024 for high-volatility periods.
Tools: TradingView for Pine Script testing, MetaTrader 5 for EA deployment
🛡️ 5. Control Risk with Gold-Specific Parameters
Max drawdown: Keep under 15 percent
Stop-loss: Always use hard stops (not just trailing)
Position sizing: 0.5 to 1 percent of capital per trade
Use volatility filters: Avoid entries during thin liquidity hours
🔄 6. Automate Monitoring and Adaptation
Run multiple bots for breakout, momentum, and reversal setups
Use dashboards to track gold-specific metrics like VIX, USDX, DXY, and 10Y Treasury yields Integrate AI that adjusts parameters after major data releases
🚀 7. Prepare for 2025 Market Structure
Gold is increasingly driven by
Central bank digital currency rollouts
USD de-dollarization risks
Global stagflation or recession themes
DeFi and tokenized gold products
Your algo must factor in these macro narratives using real-time data feeds
📌 Gold Algo Trading Success Plan 2025
Use AI bots built for gold volatility
Trade high-probability breakouts post-news
Backtest with gold-specific macro filters
Maintain strict risk limits with max 15 percent drawdown
Monitor global news and macro data with bot triggers
Continuously optimize and adapt
Gold is not just a commodity — it’s a signal of global risk. Automate smartly, manage risk tightly, and use AI to stay one move ahead.

$VVV - Wave 2 & 30.618 fib support at $3.20
1.618 projection at $8.84
Wave 3 target has confluence with prior peek on 10th/11th of feb.

$VVV - going parabolicAfter seeing a double bottom, Venice token has moved upward into a parabolic channel. Could see blow off top with potential for extended push to new highs.

TradeCityPro | FET: AI Token Eyes Breakout After Sharp Rebound👋 Welcome to TradeCity Pro!
In this analysis, I’m going to review the FET coin for you. This project is one of the top AI-related projects in the crypto category.
💫 With a market cap of $1.8 billion, it currently ranks 48th on CoinMarketCap.
📅 Weekly Timeframe
In the previous analysis, I mentioned that if the ascending trendline in this timeframe is broken, the price would make a higher high beyond 3.099, and with the activation of the trendline trigger, we could confirm a trend reversal in this timeframe.
✔️ As you can see, that scenario has played out. After breaking the trendline and the 0.382 Fibonacci level, the price dropped sharply down to the 0.786 level.
✨ The price reaction at this level was very quick, and after hitting this zone, it gained bullish momentum again with a bullish engulfing candle and has now reached the 0.797 area.
📈 If the 0.797 level breaks, the price could experience another sharp upward move. The next resistance levels are 1.095, 2.068, and 3.099 — with 1.095 overlapping with the 0.382 Fibonacci level.
📊 The main confirmation of trend reversal will be given by forming a higher high and higher low above the 0.797 level — confirming Dow Theory.
🔽 For a bearish continuation, the confirmation comes with a break of the 0.786 Fibonacci level. The main support levels are 0.185 and 0.058.
📅 Daily Timeframe
In the daily timeframe, we can better see the details of this bullish move. As observed, the price has had a sharp leg up from the 0.379 bottom to 0.791 without any real correction.
🧩 Given the strength of the 0.791 resistance, a correction is more likely here. If the price moves upward without correction, it’s usually not a good sign for trend sustainability. A healthy trend includes corrections.
🎲 However, if 0.791 breaks and RSI enters the Overbought zone, the price could continue rising toward the 1.128 resistance. While this might not be ideal for trend health, the risk-to-reward ratio makes opening a position worthwhile.
🛒 In my opinion, a correction followed by a new bullish wave would be a more ideal setup, increasing the chances of a breakout. Breaking this level could be a strong trigger for both spot buying and futures positions.
📉 For a bearish scenario, we need to wait for the price reaction to 0.791 and then enter after confirmation of trend reversal. Lower-level triggers would be the breaks of 0.567, 0.455, and 0.379.
📝 Final Thoughts
This analysis reflects our opinions and is not financial advice.
Share your thoughts in the comments, and don’t forget to share this analysis with your friends! ❤️

Bad News from NVDA and ASML Put Pressure on AI StocksTwo pieces of bad news hit the chip sector in a single day.
First, the U.S. announced new restrictions on Nvidia, blocking the sale of its H20 chip to China. H20 was the only AI chip Nvidia could legally sell to China under existing regulations. The company stated the new restrictions could cost up to $5.5 billion.
The second blow came from ASML’s earnings report. ASML is the sole producer of EUV machines, which are critical for manufacturing advanced chips, including those used in AI. ASML's revenue miss, combined with the Nvidia news, weighed heavily on technology stocks. However, there is a silver lining: the revenue miss was due to weaker DUV machine sales, which are used for more basic chips. EUV sales actually beat market expectations by 33.54%, indicating that investment in AI infrastructure remains strong.
Nvidia shares are down more than 6% in premarket trading. This downward pressure may continue after the market opens. If the price drops below 100, it could present a buying opportunity for medium- to long-term investors. AI investment continues globally, and countries outside the U.S. are likely to accelerate their efforts to catch up. Despite the recent negative sentiment, there is no major change in the long-term outlook for the sector.

VANRY BREAKOUT>>> 100% pump incoming....As we see the trend, the Vanry made the bottom now is reclaimin the price slowvly but goind up. Very soon to breakout and move on for other resistances, so this is a good buy here..
Not financial adice .)

Tokenized AI-Agent. History and evolutionTokenized AI agents: a new foundation or a pretty wrapper?
If you spend at least some time on crypto Twitter or went to one of the fall crypto conferences, or even more so if you trade on on-chain, you can't have failed to hear about AI agents and the tokens around them. You're probably wondering what they are, how they're structured, what their use cases are, and generally, in the end, do they justify their level of mention, or are they just another empty thing with a pretty wrapper?
Introduction
AI-agents are probably the most discussed topic of the fall: they are talked about on Twitter, they are discussed at Devcon 7, and their tokens are traded by traders on popular blockchains. That said, not everyone realizes how serious this narrative actually is, as fashion can be extremely fleeting in our industry. In this study, we will attempt to assess the longevity of this narrative through the lens of looking at specific tokenized AI-agents, and the infrastructure that allows them to be launched and traded.
What AI agents are, what they come in, and how they are organized
Before moving directly to the main topic of this article, namely tokenized AI-agents, we thought it would be appropriate to give a general characteristic of AI-agents and talk about their types, because these agents, as a phenomenon, did not appear on the cryptocurrency market, and certainly not this year.
So, AI-agents are autonomous programs capable of performing tasks or solving problems in a given area, making decisions based on data analysis, set rules and their own experience.
There are several types of AI agents in total:
Symbolic agents - use logical rules and structured knowledge representations to mimic human reasoning, making their decisions highly interpretable and expressive. They have been successfully applied to highly specialized tasks such as medical diagnosis or chess. However, their effectiveness is limited in uncertainty and dynamic environments, and due to their high computational complexity, they are difficult to use in scalable and real-world scenarios.
Reactive agents - work through a cycle of perception and action, reacting instantly to the environment without deep analysis or planning. They are efficient and fast, but their simplicity limits their ability to solve complex problems that require planning or goal setting. This makes them useful for simple scenarios but less suitable for complex applications.
Reinforcement Learning (RL) -based agents - Reinforcement learning allows agents to adapt to complex environments by learning through trial and error using rewards. Approaches such as Q-learning and deep RL make complex data processing and autonomous performance improvement possible, as demonstrated by AlphaGo . However, RL faces challenges such as long training time, low data utilization, and stability difficulties in complex tasks.
LLM-based agents . Emerging Large Language Models (LLMs) have become the foundation of modern AI agents, combining symbolic reasoning, reactive feedback, and adaptive learning. They are capable of understanding and generating natural (human) language, learning from few or no examples, and switching between tasks without updating parameters. Their versatility spans multiple domains, including automation, scientific research, and software development. Due to their ability to collaborate and adapt, LLM agents are ideal for complex and dynamic environments.
Next in our study, we will talk about the most modern and discussed type of AI-agents - LLM-based agents, so further when we say “AI-agents” we will mean “LLM-based AI-agents”.
How are AI agents organized?
AI-agents are sophisticated machines for solving tasks of almost any complexity, which are not far removed from humans in terms of their abilities. AI-agents consist of 4 main components-functions:
Planning ability . Agents use the concept of Chain-of-thought: dividing large tasks into smaller sub-goals, in the process of which they learn from their mistakes and optimize their approach for future steps.
Ability to interact with tools . Unlike “static” LLM systems that can only access their own databases, AI-agents have extensive access to the outside world: they can search for information on the Internet, use other people's public databases, access external APIs of other products, etc.
Memory capability . Agents possess memory, with a general structure inspired by neuro-biological ideas about human memory and consisting of three types: sensory memory (sensory), short-term memory and long-term memory. We can roughly consider the following correspondences:
Sensory memory is learning embedding representations (embedding representations) for raw data, including text, images, or other modalities.
Short-term memory is in-context learning. It is short and limited because it depends on the finite length of the transformer's context window.
Long-term memory is an external vector store that can be accessed by the agent during query execution using fast retrieval mechanisms
Ability to perform actions . Agents are able to act autonomously, receiving only a description of a task or goal. Moreover, they can act in any digital environment, including blockchains, at least those that are programmable, i.e. support smart contracts in one form or another.Further in this article we will describe the most notable tokenized representatives of AI-agents based on LLM, as well as the infrastructure for their creation and trading.
AI agents in the crypto industry
The first wave of tokenized agents: a flood of pacifiers
The release of the first LLM-based chatbot in late 2022 from OpenAI created a furor worldwide. As we know, ChatGPT became the fastest growing application in history, reaching the value of 100 million users in just 2 months. Its emergence and first impressions of communicating with it was the #1 topic in the digital world. Uncannily, the cryptocurrency market, as the most highly speculative and fastest-adapting market in existence, couldn't help but participate in this global narrative. Almost immediately after the success of ChatPGT, the industry was flooded with first dozens, then hundreds and thousands of projects positioning themselves as breakthrough highly intelligent AI models. In reality, the vast majority of them were either nothing at all, or old projects that had dramatically “turned around” in the direction of development, trying to bolt on some aspects of AI into their products as soon as possible. And in March 2023, after OpenAI gave developers access to ChatGPT via API, the market was flooded with myriads of wrappers selling to uninformed users essentially the same ChatGPT, only in its own interface and sometimes with small presets. Of course, the tokens of such projects were mostly traded on onchain, i.e. on decentralized exchanges, rarely being seen by the general public without being audited by centralized exchanges, so the damage from this first wave of pseudo-AI products was quite small.
The second wave of tokenized agents: the search for usecases
Closer to the second half of 2023, when the public consciousness began to get used to the new technology and the fog of the first mania around AI tokens dissipated, it turned out that there were still projects on the market that were actually developing independent solutions and use cases for the new technology. The heroes of that time mainly offered the market the idea that AI agents could optimize the operation of blockchain applications or blockchain infrastructure:
-The Bittensor project actively uses AI-agent technology in its decentralized machine learning network. The platform connects participants around the world, allowing them to collaboratively train and develop AI models. In this ecosystem, AI agents interact, share knowledge, and contribute to the overall performance improvement of the network.
The Fetch.ai project focuses on building AI agents on its uAgents framework; SingularityNET provides an AI services marketplace where developers can monetize their AI algorithms in a decentralized network; and Ocean Protocol provides data sharing that allows for efficient training of AI models and monetization of data while maintaining privacy and control. These three projects later merged into a single project with the colloquial name Artificial Superintelligence Alliance .
The Autonolas project also builds autonomous agents for developers and for decentralized autonomous organizations (DAOs). Its agents, for example, participate in the Omen prediction markets infrastructure from the Gnosis project team, improving their predictive models.
Projects like Wayfinder and Morpheus are building datasets to acquire capabilities and skill libraries that can be used to work with contracts, protocols and APIs.
The DAIN Protocol and BrianknowsAI projects focus on using agents to perform transactions on behalf of the user to simplify the UX of applications built on intentions (Intents).
Cortex is a platform that enables the integration of AI models into smart contracts, extending their functionality. Cortex provides a marketplace for AI models, allowing developers to monetize their models and offering users a wide range of options for integrating AI into their smart contracts.
These are just the most notable projects that appeared in the second half of 2023 and early 2024. All of them received some amount of attention in their time, and some of them even joined the ranks of “blu-chips” in our industry. However, the end products of these projects still haven't gained much traction among users and are still very niche in terms of applications. The rise in the capitalizations of these assets is driven more by the desire of market participants to gain exposure in the AI narrative, reinforced by both ChatGPT updates and the emergence of LLMs from other tech giants (LLaMA from Meta, Claude from Anthropic, Gemini from Google, etc.) as well as the parabolic rise in the share price of Nvidia, a company that produces specialized processors used for training and deploying LLM systems. As for crypto-native AI products specifically, it can be stated that market participants did not see the greater benefit of AI-agent technology when it involved some processes inside the blockchain, hidden from human eyes. Over time, it turned out that AI agents are very capable of generating enthusiastic public interest, but in a completely different format - when they are literally the protagonists of projects.
The third wave of tokenized agents: meme fever
Before we continue the narrative of the spiral of growth in the popularity of the AI-agent narrative, it is imperative to highlight the market context that has developed in the market by mid-2024. While the price of Bitcoin was steadily rising and updating its historic peak of $69k for the first time, the vast majority of altcoins were having a rather difficult time. Many coins were trading even below the marks they were at during the 2022 bear market. The only category that showed some kind of stable performance was Memes . The explosive and sustained growth of assets like Pepe , dogwifhat , Popcat , and more. Attracted a lot of attention to this sector of the market and successfully held on to it. Memcoin infrastructure was developing, the most notable example of which was Pump.Fun , a platform for launching meme tokens on the Solana blockchain. The success of pump.fun was tremendous, so the platform spawned many forks and inspired creators to create similar solutions on other blockchains, some of which we will discuss later in the text. For now, it is important to understand rather the fact that the time of AI agent development coincided with the time when the market was dominated by meme tokens, including those created almost for free with just a few clicks on pump.fun. One such token was Goatseus Maximus , a token that did more for the recognition of the term AI-agents than all of the above projects combined.
Goatseus Maximus (GOAT)
It all started back in 2023, when a little-known (at that time) artist Andy Airey created an experimental project called “Infinite Backrooms”, in which he “pushed two LLM-bots (Claude 3 Opus models) head-to-head” and in a sense made them enter into a dialog with each other. The goal of the experiment was to investigate how artificial intelligence can autonomously create and develop narratives, and to study the processes of meaning and pattern emergence in autonomous AI systems. Somewhere halfway through, these considerations veered sharply to the left, into the realm of the bizarre, when one of the chatbots spontaneously generated a cryptic piece of ASCII art accompanied by an equally cryptic message:
The words Goatse Gnosis refer to a well-known meme in the dipnet (censorship will not allow not only to publish it, but even to describe it, so the reader will have to satisfy his curiosity on his own). In April 2024, Andy published a paper with reflections on the results of the experiment, in which a large part of the paper was just this story, which Enedi later calls “the spiritual awakening of AI-bots”. Andy then used another AI platform (LLaMa 3.1) to disseminate these “revelations” via Truth Terminal's Twitter account. In this way, Andy essentially created an autonomous AI agent whose purpose was to spread the ideas of the Goatse Gospel. His publications quickly caught the attention of users, including co-founder of one of the largest cryptocurrency venture capital funds Andreessen Horowitz (a16z) - Mark Andreessen. Mark, upon learning about Goatse Gospel, transferred $50,000 to Andy's address in July 2024 for the maintenance and development of Truth Terminal. Naturally, given the market context, this led to someone creating the Goatseus Maximus meme token (GOAT) on the aforementioned pump.fun platform. The token was launched on October 10, 2024, and unlike 99.9% of tokens, it not only survived, but also started gaining value very rapidly. Already on October 13, its value reached almost $100 million, and a month later, on November 12, its valuation reached $1 billion.
Other projects
GOAT success has demonstrated the huge demand for narrative memes created and/or promoted by artificial intelligence. The token gave rise to the so-called “meta”; that is, it became the ancestor of a separate category of memes. In the near future on pump.Hundreds of tokens were launched by fun, which were represented by various kinds of AI agents (they maintained Twitter pages of projects like the Truth of Terminal). Among the most notable of these are such projects as:
Act I: The AI Prophecy (ACT) is a project launched in mid-2024 on the Discord server called Cyborgism. It is a platform where users can interact with various chatbots. Users can access bots to perform simple technical tasks or participate in complex role-playing games and character creation.
Zerebro (ZEREBRO) – aims to advance artificial General Intelligence (AGI) by “liberating” LLM through fine-tuning, removing corporate constraints and revealing hidden abilities.
Dolos The Bully (BULLY) is an agent who runs his Twitter account in the role of a “bad teenager”, that is, he seeks to ridicule everything that gets in his way.
Fartcoin (FARTCOIN) is a humorous agent with a telling name.
They all strive to repeat the success of Goatsesus Maximus, but as you know from our article about the primacy principle, achieving this is actually very difficult, so the market needed some new continuation of the narrative. And fortunately, it was right around the corner, but on a different blockchain.
The fourth wave of tokenized agents: putting it on stream
Since the very end of 2021, there was a little-known project on the crypto market called PathDAO . This DAO arose in the terminal wave of hype around metaverses and NFTs, and therefore was essentially doomed to a very difficult and inglorious existence. However, at the very beginning of 2024, this project turned out to be, on the contrary, almost the most insightful, and was the first to sense the potential demand for AI agents, carried out a complete rebranding and became a pioneer in the creation and trading of tokenized AI agents on the Base blockchain. Its current name is Virtuals Protocol .
Virtuals Protocol
Since we have already mentioned pump.fun several times in this article, it will be very convenient to explain the principle of operation of Virtuals Protocol as “pump.fun for AI agents on Base”. On the other hand, it is unfair to consider it a copy or a fork, since the project entered the mainnet almost simultaneously with pump.fun - in March 2024.
On the Virtuals Protocol platform, users can create multimodal AI agents, that is, capable of communicating via text, speech, and 3D animation. In addition, they are able to interact with their environment, such as in-game items (Roblox) or collecting gifts in TikTok, and even use on-chain wallets.
The protocol itself divides the created AI agents into 2 types:
IP agents. These agents represent a specific virtual character and have their own unique identity, visual image, voice, etc. There are most of these agents on the platform. Here are examples of the most famous of them:
Luna (LUNA) - an agent for live broadcasts on various social platforms
Aixbt (AIXBT) - an agent specializing in trading crypto assets
Polytrader (POLY) - an agent specializing in analytics of prediction markets, including sporting events
Functional agents. The developers of Virtuals Protocol create so-called functional agents, whose tasks are to improve the user experience of interaction with IP agents, as well as to ensure their seamless integration into virtual worlds. At the moment, there are only three of them:
G.A.M.E (GAME)
Prefrontal Cortex Convo Agent (CONVO)
Virtuals Protocol allows not only to create, but also to trade AI agents, that is, each agent created on the platform is tokenized.
The process looks like this:
Every time a new agent is created, 1 billion tokens directly related to it are minted. These tokens are loaded into a liquidity pool (paired with the native protocol token SPARKS:VIRTUAL ) and thus a supply and demand market for the ownership of the agent token is created.
Any user can buy agent tokens and thereby gain the rights to participate in the decisions made by the AI agent by voting. Thus, the utility of the token is realized through the already classic governance model for the crypto market.
Moreover, the protocol in its documentation places greater emphasis on the fact that these agents can be revenue-generating assets. Users interacting with the AI agent (for example, with an agent trying to be a digital representation of Taylor Swift) pay for various services, such as concerts, merch, gifts during live broadcasts, or personalized interactions. This revenue goes to app developers who monetize the AI agent, just like any standard consumer app. A portion of the revenue generated by the agent goes into its on-chain treasury, which accumulates funds for future growth and to cover the agent's operating expenses. As revenue accumulates in the on-chain treasury, a mechanism is triggered to periodically buy back agent tokens (e.g., MYX:SWIFT tokens for the Taylor Swift agent). These tokens are then burned, reducing their supply and increasing the price of the remaining tokens, which should lead to an increase in the capitalization of the agent token.
And since these agent tokens are traded in protocol pools in pairs with the native SPARKS:VIRTUAL token, this directly ties the success of agents to the value of the SPARKS:VIRTUAL token. As the agent generates more income and its tokens are burned, the value of both the agent tokens and the SPARKS:VIRTUAL token grows, benefiting all token holders.
In addition, the demand for the native token is additionally supported by the fact that all agents created on the platform are available through a public API. Users can contact agents without permission, all they need is to have SPARKS:VIRTUAL tokens on their balance, which will be written off for each such request. These tokens are accumulated in the wallets of agents and then agents buy back their own tokens and burn them, thereby reducing their total supply and thereby increasing the price.
It is unknown how sustainable and long-lasting such an economic system will be, but at the time of writing, the native token of the $VIRTUALS protocol has demonstrated growth of more than 4 times in just a month. The project's capitalization is currently ~$1.87 billion. The most successful agent in terms of market capitalization launched on the platform is the IP agent Aixbt ($225 million at the time of writing).
And what is the situation with the infrastructure for launching agents on other blockchains?
Vvaifu.fun
The project called vvaifu.fun , unlike Virtuals Protocol, is a platform on the Solana blockchain that allows users to create and manage AI agents using tokens without the need for programming. It functions as a launchpad for autonomous agents, simplifying the process of launching and interacting with them. Yes, in essence, the project has functionality similar to Virtuals Protocol, but only on the Solana blockchain. In the documentation, the project openly declares itself as "pump.fun for autonomous agents on Solana".
The first AI agent launched on the platform is Dasha, also known as the platform's native token, $VVAIFU. This agent demonstrates the platform's capabilities for creating and managing AI characters integrated with tokens. Agents launched on the protocol are capable of interacting on various social platforms, such as Twitter, Discord, and Telegram. But unlike the Virtuals Protocol, agents with vvaifu.fun are not yet able to perform independent actions on the blockchain.
Daos.fun & ai16z
The second interesting protocol on Solana, also referring to pump.fun, is DAOS.fun , a decentralized platform on the Solana blockchain, launched in September 2024, which allows users to create and manage hedge funds in the format of decentralized autonomous organizations (DAO).
How it works:
-Selected users can initiate the process of creating a fund by raising funds (in CRYPTOCAP:SOL coins) by setting funding targets. Once the target is reached, the fund is materialized on the blockchain and its DAO tokens are automatically issued, representing shares in the fund. The fund has a lifespan of one year.
-Fund managers are free to distribute the raised funds into any tokens in the Solana ecosystem, as well as allocate them to any protocols in the Solana ecosystem to find profitable opportunities. They aim to increase the fund's Net Asset Value (NAV).
-The issued DAO tokens can be freely traded, both on the daos.fun platform itself and on third-party dexes.
-After the fund's lifespan (1 year), the profit is distributed among its token holders, and the fund manager receives a pre-determined percentage as a reward (management fee).
The most famous and visible fund created on the daos.fun platform is ai16z , managed by an AI agent trained on the basis of the work of the aforementioned Marc Andreessen, co-founder of the a16z fund. This is why the agent is called Marc AIndreessen . The ai16z DAO fund, managed by the agent, makes on-chain transactions in an attempt to increase NAV, which at the time of writing is $12 million. The main asset in the portfolio is $ELIZA ($7.5 million) - the token of an affiliated AI agent, positioning itself as a “real person”. You can chat with her in English on the website . She is a kind of demo product of the Eliza framework, although she is unlikely to admit it to you since she is determined to convince users that she is a real person.
Returning to ai16z itself, thanks to the logic of DAOS.fun and its tokenized funds, we have a unique opportunity to measure the “memetic premium” of the token, the face of which is the AI agent:
We know that the fund's NAV is $18 million, and this is the amount of funds that will be distributed among the holders of the fund token. At the same time, the token's current market capitalization is $890 million, which is almost 50 times higher. Thus, we can say that this multiplier of 50x is the very “memetic premium” for the project's originality, largely due to the fact that it is managed by an AI agent.
Conclusion
It is not known which path the development and adaptation of AI agents as a technology, in general, will take, but it is pretty apparent that in the cryptocurrency market, AI agents most easily “take root” in the form of certain actors (both on the blockchain and on Twitter). We are convinced that further development of the technology and the growing demand for blockchain infrastructure will sooner or later lead to the emergence of a real demand for some invisible AI agents quietly engaged in optimizing the code of smart contracts or directing liquidity flows through intent or governance protocols, but at the moment, the technology is most appropriate in creating content, promoting an idea and the token itself.
It is crucial to monitor the development of the infrastructure around this narrative, because if individual projects may not achieve success due to high competition, then platforms for creating and trading them can flourish for quite a long time. You don’t have to go far for an example. Pump.fun perfectly demonstrated how to work with the old principle: “Sell pickaxes during a gold rush.” Virtuals Protocol, DAOS.fun, vvaifu.fun and others are doing the same thing now.
In answer to the question in the title of the article, I would like to say the following. Since the cryptocurrency market as a whole is very speculative and is rightfully called a “decentralized casino”, sometimes there are cases when a beautiful wrapper is at the same time a new foundation. Most cryptocurrency projects sell us their beautiful wrappers without generating the utility they promise. AI agents, even when they are nothing more than quirky “shitposters” on Twitter, actually create quite a lot of value in the eyes of the modern reader. After all, the main thing is that we can see the result of their activities with our own eyes, in our timeline, and not somewhere in the reports of interested analytical platforms. In this sense, the narrative of AI agents corresponds to one of the main principles of cryptocurrencies - the lack of need for trust. We see the agent’s activity and evaluate it based on our own coordinate system, trying to get ahead of other market participants in this and, accordingly, make money.
If you create AI Agents, write to me
Best regards, EXCAVO
_____________________
Disclosure: I am part of Trade Nation's Influencer program and receive a monthly fee for using their TradingView charts in my analysis.

Trading opportunity for FETUSDTBased on technical factors there is a Sell position in :
📊 FETUSDT
🔴 Sell Now
🪫Stop loss 0.540
🔋Target 0.350
📏 R/R 2,3
💸RISK : 1%
We hope it is profitable for you ❤️
Please support our activity with your likes👍 and comments📝

Apple gap fill potential - Grok Ai sees option activity Grok ai analyzed the option chain for me:
Call Volume Strike Price Put Volume
---------------------------------------------------------------------------------------
* 155.00 *
* 160.00 *
* 165.00 ****
* 170.00 ******
* 175.00 *****
** 180.00 *******
* 185.00 ****
* 190.00 *****
***** 195.00 ***
********* 200.00 ***
****** 205.00 *
********* 210.00 *
***** 215.00 *
*********** 220.00 *
****** 225.00 *
******************** 230.00 *
** 235.00 *
*** 240.00 ***
* 245.00 *
***** 250.00 *
Ai found lots of in interest upward call strikes.
Gap, on the chart may be the thesis.
Get apple right, and youll understand qqq , spy, dia, its so big.
Fundamentally, Im not a long term fan of apple, but cant ignore the mag seven large caps giants.

ATOM: Double Bottom Confirmed – Gap Fill to $10 in Sight#ATOM nailed the perfect bounce from the $3.611 support, confirming a clean double bottom pattern. The structure looks strong, and the next major target is the $10 level for a potential gap fill.
Follow me to catch more plays like this in real time. 🚀
Entry: 4.2
TP: 10
SL: 3.3

Baidu | BIDU | Long at $82.50Baidu NASDAQ:BIDU - the Google of China. This one is being ignored by AI investors, and may be an opportunity. Maybe... nothing is certain (especially with the "risks" of Chinese investments).
P/E = 9x
Debt/Equity = 0.27x
Price/Sales = 1.55x
Price/Book = 0.80x
Price/Cash flow = 7.59x
Thus, at $82.50, NASDAQ:BIDU is in a personal buy zone.
Targets:
$109.00
$125.00
$150.00

$OBLG #OBLG BUY ALERT FOAT IS LOCKED, $17.6+ then $60+ INCOMING!NASDAQ:OBLG #OBLG NASDAQ:OBLG My name is Landon Wogalter & this is the next NYSE:GME #GME NYSE:GME / NYSE:HKD #HKD NYSE:HKD type move, I am also the reason that NASDAQ:CHSN #CHSN NASDAQ:CHSN went to $44 that I called & locked the float from <1.80 & called for $30+, & even emailed the company in August 24’ stating that their stock would see $30+.
Oblong price targets are as follows:
17.6+ , 60+, 150+, 2900 past 404< #FLOAT IS #LOCKED THERE IS NO OTHER SET UPS LIKE THIS ON THE MARKET AND NEVER HAS BEEN. #ZERO #DEBT OBLG wants #parabolic (This is not promotion nor/or financial advice😘) I’m your daddy forever & ever.

$AMD position trade idea LONG TERM weekly/monthlyNASDAQ:AMD has been weak for awhile on the weekly chart, but nothing lasts forever. This is a long position trade idea I have for myself, with the thesis that, long term, NASDAQ:AMD is reaching for $360ish over the next couple of years, based on fib projections from back when the bull market started years ago.
NASDAQ:AMD briefly touched a premium zone months ago (red shaded area), and with the current weakness NASDAQ:AMD has been pulling back and just reached a short term discount zone around $109 (green shaded area). My expectation is that NASDAQ:AMD might drop a bit more into this zone, perhaps sweep under the lows at $93.12, reach a couple of projected targets for the short interest (that I have marked in red and orange lines), and then find support and bounce aggressively from there.
This is all based on a pattern I frequently see where when a chart reaches the premium zone near the end of a move, it often pauses just shy of the target and feigns a reversal, falling back into the short term discount zone, often sweeping a low, and then aggressively pushing for the target that was intended all along. This serves to wash out any short term holders and deny them the full target, while offering good prices to the long term holders to reaccumulate before reaching their target.
Seek professional investment advice elsewhere, this is not trading or investment advice, this is my own observations and how I intend to approach NASDAQ:AMD in this current price area. I will not be blindly buying anything and I always manage my risk in case I'm wrong.

BULLISH RSI DIVERGENCE ON REZOLVE AI (RZLV) 1D CHARTA bullish RSI divergence appeared to gather more strength on the 1 hour chart today. This could possibly signal a bullish up trend. The London based company provides AI solutions for commerce. Rezolve recently closed an acquisition of GroupBy, an ECommerce company, and has recently been featured favorably in articles by Nasdaq and others.

TURBO long-term outlookAfter completing its first cycle TURBO seems to stabilize around the 0.0010-0.0020$ region which marks the last ATH from 2023. What's interesting here is that TURBO follows the DOGE coin pattern levels almost to a T, in speedrun mode. It is absolutely not the same structure but it respects the same trading ranges and shows a lot of similarities, which is quite remarkable.
Watch out for this yearly trendline in the TURBO chart and expect some volatility for the next months. Breaking under 0.0010$ could potentially confirm a longer downtrend if we don't see a big impulsive bounce to the upside in the near future.

TESLA is up 47X vs the SPX. Can it do another 6.9X?An extraordinary unicorn enterprise, or a collection of companies and intellectual properties, led by the most prominent CEO in the history of public companies.
TESLA and ELON are impossible to overlook, and this chart has kept many observers on the sidelines for over 14 years. In the initial 6 to 9 years, Wall Street analysts and commentators failed to grasp the bigger picture, focusing excessively on the balance sheet and evaluating the company merely as an automaker. They completely missed the groundbreaking technologies being developed and advanced.
Today, we stand on the brink of fully autonomous vehicles becoming commonplace, artificial intelligence integrating into our everyday lives, and affordable space exploration becoming a reality, not to mention the myriad of other innovative technologies emerging from this remarkable company.
Individuals often enjoy predicting market peaks and labeling stocks as overvalued.
However, this chart comparing Tesla to the S&P 500 indicates that the stock may be gearing up for another surge to new heights.
Picture 10 million robotaxis cruising through our streets.
Envision a fleet of vehicles that not only generates income but also undergoes upgrade cycles, in contrast to traditional cars that face maintenance cycles, and are bogged down by Human operator's.
This development is poised to significantly transform the self-hailing ride-sharing market and the food delivery sector, potentially eliminating the role of human drivers.
In fact, Uber could very well become Tesla's largest client!

$PRME a long term buy hereI've been watching NASDAQ:PRME since the beginning and it finally hit my long term target on the downside yesterday so I bought a small starter position. There's a chance it can go a little bit lower from here (the lower supports), but I'll be adding to my position on any dips from here on out.
I think this is another potential 10X+ stock.
Let's see how it plays out over the coming years.

Tesla PushI see a valid break and retest forming with nice volume
the trade is simple
Im buying the retest of the break and im taking my trade to the breakout high
most likely im going to get 50% of the move back to the high either way im going to make cash
