PLTR set your alerts and wait!such a neat 2 bottoms, long term downtrend resistance is almost falls in to the same are of the neckline. set the alerts and wait!
AI

Bitcoin weather forecast Cloudy☁️ (Confidence: 0.29 )🌥️ Bitcoin Weather Report 🌥️
As a weatherman in the bitcoin world, I'm here to analyze the current conditions and provide you with an overview. Looking at the past hour's bitcoin chart index, it seems we're in for cloudy weather. ☁️
The bitcoin market has been experiencing some fluctuations, with the opening price at 26,898 and the highest point reaching 26,973. However, the lowest point dipped down to 26,835, indicating some volatility. 📉
The trading volume during this hour was 12,653, suggesting moderate activity in the market. This level of volume can contribute to the uncertainty and potentially impact the weather forecast. 🔄
The closing price stands at 26,950, showing a slight increase from the opening price. However, it's important to consider other indicators to understand the overall market sentiment. 📈
Examining the moving averages, the shorter-term EMAs (9, 21, and 50) are relatively close, ranging between 26,822 and 26,961. These values suggest some stability, but not enough to ensure clear skies ahead. 🌥️
On the other hand, the longer-term EMAs (100 and 200) are at 26,989 and 27,288 respectively. These higher values indicate potential resistance and an uncertain market trend. ⚖️
The relative strength index (RSI) currently stands at 65, suggesting a relatively positive sentiment but not reaching extreme levels. Additionally, the fast_k, slow_k, and slow_d indicators are at 93, 84, and 75, respectively. These values indicate a bullish sentiment but not overwhelmingly so. 📈🚀
Lastly, the Moving Average Convergence Divergence (MACD) is at 6, indicating a slight bullish trend, but the magnitude is not significant enough to counterbalance the cloudy weather forecast. 📉🌥️
Considering all these factors, my confidence in predicting sunny weather in the bitcoin world is 0.29, which falls significantly below the baseline of 0.864. Therefore, I expect cloudy weather ahead with potential volatility in the bitcoin market. ☁️🌧️
Please remember that the cryptocurrency market is highly unpredictable, and it's essential to exercise caution and conduct thorough research before making any investment decisions. 🧐💼

Bitcoin Forecast Cloudy☁️ (Confidence: 0.59 )🌤️ Bitcoin Weather Report 🌧️
In the bitcoin world, the weather forecast for the upcoming period is looking rather cloudy ☁️. After analyzing the past hour's bitcoin chart index, several indicators suggest a potential shift in market conditions.
Looking at the price action, the opening value was at 26,781, reaching a high of 26,813 and a low of 26,750. The closing price settled at 26,802.
Moving averages (EMAs) are important technical indicators. The shorter-term EMAs (9-day and 21-day) crossed above the price, indicating bullish sentiment. However, the longer-term EMAs (50-day, 100-day, and 200-day) are still above the current price, which can be seen as a bearish signal. 📉
The Relative Strength Index (RSI) stands at 56, indicating a moderate bullish momentum, while the fast stochastic K% is at 57 and the slow stochastic K% is at 52, both suggesting a slight bullish bias. However, the slow stochastic D% stands at 59, indicating a potential bearish divergence. ⚖️
Lastly, the Moving Average Convergence Divergence (MACD) is at 184, which implies a bullish trend, but its value should be interpreted within the context of the overall market conditions.
Taking all these indicators into consideration, the confidence level for sunny weather in the bitcoin world is measured at 0.59, which falls below the baseline of 0.864. This suggests that the likelihood of a significant bullish trend is relatively low at the moment.
So, while there are some indications of bullish sentiment in the short term, the overall forecast suggests a cloudy outlook for the bitcoin market. Traders and investors should exercise caution and closely monitor the market for any potential changes in the coming hours. ☁️⚠️

EOS the only real A.I application network? Opinion:
The EOS blockchain is recognized for its scalability and versatility, making it a suitable platform for future AI integration. It allows AI systems to function more efficiently, with greater transparency.
Decentralized AI applications, or DAIs, can be developed on the EOS blockchain. These applications use the blockchain's transparency and immutability to resist manipulation and censorship. They can be used for a variety of purposes, such as improving privacy in AI systems, enabling peer-to-peer AI services, and creating open-source AI models.
For example, a company could use the EOS blockchain to develop a DAI system that provides personalized AI services while ensuring users retain control over their data. This could be applied to personalized advertising, with the EOS blockchain ensuring data security and ad generation transparency.
The EOS blockchain also allows for the development of autonomous economic agents (AEAs) - AI systems capable of independent economic tasks such as buying and selling, contract negotiation, or asset management. One application could be a decentralized autonomous organization (DAO) on the EOS blockchain that manages digital assets based on predefined rules, with all transactions verifiably recorded.
Furthermore, the EOS blockchain can be used to develop AI-powered smart contracts. These self-executing contracts can respond to a wide range of scenarios. An example is a supply chain management contract that uses AI to predict supply and demand trends and adjust strategies accordingly.
In addition to this, the EOS blockchain supports various programming languages, including C#. C# is commonly used in AI and machine learning projects due to its robustness and extensive library support. Developers can use machine learning libraries, such as Accord.NET and CNTK, to implement AI functionalities in EOS-based applications. C# also supports parallel and asynchronous programming, which meets the high-performance computational needs of AI applications on the EOS blockchain.
By integrating C# with the EOS blockchain, developers can create scalable, efficient, and transparent decentralized AI applications. The EOS blockchain's scalability and versatility, combined with its Delegated Proof-of-Stake (DPoS) consensus algorithm, make it suitable for handling large volumes of data and complex computations associated with AI applications.
In summary, the EOS blockchain provides a robust platform for AI applications, from decentralized AI services and autonomous economic agents to AI-powered smart contracts. As AI technology continues to progress, we can expect more AI applications to be developed on the EOS blockchain.
Notes on how I personally use my charts/NFA:
Each level L1-L3 and TP1-TP3 has a deployment percentage. The idea is to flag these levels so I can buy 11% at L1 , 28% at L2 and if L3 deploy 61% of assigned dry powder. The same in reverse goes for TP. TP1: 61%, TP2:28% and TP3:11%. If chart pivots between TP's, in-between or in Between Sell levels these percentages are still respected. I like to use the trading range to accumulate by using this tactic.
Just my personal way of using this. This is not intended or made to constitute any financial advice.
This is not intended or made to constitute any financial advice.
FED Macro Situation Consideration:
All TP's are drawn within the context of a return to FED neutral policy. I do not expect these levels to be reached before tightening is over.
NOT INVESTMENT ADVICE
I am not a financial advisor.
The Content in this TradingView Idea is for informational purposes only, you should not construe any such information or other material as legal, tax, investment, financial, or other advice. Nothing contained within this idea constitutes a solicitation, recommendation, endorsement, or offer to buy or sell any securities or other financial instruments in this or in in any other jurisdiction in which such solicitation or offer would be unlawful under the securities laws of such jurisdiction.
All Content on this idea post is information of a general nature and does not address the circumstances of any particular individual or entity. Nothing in the idea/post constitutes professional and/or financial advice, nor does any information on the idea/post constitute a comprehensive or complete statement of the matters discussed or the law relating thereto. You alone assume the sole responsibility of evaluating the merits and risks associated with the use of any information or other Content on the idea/post before making any decisions based on such information.

Bitcoin: Moment of TruthHello Team,
Bitcoin has currently formed a bearish Head & Shoulders formation. "If" we break this support level with a confirmation candle we can see the price of Bitcoin push lower towards the 20K Support level. if you look to the left side of the chart there is not much support until that level.
We will not enter a trade until there is a confirmation candle as there is still a chance that we will bounce off this support after tomorrow's CPI news.
Play it smart and wait for confirmation. Enjoy!

Bitcoin forecast Sunny🌞 (Confidence: 0.91 )🌞 Bitcoin Weather Report 🌞
The Bitcoin chart index for the past hour shows promising signs, indicating a sunny forecast for the Bitcoin world! ☀️🚀
Let's take a look at the key indicators:
- Open: 27111
- High: 27216
- Low: 27033
- Volume: 27670
- Close: 27166
The Bitcoin market has experienced relatively stable trading activity within this hour, with a slight increase in the high and low values. This suggests a healthy level of interest and participation.
Moving Averages:
- EMA9: 27301
- EMA21: 27429
- EMA50: 27586
- EMA100: 27823
- EMA200: 28083
The exponential moving averages (EMAs) indicate an overall upward trend. The shorter-term EMAs are below the longer-term EMAs, suggesting positive momentum and potential for further growth.
Relative Strength Index (RSI): 36
The RSI measures the strength and speed of price movements. Although it is slightly below the neutral 50 level, it is not indicating any extreme overbought or oversold conditions. This suggests a balanced market sentiment.
Stochastic Oscillator:
- Fast %K: 34
- Slow %K: 31
- Slow %D: 33
The stochastic oscillator values are relatively low but still within a reasonable range. It implies that the market is not overextended and there may be room for further upward movement.
Moving Average Convergence Divergence (MACD): -168
The MACD is currently negative, indicating a bearish signal. However, it's worth noting that the MACD is a lagging indicator and should be considered in conjunction with other indicators for a comprehensive analysis.
Overall, considering the positive movement in the moving averages, the balanced RSI, and the relatively stable trading activity, my confidence in a sunny weather forecast for the Bitcoin world is high! ☀️🚀
Please remember that cryptocurrency markets are highly volatile, and this analysis is based on historical data from the past hour. Market conditions can change rapidly, so it's always important to exercise caution and conduct thorough research before making any investment decisions. Happy trading! 📈💰

AIDoge : Make Money from MEME's 🤖Hi Traders, Investors and Speculators of Charts📈📉
MEXC:AIDOGEUSDT BITGET:AIDOGEUSDT OKX:AIDOGEUSDT.P
Ev here. Been trading crypto since 2017 and later got into stocks. I have 3 board exams on financial markets and studied economics from a top tier university for a year 🏫
AiDoge is a new crypto project that strives to solve the need for exciting memes that drive engagement. As a result, it offers an AI platform that allows users to buy credits with the native crypto, NYSE:AI , and use them to generate memes. By typing prompts into the system, the AI behind it interprets your request and generates an appropriate meme. With this unique utility fully described in the official whitepaper, AiDoge has effectively combined two popular trends in the crypto world — memes and AI. No other coin has managed to do the same, not even ArbDoge AI, a similarly designed crypto that lacks the utility aspect of AiDoge.
AiDoge wants to create an entire community behind the project, and it aims to achieve this by rewarding both those who stake and vote. Once you buy NYSE:AI tokens, you can stake them to gain daily rewards in the form of the same token. Moreover, you can vote on memes other users have created. In turn, this yields you more tokens and rewards the best meme creators. Other similar projects have also gained popularity and increased in value, including Pepe Coin and Wojak. If you’ve missed these pumps, AiDoge might be the next big thing for you. It certainly has more promise than many other cryptos from the past.
As more people realize its potential, artificial intelligence is expanding . Now, with AiDoge, it has entered the crypto market. AiDoge was built on the Ethereum blockchain as a memecoin. The AI-driven meme creator is set to be widely adopted in advertising and marketing sectors due to its ability to create high-quality memes that are also unique. The thing that could potentially give this coin value is the fact that anyone can use their creativity to create memes and be recognized in the community for their efforts. This means that creating memes will be done in moments and will be displayed publicly. The creators who make the best memes will be rewarded for it. Furthermore, the platform is user-friendly and easy to use, which will be extremely helpful for beginners searching for a meme coin to begin their investing/speculation journey.
_______________________
📢Follow us here on TradingView for daily updates and trade ideas on crypto , stocks and commodities 💎Hit like & Follow 👍
We thank you for your support !
CryptoCheck

The REAL S&PAs you might have heard headlines like
"97% of the gains in SNP this year are made up by the top 15 companies"
"Worst market breadth of all time"
Here's a chart of the big 5 (FAANG with microsoft instead of google)
Those "TECH" companies are seemingly ignoring bearish economics and skyrocketing on AI
But...how long will it last when people are seeing 30% lettuce inflation and the like?
(Not to mention NATGAS and USOIL sitting at strong support levels forecasting another possible runup on inflation)
Who knows... I'm not an oracle but here's a chart shows elliot count and pre-distribution supply level
Good luck

Growth of at least ➕35% ChainGPT(CGPT)by Falling Wedge pattern🚀The ChainGPT was able to complete the falling wedge pattern near the support zone.
ChainGPT broke the upper line of the falling wedge pattern.
Also, we can see Regular Divergence(RD+) between two consecutive valleys.
I expect that CGPT will grow by at least ➕ 35% .🚀
ChainGPT Analyze ( CGPTUSDT ), 4-hour time frame ⏰.
Do not forget to put Stop loss for your positions (For every position you want to open).
Please follow your strategy, this is just my Idea, and I will be glad to see your ideas in this post.
Please do not forget the ✅' like '✅ button 🙏😊 & Share it with your friends; thanks, and Trade safe.


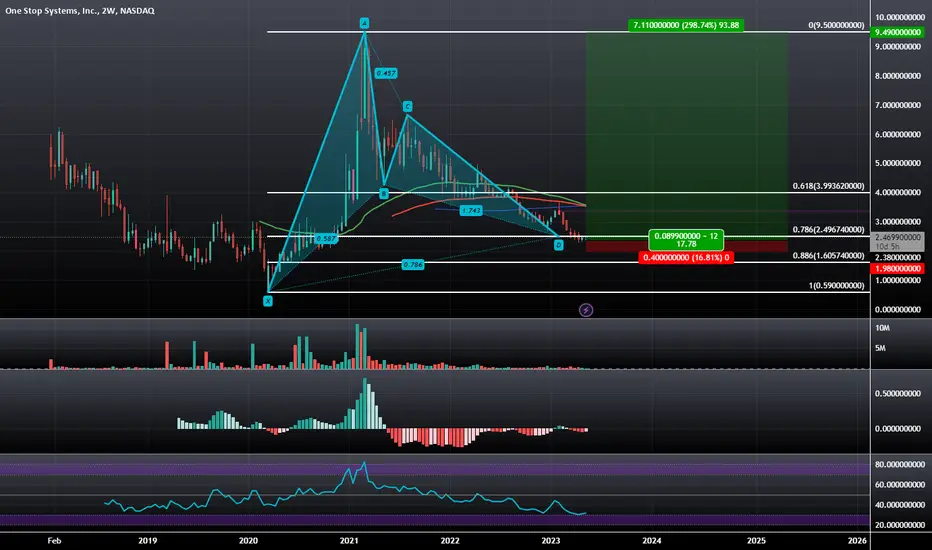
One Stop Systems, Inc.: Multi-Year Bullish GartleyNASDAQ:OSS is at the PCZ of a three years wide Bullish Gartley pattern and it seems to be having a hard time pushing down futher. As a result i think that this 0.786 level will be a good level for it to stand it's ground on but if that fails I will close and wait to see how it reacts at the 0.886.
Bitcoin Forecast Sunny🌞 (Confidence: 1.0)🌞☀️ Welcome everyone to the Bitcoin Weather Forecast! ☀️🌞
After analyzing the bitcoin chart index for the past hour, it's my pleasure to report that the bitcoin world is experiencing sunny weather 🌞🌤️! My confidence level in this forecast is 1.0, which is higher than the baseline of 0.864.
Let's take a closer look at the data:
- The open price for the hour was 27638, and the close price was 27660. This indicates that the market was relatively stable over the past hour.
- The highest price point for the hour was 27686, while the lowest point was 27566. This suggests that there was some volatility in the market, but overall, the price remained within a relatively tight range.
- The trading volume for the hour was 10843, which is an average value. However, the RSI was only 40, indicating that the market is currently oversold.
- Looking at the moving averages, the EMA9 was at 27633, which is below the current price point. This is a positive sign for the market, as it suggests that the trend is upward. However, the other moving averages (EMA21, EMA50, EMA100, and EMA200) are all above the current price point, which indicates that there could be some resistance in the market.
- Finally, the MACD indicator was -346, which suggests that the market is bearish. However, the fast and slow K lines were at 50 and 38 respectively, and the slow D line was at 31. This indicates that the momentum in the market is currently neutral.
Overall, the bitcoin market seems to be experiencing sunny weather 🌞🌤️, with some potential resistance from the moving averages. The oversold RSI suggests that there could be a buying opportunity for investors. However, the bearish MACD indicates that caution should be exercised.

FETCH.Ai long term more gain and shine 💣🚀💣Hello 🐋
we expect to see more gain for the price in log term targets 🚀💣
Brief explanation 📖👌💡
it brings forward a blockchain platform that takes advantage of artificial intelligence in an attempt to help people automate everyday use.
The aim for Fetch.ai is to become a completely open and permissionless network that leverages AI to create a decentralized system that help by machine learning to execute tasks on the blockchain.
Fetchai is an interchain protocol
it harnesses the power of artificial intelligence to implement automated applications that are P2P without any human interference.
Fetchai was launched back in February 2019 through an Initial Exchange Offering (IEO) on the Binance Launchpad.📖
Please, feel free to share your point of view, write it in the comments below, thanks 🐋

#SUIUSDT - CURRENT PARITY FORECAST #SUI ##SuiCommunity #suipadFirst of all, the chart didn't quite fit. It's my own guess. It is not investment advice. If the market goes down, there is a pullback to 0.60 among the options. If I see 5 billion market cap, I will sell my sui. Good luck.

Sunny🌞 (Confidence: 1.0 )🌤️ Good news for Bitcoin investors!
🚀 The Bitcoin weather forecast for the past hour is sunny with a high confidence level of 1.0, as the current market trend is showing a steady upward movement.
📈 The market opened at 28837, climbed to a high of 28918, and closed at 28826. The EMA9 and EMA21 are also in a bullish direction and the RSI is at 44, indicating that the asset is neither overbought nor oversold. The MACD is slightly negative at -92, but this could be a temporary dip. The slow K and slow D lines are both above the fast K line, which indicates that the bullish momentum is likely to continue.
📈 Overall, the outlook is sunny for Bitcoin, and investors may want to consider taking advantage of this trend.

MSFT: Support and resistanceMSFT had a great run, but will it continue?
I see a short term correction due to economical conditions of the US.
Long term it is a good buy, I see it to cross and stabilize above AAPL market cap in less than an year.
NASDAQ:MSFT
