NC HAMMER CRYPTO utoo bThis is just a quick insight on AIOZ.... looks good, if were looking at the fib retracement it has a long way to hit the 0.618 fib retracement which is a little over 100% retracement. This is a possibility when btc goes up, just keep it in mind, and good luck, have fun with it!
AIOZUSDT

$AIOZ/USDT Breakout Trade Setup$AIOZ/USDT – Breakout Trade Setup
AIOZ just broke out of its key supply zone after weeks of consolidation!
Strong bullish structure trendline support setup.
- Target: $1.30
- Entry: CMP
- SL: $0.35
DYRO, NFA

AIOZ First TargetAIOZ reached to the first target, so save profit and increase SL is a good strategy...
One of the best trades ever!!! the best point entry at right time!!!

#AIOZUSDT maintains bearish momentum📉 SHORT BYBIT:AIOZUSDT.P from $0.3816
🛡 Stop Loss: $0.3875
⏱ 15M Timeframe
✅ Overview:
➡️ BYBIT:AIOZUSDT.P is trading in a downtrend, forming a series of lower highs and lower lows.
➡️ Volume Profile suggests that the main liquidity (POC) is positioned above the current price ($0.3919), indicating potential selling pressure.
➡️ A break below $0.3816 will trigger the short position, confirming buyer weakness.
➡️ The main downside targets are in the $0.3750 – $0.3690 range, where a short-term bounce may occur.
⚡ Plan:
➡️ Short entry upon breaking $0.3816, confirming bearish momentum.
➡️ Stop-Loss at $0.3875—placed above the nearest resistance level to minimize risk.
➡️ Main targets: $0.3750 and $0.3690, where downside movement may slow down.
🎯 TP Targets:
💎 TP 1: $0.3750
🔥 TP 2: $0.3690
🚀 BYBIT:AIOZUSDT.P maintains bearish momentum — expecting further downside!
📢 BYBIT:AIOZUSDT.P remains in a bearish trend, and a breakdown below $0.3816 will reinforce selling pressure.
📢 Watch for price reactions near $0.3690, where a slowdown or bounce may occur.

AIOZ Long Swing Trade OpportunityMarket Context:
AIOZ is approaching a key support level, which offers a potential bounce opportunity for a swing trade setup.
Trade Details:
Entry Zone: Around $0.36
Take Profit Targets:
$0.50
$0.60
Stop Loss: Below $0.33
This setup aims to capitalize on the support level holding for a move to the upside. 📈

TradeCityPro | AIOZ: Harnessing AI in Crypto's Competitive Arena👋 Welcome to TradeCityPro!
In this analysis, I want to review the AIOZ coin for you. This project is one of the AI projects and competes with other numerous AI crypto projects.
📅 Daily Time Frame
In the daily timeframe, we are observing a ranging trend that is slightly accompanied by bullish momentum, and there is a possibility of breaking the range ceiling and becoming bullish.
🔍 Currently, the price has started a bullish trend from the low of 0.36363, reaching up to 1.20904, and is now in a correction and rest phase. The correctional range box is between 0.73691 to 1.20904.
📊 The support at 0.73691, which overlaps with the 0.382 Fibonacci correction, has created an important PRZ (Potential Reversal Zone). Currently, for the third time, the support at 0.73691 is being tested, and every time the price reaches this area, a volume of buying enters the market, and this time, as we are seeing today, a significant amount of buying volume has entered.
✨ The RSI oscillator currently does not have a specific trigger, and we need to wait until the price breaks one of the important areas. If the support at 0.73691 is broken, the RSI trigger would be breaking below 30, and if 1.20904 is breached, the trigger for this oscillator would be breaking above 70 and entering the Overbuy zone.
📉 If the support at 0.73691 is broken, the next supports are the 0.5 and 0.618 Fibonacci areas, with the 0.618 zone overlapping at 0.55669, which makes this area more significant. If this area is breached, it can be said that the bullish momentum is completely lost, and the price could move towards 0.36363.
🔼 The main support is at 0.36363, which is very important, and if this level is broken, it confirms a trend change. On the other hand, if 1.20904 is broken, it confirms the trend turning bullish, and we could witness the next bullish leg.
📝 Final Thoughts
This analysis reflects our opinions and is not financial advice.
Share your thoughts in the comments, and don’t forget to share this analysis with your friends! ❤️

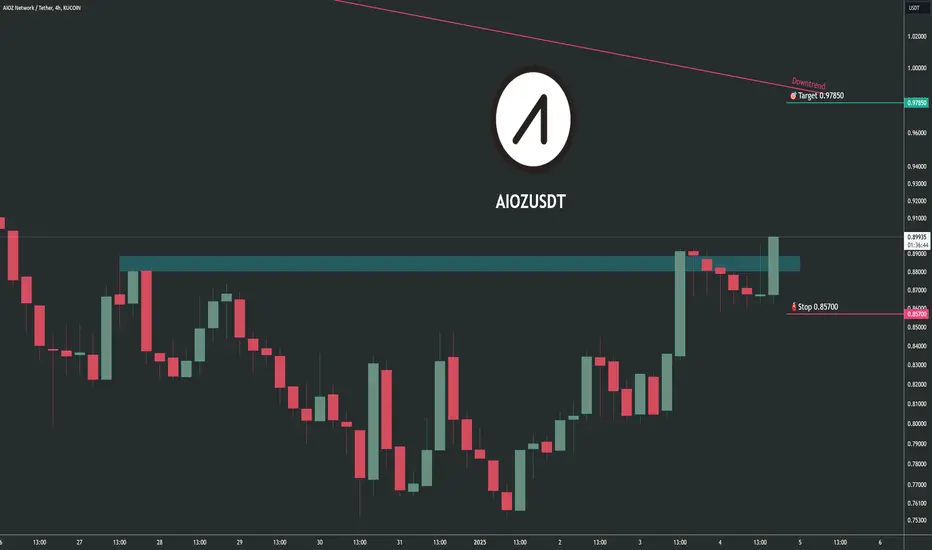
Trading opportunity for AIOZUSDTBased on technical factors there is a Buy position in :
📊 AIOZUSDT
🔵 Buy Now
🪫Stop loss 0.85700
🔋Target 0.97850
📏 R/R 2
💸RISK : 1%
We hope it is profitable for you ❤️
Please support our activity with your likes👍 and comments📝
Trading opportunity for AIOZUSDTBased on technical factors there is a Sell position in :
📊 AIOZUSDT
🔴 Sell Now
🪫Stop loss 1.22510
🔋Target 1 0.76400
🔋Target 2 0.58000
🔋Target 3 0.37800
💸RISK : 1%
We hope it is profitable for you ❤️
Please support our activity with your likes👍 and comments📝

AIOZ looking bullishAIOZ seems to be in a very bullish formation. Path of the least resistance is clearly upwards

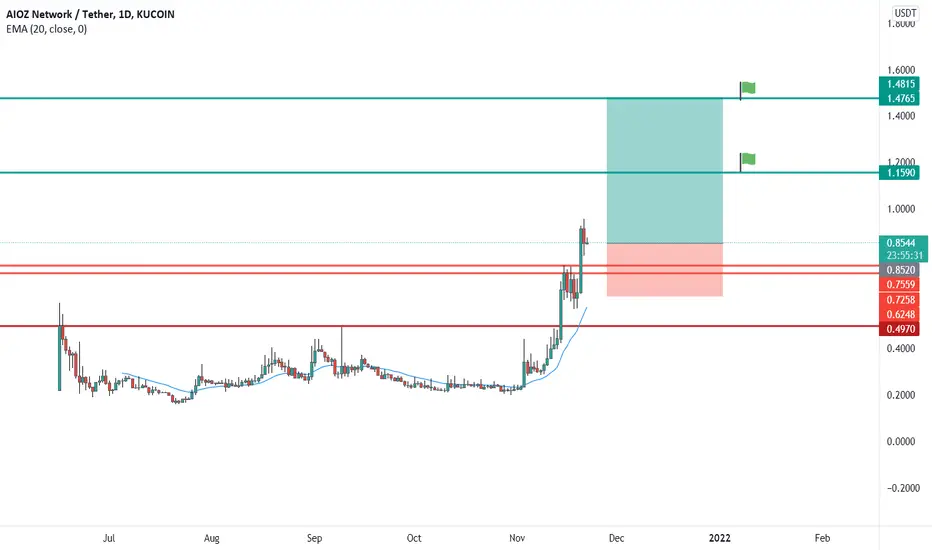
AIOZ Network (AIOZ)AIOZ Network is a Decentralized Physical Infrastructure Network that rewards you for sharing your computational resources for storing, transcoding, and streaming digital media content and powering decentralized AI computation.
Anyway, AIOZ chart is one of those charts that teaches an important lesson: just because the asset/project was in a downtrend, a long one, doesn't mean it is dead and cannot climb all the way up, even further. That exactly what AIOZ did; broke the major downtrend line and went up to the ATH, broke it too, and went up more. After the ATH, AIOZ entered an uncharted territory, to buy AIOZ for spot holding, one has to wait for a major correction. Let's see what happens.

#AIOZ Technical Analysis in a Daily TimeframeHello everyone, I’m Cryptorphic.
I’ve been sharing insightful charts and analysis for the past seven years.
Follow me for:
~ Unbiased analyses on trending altcoins.
~ Identifying altcoins with 10x-50x potential.
~ Futures trade setups.
~ Daily updates on Bitcoin and Ethereum.
~ High time frame (HTF) market bottom and top calls.
~ Short-term market movements.
~ Charts supported by critical fundamentals.
Now, let’s dive into this chart analysis:
AIOZ is trading within a descending parallel channel, and the price is currently near the support level at $0.33. Given the ongoing downtrend, it’s likely that AIOZ will test this support level or even the lower boundary of the channel.
A rebound from the current price or the support levels could trigger a bullish rally, potentially aiming for $1.059, representing a 220% gain.
Key levels:
- Primary Support: $0.33.
- Lower Support: $0.244-$0.27.
- Primary Resistance: $0.49.
- Target: $1.059.
DYOR, NFA.
Please hit the like button to support my content and share your thoughts in the comment section. Feel free to request any chart analysis you’d like to see!
Thank you!
#PEACE

Trade Setup: AIOZ Long PositionMarket Context: $AIOZ is currently seeking support above $0.40, with expectations of one more retest at this level, as BTC potentially retests the $61k mark. This offers a favorable risk-reward opportunity.
Trade Setup:
Entry: Long trade around $0.40 at the support zone.
Take Profit:
First target: $0.61
Second target: $0.84
Stop Loss: Daily close below $0.33.
📊 This trade looks to capitalize on a bounce from support, with well-defined risk management through a stop loss at the key level. #AIOZ #CryptoTrading #Support


AIOZ great R/R #AIOZ/USDT
$AIOZ is about to break from a long-term triangle,
🐮 breaking out from long-term descending resistance, will increase price toward resistance zone around $0.06 and even resistance of $0.075.
and breaking out from $0.08 can move up price toward upper trend lines.
🐻 break down from support zone around $0.045 will invalid this scenario.

ICantw84it: AIOZUSDT reversing here up to cloudBased on timing of algo this is the reverse of the downtrend and should be making its way to the cloud. It already turned away from the cloud once. So should be able to pass it on this trip. Assuming absorption was made.

AIOZ.Usdt (Y22.P1.E1).Looking for a reversal Hi All,
Based on a few assumptions, with WAVE 5 completed and now a accumulation structure to take place for a reversal.
This chart is the most bullish I can think of with the ABCDE count.
Point E can be arguable as we can have a double bottom as well.
#AIOZ
Another trade option has been missed but could give another short setup using the RSI trend line support, and potentially a broadening wedge breakdown. Eg. below
All the best,
S.SAri

AIOZ Probable 3-10RAIOZ has just given a trade with a risk of about 9%. I see 3-10R on the table. Unlikely to reach past 7R, likely to reach 3-4R imo

AIOZUSDTsee and watch :)
The resistance range has been broken and it seems that the price has stabilized above it and provides the way for further price growth ...