#AI/USDT LONG#AI
The price is moving in a descending channel pattern on a 1 H frame
In the event that the price penetrates the descending channel upward, it is expected to reach the targets
Also we have oversold on MACD
Current price 1.16
The first goal is 1.20
The third goal is 1.25
Third goal 1.31
Airbnb

Air BNB back to 114 after earnings ? Some analysts express bearish views on Airbnb, but these assessments might be misguided according to Bernstein.
Key points of bearish sentiment include:
Airbnb’s room nights have grown by only 8% on a compound annual growth rate (CAGR) since 2019.
The company has relied on price increases (9% per year) rather than volume growth.
Airbnb’s average prices are 40% higher today compared to 2019, leading some to believe it has lost its edge as a budget-friendly hotel alternative.
Booking.com, a competitor offering both hotels and short-term rentals, has narrowed the room night growth gap against Airbnb.

Airbnb's Bold Fee Move and the Road to Global ExpansionNavigating New Horizons:
Airbnb (NASDAQ: NASDAQ:ABNB ) has once again captured investor attention with a strategic move that sent its shares soaring 5%. The announcement to increase fees for cross-currency bookings is not just a financial adjustment but a bold step towards unlocking the vast potential of international markets. We'll explore the implications of Airbnb's fee hike, the broader international expansion strategy, and the market's nuanced response.
Unlocking the Global Opportunity:
The 5% surge in Airbnb's ( NASDAQ:ABNB ) stock following the revelation of increased fees for cross-currency bookings speaks volumes about investor sentiment. While the additional charge of up to 2% might seem like a modest adjustment, the real story lies in Airbnb's visionary approach to tap into the immense potential of international markets.
During the Q3'2023 earnings call, Airbnb's management emphasized a 17% growth in cross-border nights booked, showcasing the company's traction in global travel. The letter to shareholders highlighted the recovery of the business in the Asia Pacific region, where gross nights grew 23% in Q3 2023 compared to Q3 2019. Notably, China's outbound travel surged by over 100%, underlining the effectiveness of Airbnb's strategies in a key market. Smaller Asia Pacific markets, including Taiwan, the Philippines, Thailand, Hong Kong, and Indonesia, experienced impressive year-over-year growth above 30% for gross nights booked.
Market Perception and Volatility Analysis:
Amidst the excitement, it's crucial to interpret the market's response to Airbnb's ( NASDAQ:ABNB ) fee adjustment in the context of the company's historical stock volatility. With 16 significant moves greater than 5% in the past year, today's 5% surge indicates that the market perceives the news as impactful but not transformative to the fundamental outlook of the business.
Reflecting on the past year, the most notable move occurred nine months ago when the stock dropped 10.6% following a mixed quarterly report. While Airbnb ( NASDAQ:ABNB ) beat analysts' expectations in gross bookings, revenue, earnings per share (EPS), and free cash flow estimates, concerns arose with weaker guidance for key metrics in the subsequent quarter. The dip was attributed to changes in the expected timing of marketing spend relative to the prior year, coupled with a projection of a similar EBITDA margin for 2023 compared to 2022.
Year-to-Date Performance and Investor Returns:
As of now, Airbnb ( NASDAQ:ABNB ) is up 11.7% since the beginning of the year, trading at $150.09 per share—close to its 52-week high of $153.33 from July 2023.
Conclusion:
As Airbnb ( NASDAQ:ABNB ) navigates the dynamic currents of the market, its fee adjustment for cross-currency bookings is not just about revenue enhancement but a strategic move to capture the global travel resurgence. Investors are presented with a compelling opportunity as the company solidifies its position in under-penetrated markets, with the Asia Pacific region serving as a testament to its recovery.

Airbnb: Checked out 🏨👋The Airbnb share price has recently moved away from the now grayed-out Target Zone and then entered a sideways movement. However, as we now consider the low of the magenta wave (2) to be in place, we expect the rise to continue well above the resistance at $151.16.

AirBNB: Arriving 🛬 🌴Due to the recent sell-off, the price of AirBNB has now reached our magenta target zone between $116.53 and $96.73. This means that the minimum requirements of the magenta wave (2) have been met, implying that the price could theoretically complete its reversal. However, we still expect a drop to the 61.80% retracement first, in order to make the low there. Wave (3) should then take the price clearly higher.

Airbnb (NASDAQ:ABNB) Worth WatchingFor beginners, it can seem like a good idea (and an exciting prospect) to buy a company that tells a good story to investors, even if it currently lacks a track record of revenue and profit. Sometimes these stories can cloud the minds of investors, leading them to invest with their emotions rather than on the merit of good company fundamentals. Loss-making companies are always racing against time to reach financial sustainability, so investors in these companies may be taking on more risk than they should.
Despite being in the age of tech-stock blue-sky investing, many investors still adopt a more traditional strategy; buying shares in profitable companies like Airbnb (NASDAQ:ABNB). While profit isn't the sole metric that should be considered when investing, it's worth recognising businesses that can consistently produce it.
Airbnb's Improving Profits
In the last three years Airbnb's earnings per share took off; so much so that it's a bit disingenuous to use these figures to try and deduce long term estimates. Thus, it makes sense to focus on more recent growth rates, instead. Impressively, Airbnb's EPS catapulted from US$1.98 to US$3.60, over the last year. It's a rarity to see 82% year-on-year growth like that.
Top-line growth is a great indicator that growth is sustainable, and combined with a high earnings before interest and taxation (EBIT) margin, it's a great way for a company to maintain a competitive advantage in the market. The music to the ears of Airbnb shareholders is that EBIT margins have grown from 19% to 22% in the last 12 months and revenues are on an upwards trend as well. Both of which are great metrics to check off for potential growth.
Are Airbnb Insiders Aligned With All Shareholders?
We would not expect to see insiders owning a large percentage of a US$80b company like Airbnb. But thanks to their investment in the company, it's pleasing to see that there are still incentives to align their actions with the shareholders. We note that their impressive stake in the company is worth US$23b. Coming in at 29% of the business, that holding gives insiders a lot of influence, and plenty of reason to generate value for shareholders. Looking very optimistic for investors.
While it's always good to see some strong conviction in the company from insiders through heavy investment, it's also important for shareholders to ask if management compensation policies are reasonable. A brief analysis of the CEO compensation suggests they are. The median total compensation for CEOs of companies similar in size to Airbnb, with market caps over US$8.0b, is around US$12m.
The Airbnb CEO received total compensation of just US$311k in the year to December 2022. That looks like a modest pay packet, and may hint at a certain respect for the interests of shareholders. CEO remuneration levels are not the most important metric for investors, but when the pay is modest, that does support enhanced alignment between the CEO and the ordinary shareholders. Generally, arguments can be made that reasonable pay levels attest to good decision-making.
Is Airbnb Worth Keeping An Eye On?
Airbnb's earnings per share growth have been climbing higher at an appreciable rate. The cherry on top is that insiders own a bucket-load of shares, and the CEO pay seems really quite reasonable. The drastic earnings growth indicates the business is going from strength to strength. Hopefully a trend that continues well into the future. Big growth can make big winners, so the writing on the wall tells us that Airbnb is worth considering carefully. Now, you could try to make up your mind on Airbnb by focusing on just these factors, or you could also consider how its price-to-earnings ratio compares to other companies in its industry.

Windham Hotels & Resorts - 10:1 Long, Speculative News ResponseMy analysis of Windham Hotels & Resorts follows news of NYC's recent ban of AirBNB, a development which inspired me to discover which publicly traded hotel chain might be best positioned to benefit. Hopefully you will challenge my conclusion and/or my measurements with your tough questions, since this venue is meant to arouse the reverse-engineers and to provoke the thinkers to do what they do best, right?
As always, I strive to render these ideas of mine so obviously that their explanation will require no words, but this 10:1 Long trade on the WH chart is highly contextual. Not even a Market Maker can move the price of ABNB as reliably as the State of New York.
Although my trading strategy is built on innate Pattern Recognition and a hard-won sympathy for the Market Maker’s Business Model, my tactics - including the beauty of Tradingview and how it makes me look good - are based on identifying the opportunities within VOLUME, VOLATILITY and TREND EXHAUSTION.
Generally speaking, what a Speculator does that an Investor or a Trader does not is specifically to take advantage of price inefficiencies caused by government interference (or corruption). A good example would be accumulating toilet paper and/or N95 Masks in 2020 and selling the stock in bulk at high markup before the window of opportunity finally closed.
Only a Speculator does that!
The details of the chart(s) speak for themselves, however behind the scenes ChatGPT and I determined that MAR, HLT, IHG, AC and WH were the hotel chains with the greatest number of rooms in NYC that might benefit from the AirBNB news. I was surprised to see that both MAR and HLT are at or near All-Time-Highs, but just as quickly ruled them out as candidates for major growth for exactly that reason.
In short, without ChatGPT concluded that WH is the best candidate to benefit from what might become a growing trend, but is already law in NYC and will therefore have an effect on prices and practices. If this case interests you, then I invite you to compare the listed tickers and let me know if you agree about WH.
Keen observers will see many details in this idea, but how many noticed the ABNB correlation coefficient histograph? If my trade thesis is correct, the polarity should invert, and the tickers will move in opposite directions more often, and for longer.
I am preparing a video on prospecting for opportunities during the current Sector Rotation, and Windam Hotels & Resorts might become part of it. First, though, I have a few more ideas to upload as I update other key charts for the final Quarter of 2023.
Until then, be liquid !!!

airbnb is a good opportunity to buyHello, according to my analysis of airbnb stock, there is a great investment opportunity. The stock looks positive with the side channel broken. And the resistance at 130 was broken there. We also notice the strong green candle that formed on the daily time frame. It indicates a strong entry of buyers into the market. Finally, good luck to everyone

Airbnb: Almost there 🌴The Airbnb share price is heading increasingly toward our magenta target zone with its magenta wave (ii). After reaching it, we expect a far-reaching rise in the magenta wave (iii), which will extend to around 200. Necessary for our primary scenario here is that the price stays within the support at $103.55. When crossing, the alternative would activate, which we assign a probability of 20%, and the price would have to target the turquoise target zone before a rise

Airbnb stock is now in the second bandAirbnb stock is now in the second band
This figure shows the weekly candle chart of Airbnb stock. The graph overlays the recent low points against the golden section. As shown in the figure, Airbnb stock is now in the second band after bottoming out, and it is likely to retreat below the 1.382 position of the golden section in the figure before starting up again! The bullish target for the next wave of Airbnb stocks is around 2.382 on the golden section in the picture!

Airbnb (ABNB) | Breakout, Confirmed With July Close!Hi,
Again, buy the strength, and this time - Airbnb (ABNB)
Started in 2008, Airbnb is the world's largest online alternative accommodation travel agency, also offering booking services for boutique hotels and experiences. Airbnb's platform offered 6.7 million active accommodation listings as of March 31, 2023. Listings from the company's over 4 million hosts are spread over almost every country in the world. In the fourth quarter of 2022, 47% of revenue was from the North American region.
Airbnb has managed to push above strong areas which is confirmed by July close. A monthly close is the best confirmation on that occasion and currently, the price of ABNB has already started to retest the breakout area.
Basically, $125 to $145 was the area that played an important role in the previous price action - it has worked as a support level, and after the break below it has acted as a resistance level. In the short history of date, we can say that this area is the key zone for Airbnb and the price is finally above it which allows calling that technically it would be a good place to buy.
The monthly close was also above the mid-round number of $150 which is a minor win but we will take it and definitely adds a bit of strength to the retest area.
* Considering technical analysis then the optimal buying zone should stay between $125 to $142
* Target updates going to the chat room!
Good luck!

Trading is Patience #ABNBOnce you have selected a stock with decent fundamentals (review every month if the stock still fundamentally sound), then you just need the chart to tell you when to buy it.
Trading is all about waiting/patience.
When price is below the 20/50/200, you stay in cash. You wait.
When price is above 20/50/200, you wait for a base/pullback and a trigger.
In this example, there was a decent gap up breakout but got stopped out. So what? A good system just need a 30-40% winning rate.
Look for a base and you WAIT.

Will Airbnb break through after sortingWill Airbnb break through after triangle sorting ?
This figure shows the Line chart chart of Airbnb stock in the last two years. The graph overlays the recent bottom-up golden section, as well as the connection between high and low points in the past two years, as well as the connection between low and low points. As shown in the figure, the Airbnb stock has broken through the previous downward trend line's upward pressure line, and has recently hit new pressure, starting to emerge from a clear triangular consolidation pattern! In the future, we should focus on the area near the end of the triangle consolidation, and see if the Airbnb stock can accelerate its upward breakthrough!

Airbnb: Holiday home with pool 👙🩳Could you do with a holiday? For Airbnb, there is a nice turquoise pool waiting below the support at $107.10, stretching between $105.87 and $89.00. Thus, the share should hop below $107.10 and dive into the bracing water to complete wave 2 in turquoise. Once refreshed, Airbnb should turn upwards and rise from the pool to continue the overarching ascent. However, there is a 30% chance that Airbnb might have already finished wave alt.2 in turquoise, which would be confirmed by a direct upwards movement above the resistance at $144.63.

Bear Flag PatternThe chart is showing a Bear Flag Pattern,
And with the rsi being below the 50 middle band,
And with breaking major support line at 119,69.
I see a bearish sentiment for the next few days,
And if we break the 115.94 trend line,
I see ourselves dropping to the 111.51 trend line,
And drop again to finally hit the button off the next major support line of 106.39.
This is just my opinion...Safe trading everyone

ABNB - AirBNB 25% Don't sleep on ABNBAirBNB is 25% away from its recent high zone. Is it time for Airbnb to catch some air tine? Is it a must have for the watchlist?

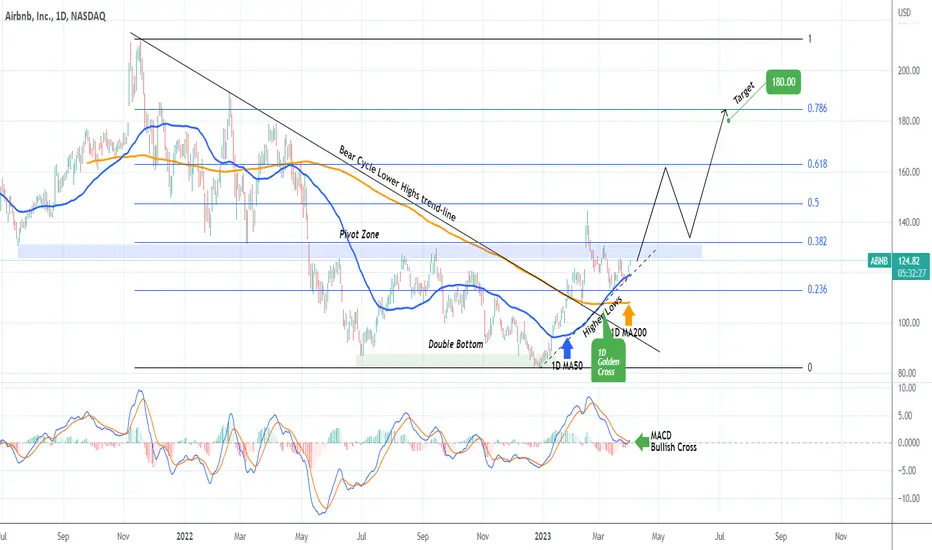
AIRBNB well supported targeting $180.Airbnb Inc (ABNB) is flashing major buy signals as it came outside the 2022 Bear Cycle. Not only is it supported by the 1D MA50 (blue trend-line) on a Higher Lows trend-line, but is also past a 1D Golden Cross pattern.
Having broken above the Bear Cycle Lower Highs trend-line and successfully re-tested it as a Support, it almost filled the 0.5 Fibonacci retracement level on February 16 and is now targeting the upper ones. We characterize the 0.382 - 0.618 Fibonacci range as the High Volatility Zone and our target by Q3 is just below the 0.786 Fib at $180.00.
-------------------------------------------------------------------------------
** Please LIKE 👍, FOLLOW ✅, SHARE 🙌 and COMMENT ✍ if you enjoy this idea! Also share your ideas and charts in the comments section below! **
-------------------------------------------------------------------------------
💸💸💸💸💸💸
👇 👇 👇 👇 👇 👇
AIRBNB is trying to 'accomodate' back 140 soon.4HR higher lows -- ascending continuation.
Spotted at 118.80 -- may target 140 recent peak soon.
TAYOR.

Trading Idea 003: AirbnbMarket Conditions:
- trend reversal
- bullish sentiment in the market
Key Level and Lines:
- $103.50 resistance
Trading Ideas:
- go long after a consolidation around the resistance
- a downward movement below $100 and the bearish sentiment in the market = go short.


Trading Idea 048: AirbnbMarket Conditions:
- bullish trend, correction
- bearish sentiment in the market
Key Level and Lines:
- $120.50 support
Trading Ideas:
- go short if the price moves below the support.
- go long if the price bounces from the support and the market is bullish.

$ABNB Daily - Buyers Must Hold $120$ABNB daily, rejected at the 8 EMA and now below 200 SMA. if $120 breaks, expect further downward selling pressure to the $110 level.

ABNB updateWe could be looking at 120$ retest, could be seeing an good drop here back to 80-100$ area. In my previous ideas I talked about how ABNB will have it's downfall by the end of 2023, it'll high likely still happen as the current pumping is likely because of good news for the market but it's not long term good.
