DAL: Buy on good earningsFAILED BREAKOUT OF HISTORICAL TOP MEETS MOVING-AVERAGE SUPPORT
DAL is currently trading 15% below historical high, after it repeatedly failed to break out since late last year, on what looks like a quadruple-top at the historical high. However, the corrective move seems to have met a decent support at the MA100, $44 level. I would venture to say that the stock has found a temporary bottom and that the short-term picture looks positive.
SUPPORTIVE FUNDAMENTALS
In addition to the improving technical picture, the news flow from the industry has been supportive, as airlines have been publishing ever improving yield/occupancy numbers. As a confirmation, the DAL earnings have just come out and the stock is indicated up some 3% pre-market on the news.
COMPELLING RISK-REWARD
Strategy: Plain vanilla BUY at the market
Target: $50/share then $52/share
Stop-loss: $44/share
Minimum R/R: 1.72x
Alternatively sell a put at the stop-loss ($44) to finance a slightly OTM call.
Airlines

A Hard Landing Ahead For Southwest?The bears might want to use the occasion and drag the stock back down to the support of wave 4 in the $35-$30 area.

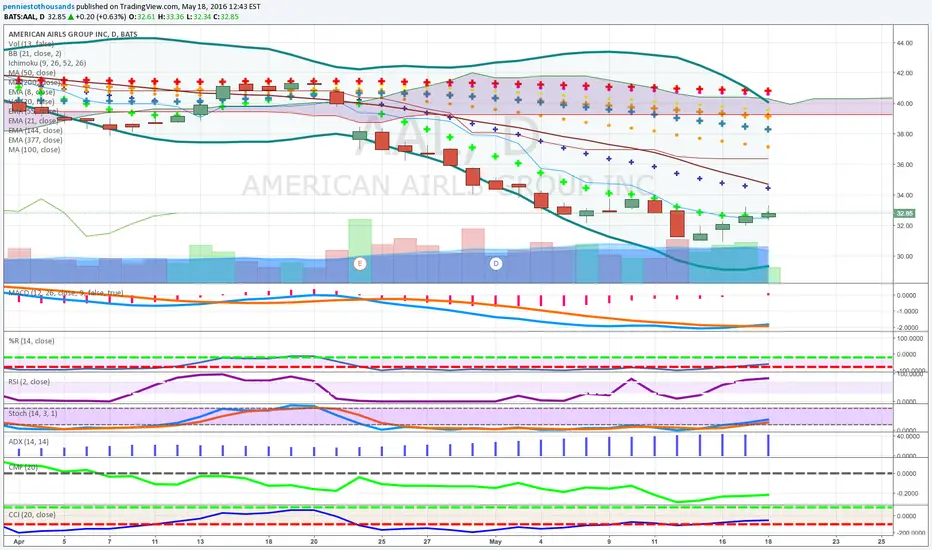
Short Put Spread - AALTrade Setup:
-1 AAL May 19 36/41 Short Put Spread @ $1.39
DTE: 57
Max Win: $139
Max Loss: $361 (will manage 2x credit, so $280)
Breakeven: $39.61
Trade Management: 50% profit; 2x credit received as max loss; Will roll out if on the dance floor.
Green is profit zone and up; Vertical black bar is expiration.

Long EasyJet at multidiagonal ConfluenceThere's a smaller multidiagonal confluence down here and as it combines with a strong rising support zone it looks to me like it has the potential to be a good short term trade.


Airline CooloffHistorically when the vortex negative hits this level the stock drops at least 1.21% with an average drop around 13.57%. A drop around this average is possible, but DAL has not been trading at large enough daily spreads to make this likely in the next few weeks. A more conservative drop would be near the 47.56 mark which has been a pseudo support/resistance level.

BOEING (BA) watching for the breakoutBoeing is currently in a r(0.976) linear regression started in September. The stock price shortly tumbled after the Cancel the order! tweet from Donald Trump and created a strong support level at ~150.5. I'm waiting for the price to breakout the red breakout line to enter a LONG position.
---
"Investing should be more like watching paint dry or watching grass grow. If you want excitement, take $800 and go to Las Vegas" - Paul Samuelson

Boeing already looking overstretched pre-Trump announcementEyes are on Boeing at the moment, following President-Elect Trump's remarks on the possible future of Air Force One.
It is worth noting that Boeing is already looking overstretched at current levels - momentum studies are overbought and prices are now trading in the historic distribution top from 2015-2016 - and risk/reward is turning lower.
Could Trump's remarks provide the catalyst for the corrective pullback?

US Airlines breaking higher - Tweet asking if it's BuffetA short Tweet asked if Warren Buffet is buying the Airlines.
Regardless, it seems to gathering upside momentum.
A break above the USD277~ range highs is needed to shake out the shorts.


Folowing Buffets FootstepsWhen Warren buys an Airline this has to be good, anyone remember that speech about him beeing an aeroholic, and everytime he wants to buy an airline he calls some phonenumber and they talk him out of it?

NAS.OL going up to 404 from 279 in Nov/DecThis is my first time tech analyzing a chart. I think it will keep decreasing to 279, then it will go up again.

LUV: Great accumulation at key level$LUV is showing a great accumulation pattern, right above an older 'Key earnings support' level.
We can long at market open risking a drop to 35.40, and aiming for a retest of 39.97 in the intermediate term.
This is a good way of leveraging a potential retracement in crude oil to be seen soon, possibly after the next OPEC meeting shows leaders fail to reach an agreement, or if they simply 'freeze' production at record levels (which is the same as sitting on their hands, and maintaining the status quo).
Feel free to comment. Also, if interested in learning more about my private tuition and/or trading signals service, message me privately.
Good luck,
Ivan Labrie.

AIR FRANCE Nice Risk Reward - Selloff ExhaustedThis is looking interesting. Not much to say: RSI divergences developing, with the stock down 45% since March. The selloff seems fairly exhaused. Nice risk reward, if you put a stop at 4.79 and target at 5.27

DAL: strong immediate buySignals:
double bottom
Flag
Buy 36.80-37.00
Stop 35.80 (-4 tics of flag's low)
Target 1-45.50; 2-50.00 (sizing+Elliot's waves)

short on bounce retest to 50 ma use limitshort on bounce up to 50 day ma/cci and percent r still on bottom range even with bounce/


long term short below cloud and 5o on weekly rising oil below cloud -dollar may weaken-price fixing lawsuit-price volume trend money flow weak

Airlines are flashing bullilsh signsHere is another chart sporting a compelling story. A bullish one that is. As my other recent posts, the Dow Jones US Airlines seems to indicate there's still life in this bull market. From its high of early 2015, the index decline in pretty much a textbook flat i.e. an ABC with wave B trying to kiss the high. Then we have near equality between A and C. Another interesting observation, the decline lasted very close to a Fibonacci 13 months or a Fibonacci 55 Weeks.
Markets are patterned. In time and shape. You just have to deal with the fact that is rarely clear cut. Actually I think it has to be murky enough for most people to not believe in that theory so they can produce those patterns.
The bottom line is the current advance from recent low is impulsive indicating the trend is now up and one as to expect at least 3 waves up at minimum for the airlines are bullish long term until we can count a sequence of 5 waves.

Virgin Airlines: Up or down?Virgin Airlines was a growth stock turned sour. Even with fuel hedging and increase in revenue the market still does not approve VA and hence cause it's decline since it's high at december.
Technical: Based on the chart, there are 2 anomalies that one should take note when trading this.
1) Between $30(green line) and $26.42 (blue horizontal line), the price has found support. This is a crucial zone and it is absolutely crucial that you do not enter the trade unless you are very very sure of the fundamentals else you will be catching a falling knife. This is known as the accumulation/distribution phase where thousands of shares are being exchanged with no prior direction. It is also where liquidity is highest and many "big boys" are either unloading or loading up stock. Do check insider transactions for more info
2) The descending triangle is marked by the same support level and a decreasing resistance. Based on bulkowski's formula that sets price target based on probability. I have marked where the predicted price would go.
Fundamentals: Simplywall.st did DCF calculations and found it's fair value at around $14. This is close to Bulkowski's formula's prediction. VA is overvalued based on cash flow studies. However based on traditional ratio metrics VA is undervalued. P/E stands at 6.52. PEG stands at 0.26. P/S stands at 0.81 and EV/EBITDA stands at 4.67. They do have quite a bit of debt but their cash flow could easily pay it off.
Story: Investors believe oil and the Zika virus would affect sales of this stock heavily and hence they are bearish about it.
Would I go long? Yes! Once the price exited the $30 zone.
Would I go Short? Also yes!. Only of the price drops below $26.42!
Would I do anything now? No! I'm not catching a falling knife. Market is ??? about this stock. So trade after breakouts.

