BTC AI Prediction Dashboard - 6h Price Path (29.07.25)
Prediction made using Crypticorn AI Prediction Dashboard
Link in bio
BTCUSDT Forecast:
Crypticorn AI Prediction Dashboard Projects 6h Price Path (Forward-Only)
Forecast timestamp: ~09:00 UTC
Timeframe: 15m
Prediction horizon: 6 hours
Model output:
Central estimate (blue line): -118,729
Represents the AI’s best estimate of BTC’s near-term price direction.
80% confidence band (light blue): 118,724 – 119,346
The light blue zone marks the 80% confidence range — the most likely area for price to close
40% confidence band (dark blue): 118,151 – 119,894
The dark blue zone shows the narrower 40% confidence range, where price is expected to stay with higher concentration
Volume on signal bar: 95.57
This chart shows a short-term Bitcoin price forecast using AI-generated confidence zones.
Candlesticks reflect actual BTC/USDT price action in 15-minute intervals.
This helps visualize expected volatility and potential price zones in the short term.
Aitrading

XAUUSD SNIPER OUTLOOK – JULY 28, 2025🔥 Macro & Sentiment
The dollar remains dominant — DXY holding above 105 keeps gold under pressure. No fundamental support for bullish continuation unless major macro shifts. Risk flows are defensive, not aggressive. FOMC and US GDP data remain key drivers for direction this week.
BIAS:
• Short-term bearish under 3350
• Market still in distribution mode — every bounce gets sold
• Real buy interest only deep below 3315
🔻 INTRADAY SUPPLY ZONES (Short Only With Rejection)
1. 3382–3370 (H1/M30 Premium Supply)
🔹 H1 order block, FVG alignment, EMA21/50/100 convergence
🔹 Liquidity inducement above → then rejection
📍 Short only if rejection shows via engulf / upper wick.
2. 3355–3340 (Decision Zone / Micro Supply)
🔹 EMA100/200 alignment, former support flipped resistance
🔹 M30 FVG fully filled, structure flip from mid-July
📍 Short bias below. Long only if reclaimed with H1 close above 3355.
🔵 NEUTRAL / PIVOT ZONE
3. 3338–3326 (Decision Band – M30/M15)
🔹 Consolidation area post-BOS, internal liquidity sweeps
🔹 EMA21 base on M15, no clear dominance
📍 Wait for clean reaction. Bullish engulf = scalp long to 3355. Failure = slide to demand.
🟢 DEMAND ZONES (Buy Only On Strong Reversal Confirmation)
4. 3314–3302 (M30/M15 Deep Demand)
🔹 H1 OB + hidden FVG + fib 38.2%
🔹 First real demand zone where buyers may engage
📍 Long only if strong M15 confirmation: engulf + RSI cross + EMA5/21 angle change.
5. 3289–3272 (True Reversal Demand – H1/M30)
🔹 Full NY reversal origin (July 18), major FVG left unfilled
🔹 Institutional volume + liquidity grab zone
📍 Buy only on full flush + fast snapback with BOS on M15/H1.
🧭 BIAS & EXECUTION BY TIMEFRAME
H4 Bias:
Bearish while below 3350. No valid supply above until 3370+. Avoid longs unless price sweeps 3314 or 3272 and confirms.
H1 Bias:
Sell clean rejection at 3355 or 3370–3382. Only flip long above 3355 with full-bodied close.
M30 Bias:
Watch decision zone 3338–3326 for direction. No-man’s land in between — don’t force trades.
M15 Bias:
Scalp long from 3314 or 3272 only on full confluence (OB + RSI + EMA realignment). Short only confirmed rejections above.
📊 FULL INTRADAY KEY LEVELS (Top → Bottom)
Level Context
3405 Fib ext. 127% (HTF sweep target only)
3385 OB
3375–3350 Valid Premium Supply (H1 shelf)
3350–3340 Micro Supply / Flip Zone
3338–3326 Decision Zone – watch reaction
3314–3302 Deep Demand (H1/M30 confluence)
3289–3272 Extreme Demand Base
3260 Fib 61.8% + HTF support
3250 Minor volume node
3240 Final structural floor
✅ EXECUTION NOTES
⛔ Avoid entering inside 3340–3326 → fakeout zone
✅ Play only clean sniper triggers with structure
⚠️ Wait for macro — FOMC / GDP releases may fake both sides
💡 Patience wins. Pick your zone, wait for setup, strike.
Which zone are you watching to strike? Drop your bias below.
📍 Like, comment & follow GoldFxMinds for the most precise sniper maps on TradingView.
Disclosure: This plan is based on the Trade Nation chart feed. I am part of their Influencer Program.

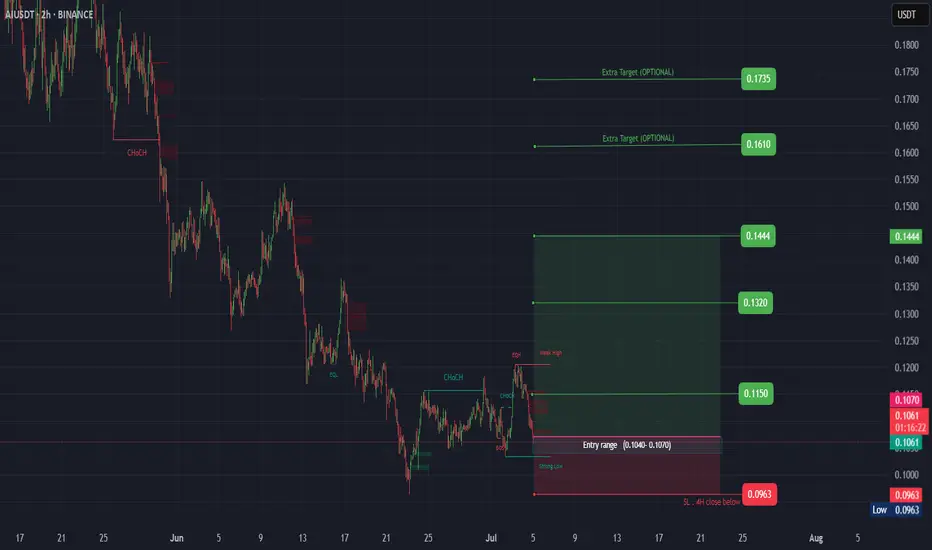
AI ( SPOT )BINANCE:AIUSDT
#AI/ USDT
Entry( 0.1040- 0.1070)
SL 4H close below 0.0963
T1 0.1150
T2 0.1320
T3 0.1444
_______________________________________________________
Golden Advices.
********************
* collect the coin slowly in the entry range.
* Please calculate your losses before the entry.
* Do not enter any trade you find it not suitable for you.
* No FOMO - No Rush , it is a long journey.
Bitcoin -Weekly Forecast, Technical Analysis & Trading IdeasMidterm forecast:
86499.57 is a major support, while this level is not broken, the Midterm wave will be uptrend.
We will close our open trades, if the Midterm level 86499.57 is broken.
MARKETSCOM:BITCOIN BITSTAMP:BTCUSD
Technical analysis:
A trough is formed in daily chart at 74545.70 on 04/09/2025, so more gains to resistance(s) 105431.17, 109932.90, 115000.00 and more heights is expected.
Take Profits:
86499.57 ✅
91037.20 ✅
94505.46 ✅
98675.19 ✅
101430.12 ✅
105431.17
109932.90
115000.00
120000.00
125000.00
132000.00
140000.00
150000.00
160000.00
167666.00
________________________________________________________________
❤️ If you find this helpful and want more FREE forecasts in TradingView,
. . . . . . . . Hit the 'BOOST' button 👍
. . . . . . . . . . . Drop some feedback in the comments below! (e.g., What did you find most useful? How can we improve?)
🙏 Your support is appreciated!
Now, it's your turn!
Be sure to leave a comment; let us know how you see this opportunity and forecast.
Have a successful week,
ForecastCity Support Team

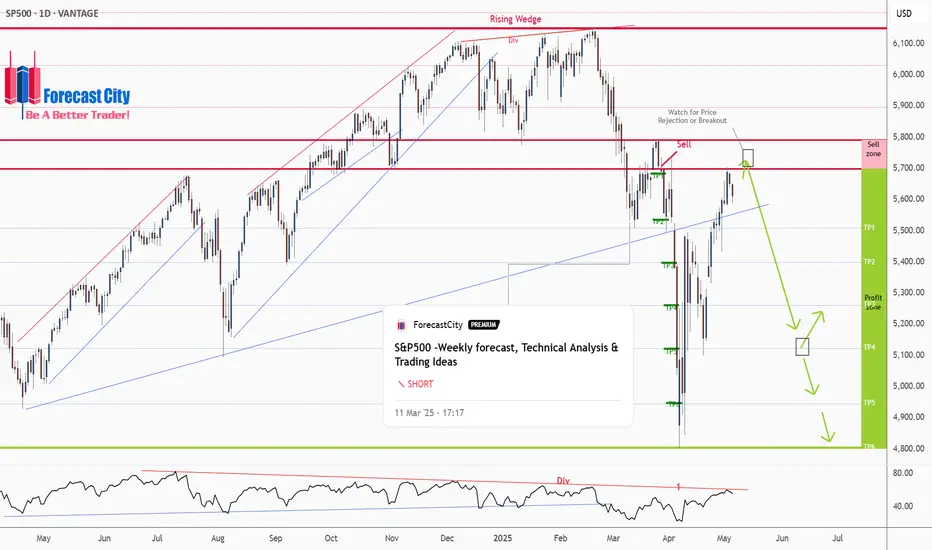
S&P500 -Weekly forecast, Technical Analysis & Trading IdeasPrevious forecast result:
As you can see in the 4CastMachine forecast on 12/03/2025, the price, after rejecting the sell zone, began its sharp decline and touched all TPs.
Midterm forecast:
While the price is below the resistance 6149.57, resumption of downtrend is expected.
We make sure when the support at 4804.01 breaks.
If the resistance at 6149.57 is broken, the short-term forecast -resumption of downtrend- will be invalid. CSEMA:S&P
Technical analysis:
While the RSI downtrend #1 is not broken, bearish wave in price would continue.
A trough is formed in daily chart at 4807.10 on 04/07/2025, so more gains to resistance(s) 5698.65, 5791.00, 5896.50 and maximum to Major Resistance (6149.57) is expected.
Price is above WEMA21, if price drops more, this line can act as dynamic support against more losses.
Relative strength index (RSI) is 55.
Take Profits:
5509.32
5363.90
5261.00
5122.47
4944.41
4804.01
__________________________________________________________________
❤️ If you find this helpful and want more FREE forecasts in TradingView,
. . . . . . . . Hit the 'BOOST' button 👍
. . . . . . . . . . . Drop some feedback in the comments below! (e.g., What did you find most useful? How can we improve?)
🙏 Your support is appreciated!
Now, it's your turn!
Be sure to leave a comment; let us know how you see this opportunity and forecast.
Have a successful week,
ForecastCity Support Team
GOLD(XAUUSD) -Weekly Forecast,Technical Analysis & Trading IdeasMidterm forecast:
2772.38 is a major support, while this level is not broken, the Midterm wave will be uptrend.
TVC:GOLD OANDA:XAUUSD
Technical analysis:
A trough is formed in daily chart at 2956.50 on 04/07/2025, so more gains to resistance(s) 3357.00, 3500.00 and more heights is expected.
Take Profits:
2833.00
2879.11
2955.00
3057.40
3160.00
3257.03
3357.00
3500.00
__________________________________________________________________
❤️ If you find this helpful and want more FREE forecasts in TradingView,
. . . . . . . . Hit the 'BOOST' button 👍
. . . . . . . . . . . Drop some feedback in the comments below! (e.g., What did you find most useful? How can we improve?)
🙏 Your support is appreciated!
Now, it's your turn!
Be sure to leave a comment; let us know how you see this opportunity and forecast.
Have a successful week,
ForecastCity Support Team

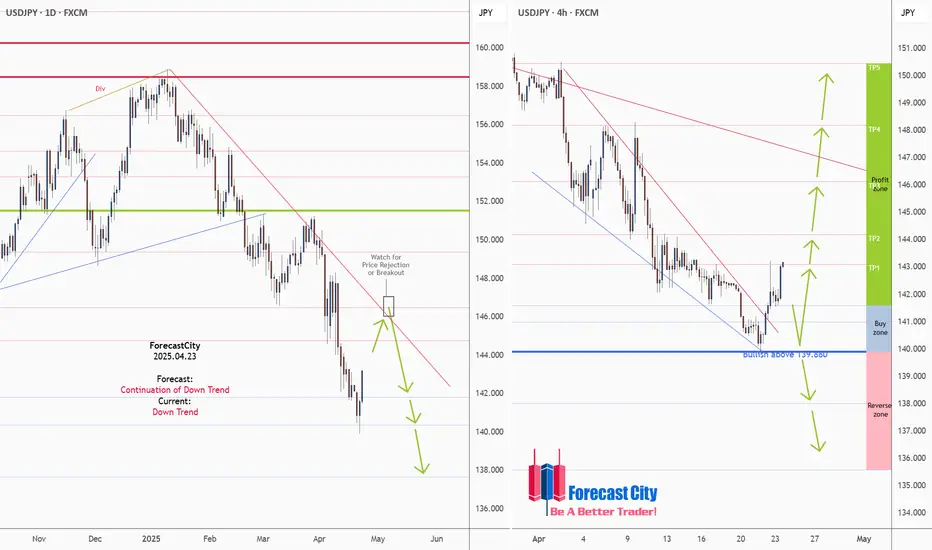
USDJPY Daily & H4 Forecasts, Technical Analysis & Trading IdeaTechnical analysis is on the chart!
No description needed!
FX:USDJPY
________________________________________________________________
❤️ If you find this helpful and want more FREE forecasts in TradingView,
. . . . . . . . Hit the 'BOOST' button 👍
. . . . . . . . . . . Drop some feedback in the comments below! (e.g., What did you find most useful? How can we improve?)
🙏 Your support is appreciated!
Now, it's your turn!
Be sure to leave a comment; let us know how you see this opportunity and forecast.
Have a successful week,
ForecastCity Support Team
AUDJPY: H4, H1 Forecasts, Technical Analysis & Trading IdeaTechnical analysis is on the chart!
No description needed!
OANDA:AUDJPY
________________________________________________________________
❤️ If you find this helpful and want more FREE forecasts in TradingView,
. . . . . . . . Hit the 'BOOST' button 👍
. . . . . . . . . . . Drop some feedback in the comments below! (e.g., What did you find most useful? How can we improve?)
🙏 Your support is appreciated!
Now, it's your turn!
Be sure to leave a comment; let us know how you see this opportunity and forecast.
Have a successful week,
ForecastCity Support Team

USDCHF Daily, H4,H1 Forecasts, Technical Analysis & Trading IdeaMidterm forecast:
0.84000 is a major resistance, while this level is not broken, the Midterm wave will be downtrend.
OANDA:USDCHF
Technical analysis:
A trough is formed in daily chart at 0.80385 on 04/21/2025, so more gains to resistance(s) 0.83314 and maximum to Major Resistance (0.84000) is expected.
Take Profits:
0.83314
0.84000
0.85430
0.86286
0.87550
0.89147
0.90367
0.92218
0.94400
__________________________________________________________________
❤️ If you find this helpful and want more FREE forecasts in TradingView,
. . . . . . . . Hit the 'BOOST' button 👍
. . . . . . . . . . . Drop some feedback in the comments below! (e.g., What did you find most useful? How can we improve?)
🙏 Your support is appreciated!
Now, it's your turn!
Be sure to leave a comment; let us know how you see this opportunity and forecast.
Have a successful week,
ForecastCity Support Team

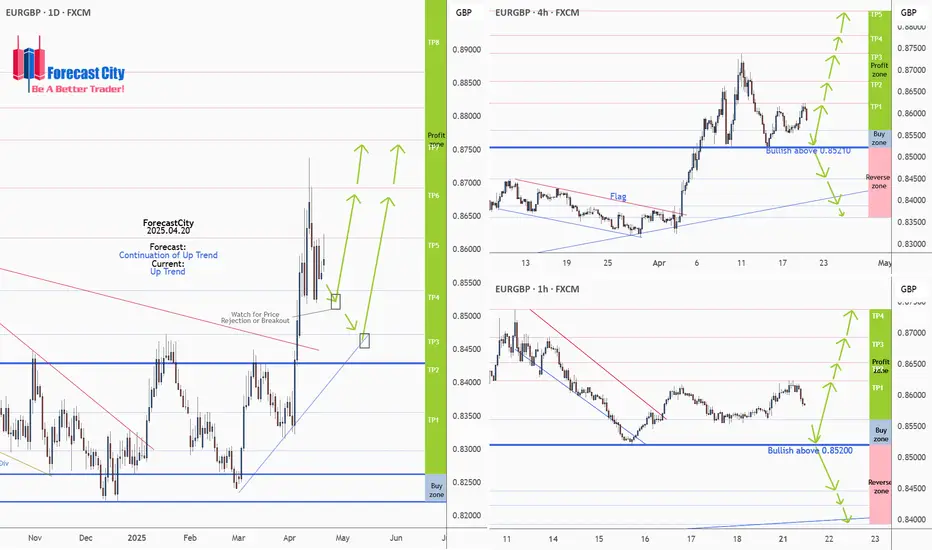
EURGBP Daily, H4,H1 Forecasts, Technical Analysis & Trading IdeaMidterm forecast:
0.84290 is a major support, while this level is not broken, the Midterm wave will be uptrend.
We will close our open trades, if the Midterm level 0.84290 is broken.
OANDA:EURGBP
Technical analysis:
A trough is formed in daily chart at 0.83220 on 04/03/2025, so more gains to resistance(s) 0.86175, 0.86923, 0.87647 and more heights is expected.
__________________________________________________________________
❤️ If you find this helpful and want more FREE forecasts in TradingView,
. . . . . . . . Hit the 'BOOST' button 👍
. . . . . . . . . . . Drop some feedback in the comments below! (e.g., What did you find most useful? How can we improve?)
🙏 Your support is appreciated!
Now, it's your turn!
Be sure to leave a comment; let us know how you see this opportunity and forecast.
Have a successful week,
ForecastCity Support Team
EURUSD Daily, H4,H1 Forecasts, Technical Analysis & Trading Idea💡 Daily Timeframe:
As forecasted by 4CastMachine AI last week, EURUSD was rejected from the channel line.
💡 H4 Timeframe:
FX:EURUSD started a corrective wave,
This decline may continue, but the support area of 1.1200 ~ 1.0890 could trigger a rebound.
This area, which was previously a major resistance, will become a major support, creating a good buying opportunity.
💡 H1 Timeframe:
The Triangle pattern formed in the price has broken downwards.
The bearish wave is expected to continue as long as the price is below the strong resistance at 1.1334
1.1334 Support is broken now. It will act as a Resistance now!
💡 H1 Forecast:
Correction wave toward the Sell Zone
Another Downward Impulse wave toward Lower TPs
H1 Trading Idea:
Sell now or wait for pullback and Sell on price rejection from 1.1334.
SL: Above 1.1334
__________________________________________________________________
❤️ If you find this helpful and want more FREE forecasts in TradingView,
. . . . . . . . Hit the 'BOOST' button 👍
. . . . . . . . . . . Drop some feedback in the comments below! (e.g., What did you find most useful? How can we improve?)
🙏 Your support is appreciated!
Now, it's your turn!
Be sure to leave a comment; let us know how you see this opportunity and forecast.
Have a successful week,
ForecastCity Support Team

GOLD(XAUUSD) -Weekly Forecast,Technical Analysis & Trading IdeasMidterm forecast:
2772.38 is a major support, while this level is not broken, the Midterm wave will be uptrend.
We will close our open trades, if the Midterm level 2772.38 is broken.
OANDA:XAUUSD TVC:GOLD
Technical analysis:
A peak is formed in daily chart at 3167.60 on 04/03/2025, so more losses to support(s) 3000.00, 2955.00, 2879.11 and minimum to Major Support (2772.38) is expected.
Take Profits:
2833.00
2879.11
2955.00
3000.00
3057.40
3100.00
3167.60
3200.00
__________________________________________________________________
❤️ If you find this helpful and want more FREE forecasts in TradingView,
. . . . . . . . Hit the 'BOOST' button 👍
. . . . . . . . . . . Drop some feedback in the comments below! (e.g., What did you find most useful? How can we improve?)
🙏 Your support is appreciated!
Now, it's your turn!
Be sure to leave a comment; let us know how you see this opportunity and forecast.
Have a successful week,
ForecastCity Support Team

Bitcoin -Weekly, Daily, H4, H1 Forecasts, Trading IdeasMidterm forecast, Weekly Timeframe:
While the price is above the support 70550.04, resumption of uptrend is expected.
We make sure when the resistance at 91037.20 breaks.
If the support at 70550.04 is broken, the short-term forecast -resumption of uptrend- will be invalid.
BITSTAMP:BTCUSD MARKETSCOM:BITCOIN
Daily Timeframe:
A trough is formed in daily chart at 74545.70 on 04/09/2025, so more gains to resistance(s) 86499.57 and maximum to Major Resistance (91037.20) is expected.
Take Profits:
86499.57
91037.20
94505.46
98675.19
101430.12
105431.17
109932.89
115000.00
120000.00
125000.00
130000.00
140000.00
H4 Timeframe:
H1 Timeframe:
________________________________________________________________
❤️ If you find this helpful and want more FREE forecasts in TradingView,
. . . . . . . . Hit the 'BOOST' button 👍
. . . . . . . . . . . Drop some feedback in the comments below! (e.g., What did you find most useful? How can we improve?)
🙏 Your support is appreciated!
Now, it's your turn!
Be sure to leave a comment; let us know how you see this opportunity and forecast.
Have a successful week,
ForecastCity Support Team

GOLD(XAUUSD) -Weekly Forecast,Technical Analysis & Trading Ideas💡 Daily Timeframe:
As the 4CastMachine AI forecasted, the price began its decline towards the $3,000 support.
At the support area of 3000, the up trend line will also prevent further declines.
If this area is broken, the price will decline to the support area of 2789.95.
This area, which was previously a major resistance, will become a major support, creating a good buying opportunity.
So, given the long-term uptrend, we can use this area as a long-term BUY ZONE.
OANDA:XAUUSD TVC:GOLD
💡 H4 Timeframe:
Gold started its decline when it hit the 3167 resistance.
The uptrend is broken, and price is in an impulse wave.
This decline will continue, but the support area of 3000 and uptrend line could trigger a resumption of uptrend.
💡 H1 Timeframe:
If the price enters the sell zone with a corrective wave, we will wait for the price to reject from that area.
If we see a price rejection from the sell zone, we can sell.
H1 Forecast:
Correction wave toward the Sell Zone
Another Downward Impulse wave toward Lower TPs
__________________________________________________________________
❤️ If you find this helpful and want more FREE forecasts in TradingView,
. . . . . . . . Hit the 'BOOST' button 👍
. . . . . . . . . . . Drop some feedback in the comments below! (e.g., What did you find most useful? How can we improve?)
🙏 Your support is appreciated!
Now, it's your turn!
Be sure to leave a comment; let us know how you see this opportunity and forecast.
Have a successful week,
ForecastCity Support Team

GOLD(XAUUSD) -Weekly Forecast,Technical Analysis & Trading IdeasMidterm forecast:
2772.38 is a major support, while this level is not broken, the Midterm wave will be uptrend.
We will close our open trades, if the Midterm level 2772.38 is broken.
OANDA:XAUUSD TVC:GOLD
Technical analysis:
A trough is formed in daily chart at 2832.55 on 02/28/2025, so more gains to resistance(s) 3100.00, 3150.00, 3200.00 and more heights is expected.
Take Profits:
2833.00
2879.11
2955.00
3000.00
3057.40
3100.00
3150.00
3200.00
__________________________________________________________________
❤️ If you find this helpful and want more FREE forecasts in TradingView,
. . . . . . . . Hit the 'BOOST' button 👍
. . . . . . . . . . . Drop some feedback in the comments below! (e.g., What did you find most useful? How can we improve?)
🙏 Your support is appreciated!
Now, it's your turn!
Be sure to leave a comment; let us know how you see this opportunity and forecast.
Have a successful week,
ForecastCity Support Team

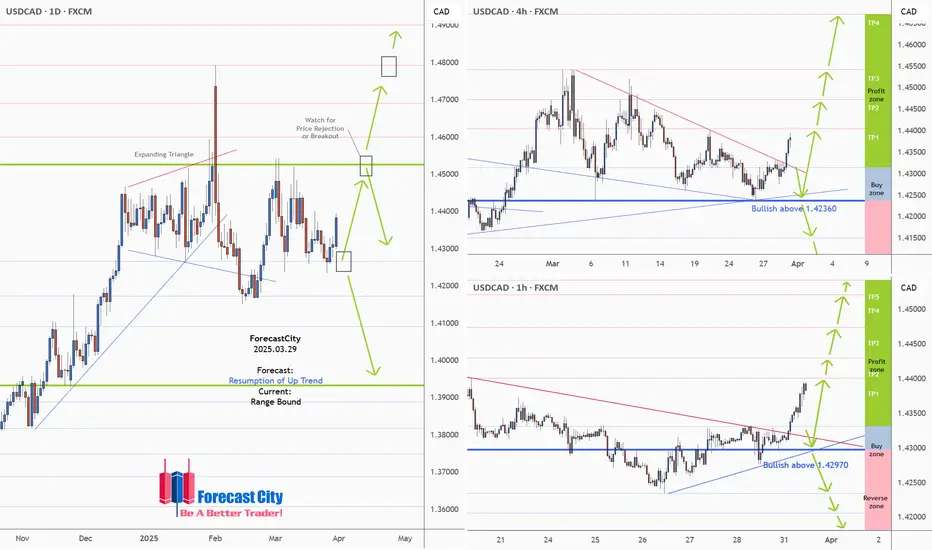
USDCAD -Weekly Forecast,Technical Analysis & Trading Ideas
Technical analysis is on the chart!
No description needed!
OANDA:USDCAD
________________________________________________________________
❤️ If you find this helpful and want more FREE forecasts in TradingView,
. . . . . . . . Hit the 'BOOST' button 👍
. . . . . . . . . . . Drop some feedback in the comments below! (e.g., What did you find most useful? How can we improve?)
🙏 Your support is appreciated!
Now, it's your turn!
Be sure to leave a comment; let us know how you see this opportunity and forecast.
Have a successful week,
ForecastCity Support Team
GBPCAD - Weekly Forecast,Technical Analysis & Trading IdeasTechnical analysis is on the chart!
No description needed!
OANDA:GBPCAD
__________________________________________________________________
❤️ If you find this helpful and want more FREE forecasts in TradingView,
. . . . . . . . Hit the 'BOOST' button 👍
. . . . . . . . . . . Drop some feedback in the comments below! (e.g., What did you find most useful? How can we improve?)
🙏 Your support is appreciated!
Now, it's your turn!
Be sure to leave a comment; let us know how you see this opportunity and forecast.
Have a successful week,
ForecastCity Support Team

ZCash (ZEC)- Weekly Forecast,Technical Analysis & Trading IdeasMidterm forecast:
While the price is above the support 24.41, beginning of uptrend is expected.
We make sure when the resistance at 45.33 breaks.
If the support at 24.41 is broken, the short-term forecast -beginning of uptrend- will be invalid.
COINBASE:ZECUSD
Technical analysis:
A trough is formed in daily chart at 29.20 on 03/21/2025, so more gains to resistance(s) 41.10 and maximum to Major Resistance (45.33) is expected.
Take Profits:
35.60
41.10
45.33
50.14
56.49
67.07
79.42
90.06
100.00
117.07
135.00
170.00
216.50
305.00
370.55
__________________________________________________________________
❤️ If you find this helpful and want more FREE forecasts in TradingView,
. . . . . . . . Hit the 'BOOST' button 👍
. . . . . . . . . . . Drop some feedback in the comments below! (e.g., What did you find most useful? How can we improve?)
🙏 Your support is appreciated!
Now, it's your turn!
Be sure to leave a comment; let us know how you see this opportunity and forecast.
Have a successful week,
ForecastCity Support Team

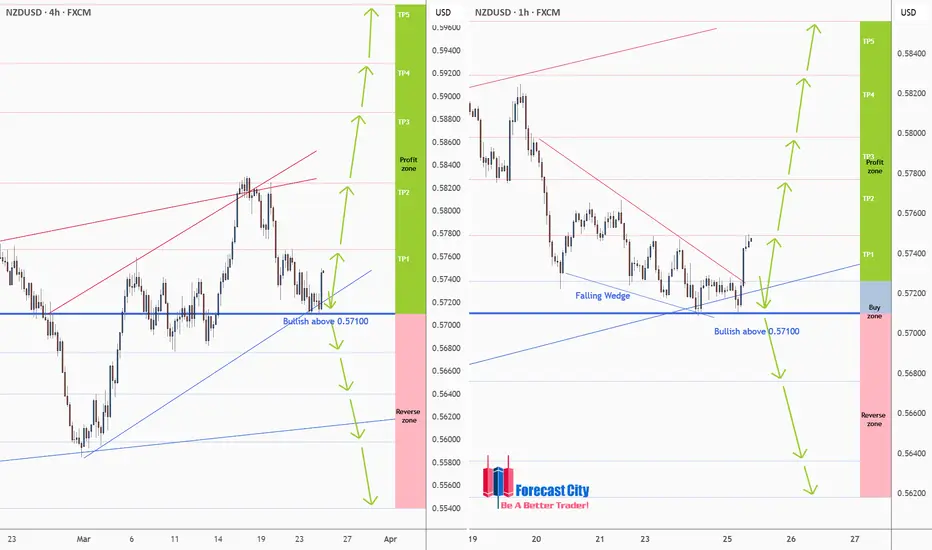
NZDUSD - H4, H1 Forecast - Technical Analysis & Trading IdeasTechnical analysis is on the chart!
No description needed!
OANDA:NZDUSD
__________________________________________________________________
❤️ If you find this helpful and want more FREE forecasts in TradingView,
. . . . . . . . Hit the 'BOOST' button 👍
. . . . . . . . . . . Drop some feedback in the comments below! (e.g., What did you find most useful? How can we improve?)
🙏 Your support is appreciated!
Now, it's your turn!
Be sure to leave a comment; let us know how you see this opportunity and forecast.
Have a successful week,
ForecastCity Support Team
GOLD(XAUUSD) -Weekly Forecast,Technical Analysis & Trading Ideas💡 OANDA:XAUUSD Daily Timeframe:
As forecasted by 4CastMachine AI last week, gold started its decline when it hit the red channel line.
This decline will continue, but the support area of 2955 could trigger a rebound.
At the support area of 2955, the up trend line will also prevent further declines.
If this area is broken, the price will decline to the support area of 2789.95.
This area, which was previously a major resistance, will become a major support, creating a good buying opportunity.
So, given the long-term uptrend, we can use this area as a long-term BUY ZONE.
💡 TVC:GOLD H4 Timeframe:
The price is in a Corrective wave.
Given the break of the ascending trend line in the RSI, the corrective wave is expected to continue to a depth of 2955.
💡 H1 Timeframe:
A Head and Shoulder Reversal Pattern has formed and the neckline has also been broken. Price is touching the neckline again. It is very likely that the downward wave will start from this area.
3027.83 support is broken now. It will act as a Resistance now!
Forecast:
Correction wave toward the Sell Zone
Another Downward Impulse wave toward Lower TPs
__________________________________________________________________
❤️ If you find this helpful and want more FREE forecasts in TradingView,
. . . . . . . . Hit the 'BOOST' button 👍
. . . . . . . . . . . Drop some feedback in the comments below! (e.g., What did you find most useful? How can we improve?)
🙏 Your support is appreciated!
Now, it's your turn!
Be sure to leave a comment; let us know how you see this opportunity and forecast.
Have a successful week,
ForecastCity Support Team

ETHEREUM -Weekly forecast,Technical Analysis & Trading IdeasMidterm forecast:
While the price is above the support 1521.00, beginning of uptrend is expected.
We make sure when the resistance at 2090.33 breaks.
If the support at 1521.00 is broken, the short-term forecast -beginning of uptrend- will be invalid.
BITSTAMP:ETHUSD MARKETSCOM:ETHEREUM
Technical analysis:
A trough is formed in daily chart at 1750.30 on 03/11/2025, so more gains maximum to Major Resistance (2090.33) is expected.
Take Profits:
2362.31
2546.73
2801.10
3042.75
3516.43
3741.60
4107.80
4500.00
4868.00
__________________________________________________________________
❤️ If you find this helpful and want more FREE forecasts in TradingView,
. . . . . . . . Hit the 'BOOST' button 👍
. . . . . . . . . . . Drop some feedback in the comments below! (e.g., What did you find most useful? How can we improve?)
🙏 Your support is appreciated!
Now, it's your turn!
Be sure to leave a comment; let us know how you see this opportunity and forecast.
Have a successful week,
ForecastCity Support Team

WTI - Weekly Forecast - Technical Analysis & Trading IdeasMidterm forecast:
While the price is above the support 64.000, resumption of uptrend is expected.
We make sure when the resistance at 79.361 breaks.
If the support at 64.000 is broken, the short-term forecast -resumption of uptrend- will be invalid.
TVC:USOIL BLACKBULL:WTI
Technical analysis:
A peak is formed in daily chart at 79.355 on 01/15/2025, so more losses to support(s) 64.900 and minimum to Major Support (64.000) is expected.
Take Profits:
68.354
70.182
72.434
74.449
77.410
79.361
83.961
87.000
93.882
100.802
109.192
126.350
__________________________________________________________________
❤️ If you find this helpful and want more FREE forecasts in TradingView,
. . . . . . . . Hit the 'BOOST' button 👍
. . . . . . . . . . . Drop some feedback in the comments below! (e.g., What did you find most useful? How can we improve?)
🙏 Your support is appreciated!
Now, it's your turn!
Be sure to leave a comment; let us know how you see this opportunity and forecast.
Have a successful week,
ForecastCity Support Team

GOLD(XAUUSD) -Weekly forecast,Technical Analysis & Trading IdeasMidterm forecast:
2772.38 is a major support, while this level is not broken, the Midterm wave will be uptrend.
OANDA:XAUUSD TVC:GOLD
Technical analysis:
A trough is formed in daily chart at 2832.55 on 02/28/2025, so more gains to resistance(s) 3000.00, 3050.00, 3080.00 and more heights is expected.
Take Profits:
2833.00
2879.11
2955.00
3000.00
3050.00
__________________________________________________________________
❤️ If you find this helpful and want more FREE forecasts in TradingView,
. . . . . . . . Hit the 'BOOST' button 👍
. . . . . . . . . . . Drop some feedback in the comments below! (e.g., What did you find most useful? How can we improve?)
🙏 Your support is appreciated!
Now, it's your turn!
Be sure to leave a comment; let us know how you see this opportunity and forecast.
Have a successful week,
ForecastCity Support Team
