40 ticker screener on matrix table with TV built in indicatorsusing tables, security, customized color gradients, unicode font substitution, and the as of now working "matrix" built-in, i put this together as part of building a multi-alert capable screener, it has almost functional capability to track other things.. when completed, it will be customizable to pick ~any~ indicator desired to fill in between 1 and 5 columns, and a choice of vertical, horizontal, or quadrant layouts..
Alert

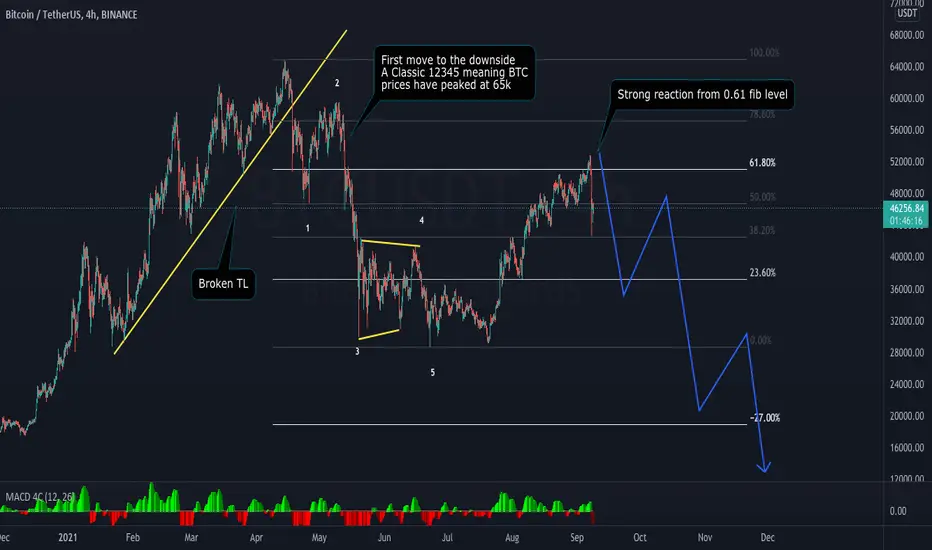
Bitcoin Cup & Handle Bullish Pattern Alert!Hello my trading view family!
In todays analysis we are looking at this bullish cup & handle pattern on Bitcoin.
As you can see prices have tested the .618 level, this level is the key fib ratio for handles in cup & handle pattern.
If prices hold support at this level we will likely see prices march up past new all time highs.
I remain bullish on this giant.
Stay profitable!
- Dalin Anderson

$GLBS Technical Analysis = Bullish Reversal & Pump Alert!Great News For Retail Investors, Its Officially A Pump Alert! Currently $2.32 With Targets Highlighted!
Chart Patterns: Falling Wedge Bullish Reversal!
Inverse Head & Shoulders Bullish Uptrend!
Earnings Report 4/12/22
Expect Continued Growth, Expansion Of Fleet, No More Public Offerings, Long Term Positive Outlook Of Company!
All we need is attention, its up to you the investors to spread the word on this undervalued Stock!

EURGBP SHORT IDEAKey resistance is approaching with a liquidity gap below to fill. Looking like a great opportunity to short.
For more check out stocksandpips.com

3 MAIN POSSIBLE SCENARIOS #BTCexplanation
current main support zones
1)35k & 20 ma monthly & ascending trend line(blue) & 100 ma confluence together
2)30k
3)20k & 100ma weekly & lower trend line support of main ascending channel confluence together
current main resistance zone-45k & 50 ma weekly confluence together
facts
(1)you can see that 35k zone is very important ...there are many confluences together..good zone to re-obtain/gain the bull strength!!!
(2)if btc break 35k zone its gives us a very bearish,bad sign.sooo watch 35k level carefully.
(3)its clear that 45k area also a high resistance zone..if btc break 45k area we can see 48k,52k respectively.(im personaly 50% bullish if that breakout happened)
(4)rsi line have a chance to test the yellow support zone..(im personaly expecting a move like that)
(5)i have a drew a blue trendline traingle watch it too
possibilities
*i have draw 3 scenarios that can happen 1,2,3 in blue,pink,green respectively.
*if we loss 35k ..20k is more possible(if we break 30k zone clearly)...
*if we loss 35k btc may create a reversal pattern like head & shoulder..like head in the 30k zone or 20k zone
my personal idea about btc :-if we loss 35k,30k zones 20 k is comming...its more possible heres not like in 2021 may month . there are many confirmations...rsi levels,fibanachi,ma history more and more...so atleast we must hold above 30k..im completly bullish(100%) if btc break blue traingle upward and establish properly..until then im not trusting the market...
so survive in the market..dont be overbullish!!
#notafinancialadvice just my view.
analyzed by-@movindu karunathilaka


DOA trading Strategy - CHFJPY#CHFJPY - 15 mins DOA confirmations fired. Green DOA sniper and meter
Broke the pennant in 15 mins
Strong bounce in 4hr HL

GBP/USD ALERT EASYthis position is basically with the LOD, HOD and fibonacci. if the price dont pump at the price protect the trade to BE

AlarmIf it is possible to select several currencies at the time of selecting the alarm, it would be great, for example, that after touching the alarm, we will be able to select as many currencies as we want and the alarm will run for all those currencies at the same time.

$GLBS $2.95 AT ROBINHOOD BULLISH REVERSAL 2,500% GAINS Company used financing to expand fleet, the dry bulk industry is primed for a bounce back year after Covid-19.
The stock is near alltime lows, in a downward trend. However it has strong support! The chart pattern is a falling wedge bullish reversal. A breakout is strong.
The company had a rough couple years, they made a few mistakes, and the world shutdown. However moving forward the company is in position for expansion, growth and investment.
This is a long term stock to own.
Currently $2.95 With Targets Up to $100

BTC crucial 21 weekly moving average closing on its wayBTC is testing the weekly 21 Moving average that is coming in around 41600. to confirm the BTC short term bearish mode, BTC has to close the weekly candle below 42000. and to stay somewhat bullish then BTC has to close the weekly candle above 42000 in any cost by Sunday 5 AM weekly closing. If BTC breaks the 21 weekly perfectly at closing then it is very likely to say we can see 37000
In history it has been seen, whenever BTC breaks the weekly 21 moving average perfectly then a short-term bearish market has started for up to 2 months to 3.

Crash Alert of Death cross Similar to the crossover of Daily 50 and 200 moving average, 20 and 50 moving cross over also effect sometime super and some times mini crash.
currently 20 moving average is about to cross over the 50 daily moving average, we are likely to see little upset in a coming days but Since we are already entered in a Golden cross of Daily 50 and 200 moving averages, it may delay the effects of both crosses and neutral the BTC market in to consolidations.
History reveals a major and minor upsets whenever 20moving average crossover the 50 daily moving average.

Here is what JPM will not tell you!That it may be a great opportunity to buy for a swing above the price level 47.01$
❤️Please, support our work with like & comment!❤️

What Does Elliot Wave Tell Us About Recent Bitcoin Move?The world’s most prominent digital currency was in a free fall yesterday, All the sharp moves either up or down can be the beginning of a major trend shift. This is a huge evidence for me that we are already in the a yearly bear market already.
Trade with care.

SSL Channel Alert strategyMy SSL channel 10-10 2hr alert strat. Set 4 Alerts for crossing up plot (first on list) Up and down trigger once per bar for early alert, Up/down trigger on close for confirmation.
These are not 100% take trade signals. Always use TA and other indications for confirmation. This is not financial advice etc...

Gold H4 - Long SetupGold H4
Back on support price of 1797, the range continues... We didn't quite push up to resistance. But filled majority of the range.
Bit late for us personally, but interested to see where we are tomorrow for EUR/LON market open.

Indicator introduction: Auto Trendline & Breakout AlertNote: This indicator will be published soon
In short, this indicator is a tool designed for different purposes:
1) Automatic drawing of trend lines
2) Classification of trend lines based on the reaction of price chart and trading volume
3) Receiving trend lines breakout alerts
4) Analyzing smaller time frames is time consuming and tedious, but this tool makes it easy. The following figure shows 5-m time frame chart, you can see the panel of the latest breakouts on it (You can enable the panel in the settings menu):
How it works?
Trend lines are classified into 6 levels, of which only 3 are enabled by default.
Level 01 (Red Lines) is the strongest level. Therefore, the breakout of these lines is the most important signal of this indicator.
Volume verification helps you avoid fake Breakouts.
As you can see, both the labels and the table show the status of the trading volume when the lines breakout.
Trading volume is classified into 5 levels:
Over volume (confirmed ✅)
High volume (confirmed ✅)
Neutral
Low volume (potential fake breakout ⚠)
Minor volume (potential fake breakout ⚠)
This indicator can be used on both logarithmic and linear charts. (Scale in the settings menu can be changed from linear to logarithmic)
Finally, this indicator includes a trend line breakout alert and you can be notified wherever you are. you can add alerts to different charts and enter the market in the best conditions.
If you like it, please leave a comment.

Indicator introduction: Auto Trendline & Breakout AlertNote: This indicator will be published soon
In short, this indicator is a tool designed for different purposes:
1) Automatic drawing of trend lines
2) Classification of trend lines based on the reaction of price chart and trading volume
3) Receiving trend lines breakout alerts
4) Analyzing smaller time frames is time consuming and tedious, but this tool makes it easy. The following figure shows 2-H time frame chart, you can see the panel of the latest breakouts on it (You can enable the panel in the settings menu):
How it works?
Trend lines are classified into 6 levels, of which only 3 are enabled by default.
Level 01 (Red Lines) is the strongest level. Therefore, the breakout of these lines is the most important signal of this indicator.
Volume verification helps you avoid fake Breakouts.
As you can see, both the labels and the table show the status of the trading volume when the lines breakout.
Trading volume is classified into 5 levels:
Over volume (confirmed ✅)
High volume (confirmed ✅)
Neutral
Low volume (potential fake breakout ❌)
Minor volume (potential fake breakout ❌)
This indicator can be used on both logarithmic and linear charts. (Scale in the settings menu can be changed from linear to logarithmic)
Finally, this indicator includes a trend line breakout alert and you can be notified wherever you are. you can add alerts to different charts and enter the market in the best conditions.
If you like it, please leave a comment.

Indicator introduction: Auto Trendline & Breakout AlertNote: This indicator will be published soon
In short, this indicator is a tool designed for different purposes:
1) Automatic drawing of trend lines
2) Classification of trend lines based on the reaction of price chart and trading volume
3) Receiving trend lines breakout alerts
4) Analyzing smaller time frames is time consuming and tedious, but this tool makes it easy. The following figure shows 15-min time frame:
How it works?
Trend lines are classified into 6 levels, of which only 3 are enabled by default.
Level 01 (Red Lines) is the strongest level. Therefore, the breakout of these lines is the most important signal of this indicator.
Volume verification helps you avoid fake Breakouts.
As you can see, both the labels and the table show the status of the trading volume when the lines breakout.
Trading volume is classified into 5 levels:
Over volume (confirmed ✅)
High volume (confirmed ✅)
Neutral
Low volume (potential fake breakout ❌)
Minor volume (potential fake breakout ❌)
This indicator can be used on both logarithmic and linear charts. (Scale in the settings menu can be changed from linear to logarithmic)
Finally, this indicator includes a trend line breakout alert and you can be notified wherever you are. you can add alerts to different charts and enter the market in the best conditions.
If you like it, please leave a comment.

Indicator introduction: Auto Trendline & Breakout AlertNote: This indicator will be published soon
In short, this indicator is a tool designed for different purposes:
1) Automatic drawing of trend lines
2) Classification of trend lines based on the reaction of price chart and trading volume
3) Receiving trend lines breakout alerts
4) Analyzing smaller time frames is time consuming and tedious, but this tool makes it easy. The following figure shows 2-H time frame:
How it works?
Trend lines are classified into 6 levels, of which only 3 are enabled by default.
Level 01 (Red Lines) is the strongest level. Therefore, the breakout of these lines is the most important signal of this indicator.
Volume verification helps you avoid fake Breakouts.
As you can see, both the labels and the table show the status of the trading volume when the lines breakout.
Trading volume is classified into 5 levels:
Over volume (confirmed ✅)
High volume (confirmed ✅)
Neutral
Low volume (potential fake breakout ❌)
Minor volume (potential fake breakout ❌)
This indicator can be used on both logarithmic and linear charts. (Scale in the settings menu can be changed from linear to logarithmic)
Finally, this indicator includes a trend line breakout alert and you can be notified wherever you are. you can add alerts to different charts and enter the market in the best conditions.
If you like it, please leave a comment.

Indicator introduction: Auto Trendline & Breakout AlertNote: This indicator will be published soon
In short, this indicator is a tool designed for different purposes:
1) Automatic drawing of trend lines
2) Classification of trend lines based on the reaction of price chart and trading volume
3) Receiving trend lines breakout alerts
4) Analyzing smaller time frames is time consuming and tedious, but this tool makes it easy. The following figure shows 3-min time frame:
How it works?
Trend lines are classified into 6 levels, of which only 3 are enabled by default.
Level 01 (Red Lines) is the strongest level. Therefore, the breakout of these lines is the most important signal of this indicator.
Volume verification helps you avoid fake Breakouts.
As you can see, both the labels and the table show the status of the trading volume when the lines breakout.
Trading volume is classified into 5 levels:
Over volume (confirmed ✅)
High volume (confirmed ✅)
Neutral
Low volume (potential fake breakout ❌)
Minor volume (potential fake breakout ❌)
This indicator can be used on both logarithmic and linear charts. (Scale in the settings menu can be changed from linear to logarithmic)
Finally, this indicator includes a trend line breakout alert and you can be notified wherever you are. you can add alerts to different charts and enter the market in the best conditions.
If you like it, please leave a comment.

Indicator introduction: Auto Trendline & Breakout AlertNote: This indicator will be published soon
In short, this indicator is a tool designed for different purposes:
1) Automatic drawing of trend lines
2) Classification of trend lines based on the reaction of price chart and trading volume
3) Receiving trend lines breakout alerts
4) Analyzing smaller time frames is time consuming and tedious, but this tool makes it easy. The following figure shows 5-min time frame:
How it works?
Trend lines are classified into 6 levels, of which only 3 are enabled by default.
Level 01 (Red Lines) is the strongest level. Therefore, the breakout of these lines is the most important signal of this indicator.
Volume verification helps you avoid fake Breakouts.
As you can see, both the labels and the table show the status of the trading volume when the lines breakout.
Trading volume is classified into 5 levels:
Over volume (confirmed ✅)
High volume (confirmed ✅)
Neutral
Low volume (potential fake breakout ❌)
Minor volume (potential fake breakout ❌)
This indicator can be used on both logarithmic and linear charts. (Scale in the settings menu can be changed from linear to logarithmic)
Finally, this indicator includes a trend line breakout alert and you can be notified wherever you are. you can add alerts to different charts and enter the market in the best conditions.
If you like it, please leave a comment.
