Algorand Wyckoff Accumulation Schematic Posting this to see if this will turn out to be true, looks promising, another bullish case for ALGOBTC.
ALGOBTC

ALGO/BTC - Algorand: Resistance_Breakout◳◱ A Resistance Breakout has been identified on the SIX:ALGO / CRYPTOCAP:BTC chart. The price has broken above a key resistance level, indicating a potential bullish trend. The next resistance key levels are located at 0.00000622 | 0.00000639 | 0.00000677, and the major support zones can be found at 0.00000584 | 0.00000563 | 0.00000525. Consider entering at the current price zone of 0.00000623 and targeting higher levels.
◰◲ General info :
▣ Name: Algorand
▣ Rank: 42
▣ Exchanges: Binance, Kucoin, Huobipro, Bittrex, Kraken, Hitbtc
▣ Category/Sector: Infrastructure - Smart Contract Platforms
▣ Overview: Algorand is a scalable, secure, and decentralized digital currency and smart contract platform. Its protocol uses a variation of Proof-of-Stake (PoS) called Pure PoS (PPoS) to secure the network and reach consensus on block production. Unlike other PoS models, PPoS does not reward, nor does it put validator or user funds at risk of being slashed (a loss of funds used to promote honest node and user behavior). Algorand intends to eventually leverage its PPoS design to form the foundation for an on-chain governance system.
◰◲ Technical Metrics :
▣ Mrkt Price: 0.00000623 ₿
▣ 24HVol: 14.526 ₿
▣ 24H Chng: 2.467%
▣ 7-Days Chng: 2.40%
▣ 1-Month Chng: -27.91%
▣ 3-Months Chng: -37.87%
◲◰ Pivot Points - Levels :
◥ Resistance: 0.00000622 | 0.00000639 | 0.00000677
◢ Support: 0.00000584 | 0.00000563 | 0.00000525
◱◳ Indicators recommendation :
▣ Oscillators: NEUTRAL
▣ Moving Averages: STRONG_BUY
◰◲ Technical Indicators Summary : BUY
◲◰ Sharpe Ratios :
▣ Last 30D: -6.44
▣ Last 90D: -1.69
▣ Last 1-Y: -0.75
▣ Last 3-Y: 0.51
◲◰ Volatility :
▣ Last 30D: 0.55
▣ Last 90D: 0.75
▣ Last 1-Y: 0.87
▣ Last 3-Y: 1.20
◳◰ Market Sentiment Index :
▣ News sentiment score is N/A
▣ Twitter sentiment score is 0.60 - Bullish
▣ Reddit sentiment score is 0.59 - Bullish
▣ In-depth ALGOBTC technical analysis on Tradingview TA page
▣ What do you think of this analysis? Share your insights and let's discuss in the comments below. Your like, follow and support would be greatly appreciated!
◲ Disclaimer
Please note that the information and publications provided are for informational purposes only and should not be construed as financial, investment, trading, or any other type of advice or recommendation. We encourage you to conduct your own research and consult with a qualified professional before making any financial decisions. The use of the information provided is solely at your own risk.
▣ Welcome to the home of charting big: TradingView
Benefit from a ton of financial analysis features, instruments and data. Have a look around, and if you do choose to go with an upgraded plan, you'll get up to $30.
Discover it here - affiliate link -

Algorand at an important junctureMoment of truth for Algorand. Will it close above its recently re-gained trend line this week and this month? Above .30 with some sideways action would be ideal. Because if it does, it will have quite the bull run. If not, it may need to re-visit 14c and that would delay the structure. But so far so good!
Cheers!

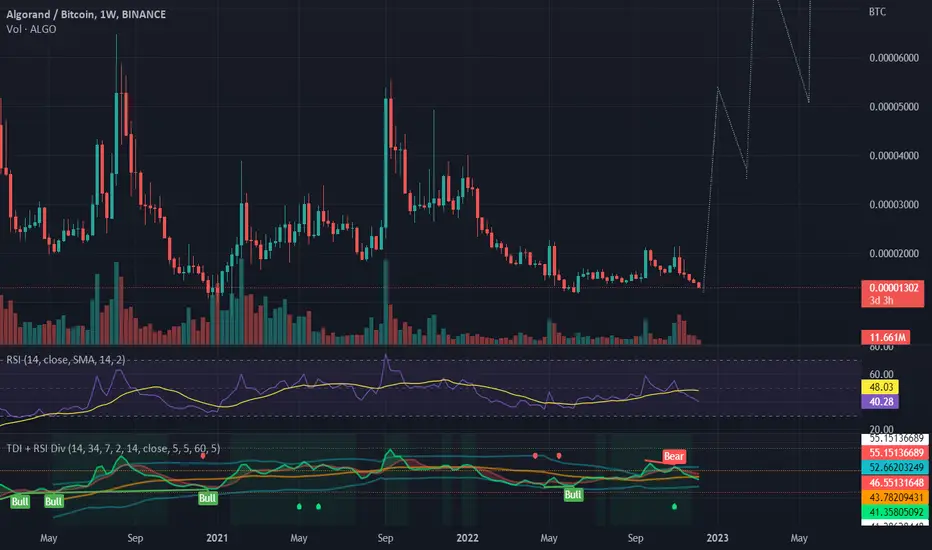
HBARBTC, bullish? or fake again!Look Who It Is!
Friends always ask me: Danial, why do you choose a weekly time frame in your analysis? I say it's correctness for the trend analysis.
After all, In this job, Nothing is certain.
As you can see on the indicator, the price passes the trendline and back again below the trend. (fake out is shown by a blue circle).
Besides, a divergence shows up on the daily and weekly timeframe.
In my analysis, the price will range in the green zone for a few days or go down straight and touch the red line. (I'm bullish on Algo but at BTC pair).
Please like and remark it makes progress in my work and prepares faultless analyses for your dear ones.
BINANCE:ALGOUSDT
BINANCE:BTCUSDT

ALGO/BTC - Algorand: Falling_Wedge◳◱ We've detected a Falling Wedge pattern on the $ALGO / $BTC chart. This pattern is a bullish indication and could indicate a potential trend reversal. The next resistance key levels are at 0.00000826 | 0.000009 | 0.00001016 and the major support zones are respectively at 0.0000071 | 0.00000668 | 0.00000552, We may consider buying at the current price zone at 0.00000738 and targetting higher levels.
◰◲ General info :
▣ Name: Algorand
▣ Rank: 39
▣ Exchanges: Binance, Kucoin, Huobipro, Bittrex, Kraken, Hitbtc
▣ Category/Sector: Infrastructure - Smart Contract Platforms
▣ Overview: Algorand is a scalable, secure, and decentralized digital currency and smart contract platform. Its protocol uses a variation of Proof-of-Stake (PoS) called Pure PoS (PPoS) to secure the network and reach consensus on block production. Unlike other PoS models, PPoS does not reward, nor does it put validator or user funds at risk of being slashed (a loss of funds used to promote honest node and user behavior). Algorand intends to eventually leverage its PPoS design to form the foundation for an on-chain governance system.
◰◲ Technical Metrics :
▣ Mrkt Price: 0.00000738 ₿
▣ 24HVol: 18.171 ₿
▣ 24H Chng: -0.135%
▣ 7-Days Chng: -10.79%
▣ 1-Month Chng: -21.83%
▣ 3-Months Chng: 19.53%
◲◰ Pivot Points - Levels :
◥ Resistance: 0.00000826 | 0.000009 | 0.00001016
◢ Support: 0.0000071 | 0.00000668 | 0.00000552
◱◳ Indicators recommendation :
▣ Oscillators: BUY
▣ Moving Averages: STRONG_SELL
◰◲ Technical Indicators Summary : SELL
◲◰ Sharpe Ratios :
▣ Last 30D: -2.72
▣ Last 90D: 1.30
▣ Last 1-Y: -1.08
▣ Last 3-Y: 0.65
◲◰ Volatility :
▣ Last 30D: 0.81
▣ Last 90D: 0.79
▣ Last 1-Y: 0.95
▣ Last 3-Y: 1.20
◳◰ Market Sentiment Index :
▣ News sentiment score is N/A
▣ Twitter sentiment score is 0.60 - Bullish
▣ Reddit sentiment score is 0.59 - Bullish
▣ In-depth ALGOBTC technical analysis on Tradingview TA page
▣ What do you think of this analysis? Share your insights and let's discuss in the comments below. Your like, follow and support would be greatly appreciated!
◲ Disclaimer
Please note that the information and publications provided are for informational purposes only and should not be construed as financial, investment, trading, or any other type of advice or recommendation. We encourage you to conduct your own research and consult with a qualified professional before making any financial decisions. The use of the information provided is solely at your own risk.
▣ Welcome to the home of charting big: TradingView
Benefit from a ton of financial analysis features, instruments and data. Have a look around, and if you do choose to go with an upgraded plan, you'll get up to $30.
Discover it here - affiliate link -

Algorand (ALGO) formed bullish Butterfly for upto 43.50% moveHi dear friends, hope you are well and welcome to the new trade setup of Algorand (ALGO) with BTC pair.
Our last successful trade of ALGO was as below:
Now on a daily time frame, ALGO has formed a bullish Butterfly move for another price reversal.
Note: Above idea is for educational purpose only. It is advised to diversify and strictly follow the stop loss, and don't get stuck with trade

ALGOBTCAlgorand looks good and I think we can trust it and publicly we see a positive movement in the coming days.

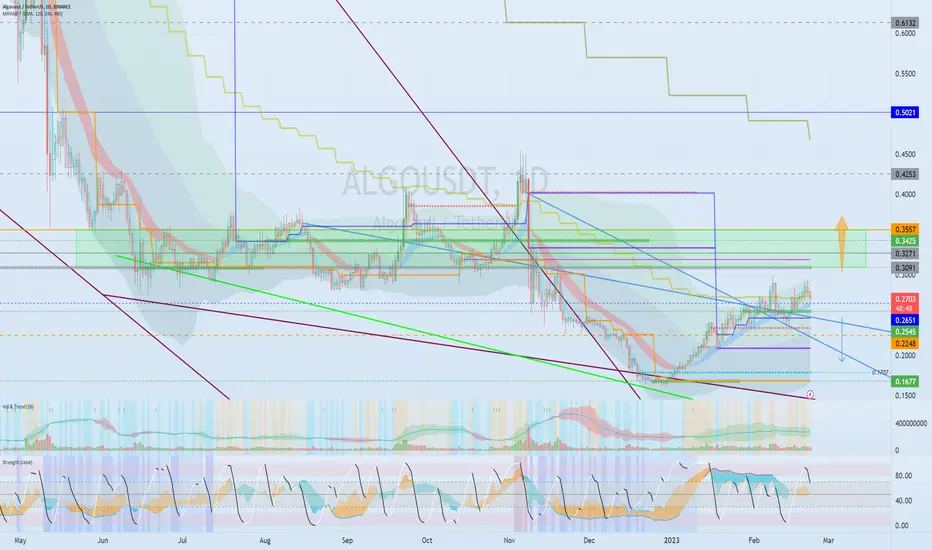
To turn into an uptrendHello?
Traders, welcome.
If you "Follow", you can always get new information quickly.
Please also click "Boost".
Have a good day.
-------------------------------------
(ALGOBTC 1W chart)
There is no power of ascension itself.
So, after March 13th, we need to see if it can rise above the downtrend line and rise above 0.0000 1448.
In order to dissipate the rising power, it must rise above 0.0000 1970 ~ 0.0000 2886.
Therefore, it is expected that the price should be maintained above 0.0000 1448 to start gaining momentum.
-------------------------------------------------- --
(ALGOUSDT 1D chart)
It is showing a move to break out of the mid- to long-term downtrend.
However, in order to turn into an uptrend, the price must be maintained above 0.3091-0.3557.
If it fails to do so and falls below the downtrend line, be cautious as there is a possibility of renewing lows.
-------------------------------------------------- -------------------------------------------
** All descriptions are for reference only and do not guarantee profit or loss in investment.
** If you share this chart, you can use the indicators normally.
** The MRHAB-T indicator includes indicators that indicate points of support and resistance.
** Check the formulas for the MS-Signal, HA-Low, and HA-High indicators at ().
(Short-term Stop Loss can be said to be a point where profit or loss can be preserved or additional entry can be made by split trading. This is a short-term investment perspective.)
---------------------------------

$ALGO/#BTC [#Algorand]: BBand_Breakout ◳◱ Hey traders, we've identified a Bollinger Band breakout on the $ALGO / $BTC chart. The price has moved outside of the upper Bollinger Band, which can indicate a potential bullish trend. The next resistance key levels are at 0.00001206 | 0.00001266 | 0.00001393 and the major support zones are respectively at 0.00001079 | 0.00001012 | 0.00000885. We may consider buying at the current price zone 0.00001154 and targetting higher levels.
◰◲ Technical Metrics :
▣ Mrkt Price: 0.00001154 ₿
▣ 24HVol: 54.442 ₿
▣ 24hChng: 0.874%
◲◰ Pivot Points - Levels :
◥ Resistance: 0.00001206 | 0.00001266 | 0.00001393
◢ Support: 0.00001079 | 0.00001012 | 0.00000885
◱◳ Indicators recommendation :
▣ Oscillators: NEUTRAL
▣ Moving Averages: STRONG_BUY
◰◲ Technical Indicators Summary : BUY
◳◰ Market Sentiment Index :
▣ News sentiment score is N/A
▣ Twitter sentiment score is 0.53 - Bullish
▣ Reddit sentiment score is 0.38 - Bearish
▣ In-depth ALGOBTC technical analysis on Tradingview TA page
▣ What do you think of this analysis? Share your insights and let's discuss in the comments below. Your like, follow and support would be greatly appreciated!
◲ Disclaimer
Please note that the information and publications provided are for informational purposes only and should not be construed as financial, investment, trading, or any other type of advice or recommendation. We encourage you to conduct your own research and consult with a qualified professional before making any financial decisions. The use of the information provided is solely at your own risk.
▣ Welcome to the home of charting big: TradingView
Benefit from a ton of financial analysis features, instruments and data. Have a look around, and if you do choose to go with an upgraded plan, you'll get up to $30.
Discover it here - affiliate link -

ALGO LOOKS BULLISHHi, dear traders. how are you ? Today we have a viewpoint to BUY/LONG the ALGO symbol.
For risk management, please don't forget stop loss and capital management
When we reach the first target, save some profit and then change the stop to entry
Comment if you have any questions
Thank You

ALGO - 1H Bullish in the channelAlgorand has a perfect channel with incredible reactions on each trend line, as a result, we can trust this channel and enter a position with signals. (We haven't opened this position yet, we are monitoring the market and price signs.)


$ALGO/#BTC [#Algorand]: BBand_Breakout Hey traders, we've identified a Bollinger Band breakout on the $ALGO / $BTC chart. The price has moved outside of the upper Bollinger Band, which can indicate a potential bullish trend. The next resistance key levels are at 0.00001192 | 0.00001262 | 0.00001425 and the major support zones are respectively at 0.00001029 | 0.00000936 | 0.00000773. We may consider buying at the current price zone 0.0000119 and targetting higher levels.
Technical Metrics :
Current price: 0.0000119
24H Volume: 36.9450 Ƀ
24H Price change: 5.872%
- Pivot Points - Levels :
Resistance: 0.00001192 | 0.00001262 | 0.00001425
Support: 0.00001029 | 0.00000936 | 0.00000773
Indicators recommandation :
Oscillators: NEUTRAL
Moving Averages: STRONG_BUY
Technical Indicators Summary : BUY
- In-depth ALGOBTC technical analysis on > Tradingview TA page

$ALGO/#BTC [#Algorand]: ResistanceBreakout+ConfirmationWe've detected a Resistance Breakout and Confirmation on the $ALGO/$BTC chart. The price has broken above a key resistance level and has been confirmed by a strong candle, indicating a potential bullish trend. The next resistance key levels are at 0.00001157 | 0.00001213 | 0.00001337 and the major support zones are respectively at 0.00001033 | 0.00000965 | 0.00000841. We may consider entering a trade at the current price zone at 0.00001104 and targetting higher level.
- Technical Metrics Index:
-- Current price: 0.00001104
-- 24H Volume: 48.4664 BTC
-- 24H Price change: 7.498%
- Pivot Points - Levels:
-- Resistance: 0.00001157 | 0.00001213 | 0.00001337
-- Support:0.00001033 | 0.00000965 | 0.00000841
- Indicators recommandations:
-- Oscillators: BUY
-- Moving Averages: STRONG_BUY
--Summary: BUY

Algorand (ALGO) formed bullish Gartley | A good buy opportunityHi dear friends, hope you are well and welcome to the new trade setup of Algorand (ALGO).
Previously we caught more than 53% pump of ALGO as below:
Now a 4-hr time frame, ALGO has formed a bullish Shark pattern for another pump soon.
Note: Above idea is for educational purpose only. It is advised to diversify and strictly follow the stop loss, and don't get stuck with trade

ALGO WAVESHello, I hope you are well
I think the pattern is inside a diametric diamond, which still has wave e, f, and g, and the price correction of this symbol is not over. I have such a view on this symbol for a short time
Comment if you have any questions
Thank You

algo can go upHi, dear traders. how are you ? Today we have a viewpoint to BUY/LONG the ALGO symbol.
For risk management, please don't forget stop loss and capital management
When we reach the first target, save some profit and then change the stop to entry
Comment if you have any questions
Thank You

ALGOUSDT whats next?Hello Birdies,
This is a long term analysis, as we have marked the flip resistance in red ALGO should test it in order to have a pump.
Algo Approaching it fast and after this it will be available in 96%-97% discount.

ALGO CAN DROP MOREI hope you are fine.
I have identified a diamond diametric for this symbol in this time frame. It seems that only the g wave of this diametric remains, which can move down after completion.
The red resistance box seems like a good place to end this diametric

Algorand. Its timeWashing weaker hands out, and now its time to show what this coin is worth. Market is always cyclical.
ALGO ALGO is really close to start wave B ( bullish )
after getting B it might break the top but be carful because will get C and it is long as wave A
peace :)

NagalrandThe Naga 2.0
NGC dumped to as low as half a cent and with less than 100 million supply, imagine how low Algo could go with a 10 billion coin supply
back in the days Naga was being shilled by Tony Vays and Formula 1 of all people,
twitter.com
ah yes, the FIFA pump is coming
twitter.com
