ALGO Loading up for a move! Here's a quick look at ALGO 30 min chart. As we can see, the price has been forming a symmetrical triangle and we will see a breakout soon! Keep an eye on this setup!
The best entry would be when the price breaks above 0.302$ with a good amount of volume.
-------------------------------------------
The idea is: Buy when the price breaks above 0.302$ and take profits at the levels shown in the chart.
Targets:
1. 0.306$
2. 0.31$
3. 0.327$
-------------------------------------------
What are triangles when it comes to trading?
Key points:
"1. In technical analysis , a triangle is a continuation pattern on a chart that forms a triangle-like shape.
2. Triangles are similar to wedges and pennants and can be either a continuation pattern if validated or a powerful reversal pattern, in the event of failure.
3. three potential triangle variations can develop as price action carves out a holding pattern, namely ascending, descending, and symmetrical triangles."
-------------------------------------------
If you like the content, then make sure to comment and like the post :D
Follow me for daily profitable trading setups
BTC dictates the market. If BTC falls, then Alts will fall as well. Trade safe!
ALGOBTC

ALGO's remarkable growth!ALGO has registered a growth of 11% in the last 24 hours. The price of this currency, which is in a range trend in the daily time frame, broke (fake) its support level in the range of 0.26 to 0.28 dollars. The support of buyers has led to the return of high prices in this area. Therefore, we expect a good reaction in case of a pullback to this area. The overall trend momentum is still bearish, and there is selling pressure in the market. The price trend of this currency is upward in the 1-hour time frame, but considering the range of the trend in the 4-hour time frame and the resistance in the range of 0.32 to 0.33 dollars, we expect a negative reaction to this range. For the next week, if this currency returns above the range of $0.36, it is likely that we can see an upward trend in the 4-hour time frame.

Keep an eye on ALGO! World Cup starting this weekend!Here's a quick Look at ALGO 2 hr chart. As we can see, the price has been forming an inv. head and shoulder pattern and we could see a break above the neckline soon - It all depends on BTC! Also, World Cup starting this weekend - we should expect some movement from ALGO!
The best entry would be when the price breaks above 0.285$ with a good amount of volume. One to keep an eye on.
-------------------------------------------
The idea is: Buy when the price breaks above 0.285$ and take profits at the levels shown in the chart.
Targets:
1. 0.293$
2. 0.3$
3. 0.318$
4. 0.338$
-------------------------------------------
What are triangles when it comes to trading?
Key points:
"1. In technical analysis, a triangle is a continuation pattern on a chart that forms a triangle-like shape.
2. Triangles are similar to wedges and pennants and can be either a continuation pattern if validated or a powerful reversal pattern, in the event of failure.
3. three potential triangle variations can develop as price action carves out a holding pattern, namely ascending, descending, and symmetrical triangles."
-------------------------------------------
If you like the content, then make sure to comment and like the post :D
Follow me for daily profitable trading setups
BTC dictates the market. If BTC falls, then Alts will fall as well. Trade safe!

Algorand (ALGO) - November 16Hello?
Traders, welcome.
If you "Follow", you can always get new information quickly.
Please also click "Boost".
Have a good day.
-------------------------------------
(ALGOBTC 1W chart)
In order to gain the power to rise, it must rise in the 0.0000 1970 ~ 0.0000 2452 section and show support.
----------------------------------------
(ALGOUSDT 1W Chart)
The key question is whether it can rise to the 0.4253-0.6132 range.
To do that, we need to see if it can rise above 0.3310.
(1D chart)
Below 0.3310 is likely de facto long-term investment territory.
Therefore, it is important to keep the price moving above 0.3310 quickly.
If not, a decline below 0.2140 is likely.
-------------------------------------------------- -------------------------------------------
** All descriptions are for reference only and do not guarantee profit or loss in investment.
** If you share this chart, you can use the indicators normally.
** The MRHAB-T indicator includes indicators that indicate points of support and resistance.
** SR_R_C indicators are displayed as StochRSI (line), RSI (columns), and CCI (bgcolor).
** The CCI indicator is displayed in the overbought section (CCI > +100) and oversold section (CCI < -100).
(Short-term Stop Loss can be said to be a point where profit or loss can be preserved or additional entry can be made by split trading. This is a short-term investment perspective.)
---------------------------------

ALGO/USDT - LONG 12H TF----- Welcome, dear followers! -----
- Here is my trading methodology. I trade with a normal system and analysis of resistance and support, as well as price reversal patterns.
- For the record, I do not place a stop loss within my trades. So that I only risk 1.5% of my total capital in order to support the loss due to a price reversal against me.
- If a price reversed against my expectation and touched the drawn line r3, then I transferred targets to the entry point and waited for the price to close at it with a loss equal to almost zero.
- Today's deal is shown in the chart, and here are the entry and exit points below.
-- Support me with numbers and follow up on my account for other deals in the future. Thank you for coming to this part. --
-------------------------------------------------------
⚡️⚡️ #ALGO/USDT ⚡️⚡️
Client: My-Binance Futures
Trade Type: Breakout (Long)
Leverage: Cross (2X)
Entry Targets:
1) 0.4550 - 100.0%
Take-Profit Targets:
1) 0.4843 - 20.0%
2) 0.5297 - 20.0%
3) 0.6062 - 20.0%
4) 0.6742 - 20.0%
5) 0.7319 - 20.0%
Trailing Configuration:
Entry: Percentage (0.0%)
Take-Profit: Percentage (0.0%)
Stop: Breakeven -
Trigger: Percent (10.0%)

Algorand (ALGO) - November 5Hello?
Welcome, traders.
By "following", you can always get new information quickly.
Please also click "Boost".
Have a good day.
-------------------------------------
(ALGOUSDT 1W Chart)
The key is whether it can be supported by rising to the 0.4253-0.6132 section.
(1D chart)
The key is whether it can find support near 0.3853 and move above 0.4253.
If it doesn't, it is likely to drop to around 0.3421.
A volume profile section is formed over the section 0.4253-0.6132.
Therefore, if it rises above this section, it is expected to show a full-fledged upward trend.
------------------------------------------------------------ -------------------------------------------
** All descriptions are for reference only and do not guarantee a profit or loss in investment.
** If you share this chart, you can use the indicators normally.
** The MRHAB-T indicator contains indicators that indicate support and resistance points.
** HA SRRC indicators are expressed as StochRSI(line), RSI(columns), CCI(bgcolor).
** CCI indicator is expressed as overbought range (CCI > +100) and oversold range (CCI < -100).
(Short-term Stop Loss can be said to be a point where profit and loss can be preserved or additional entry can be made through split trading. It is a short-term investment perspective.)
---------------------------------

The best day to buy Algorand, 2016 repeat, end of altbear marketNotice the repeating pattern from March 29th Midnight GMT. This is the bottom. Alt season is about to start as Bitcoin Dominance plummets. Ripple and Institutional Blockchains like Algorand and Vechain are about to take over the space.
This is it, the great reset is set to start as early as March of 2021. Check IMF reports, a massive Gold sell off is coming.

Algorand Diamond BottomAnother idea that I have is algo diamond bottom pattern, in addition to my old idea of brodeading bottom pattern posted months ago. On logarithmic chart you can see the target, according to textbooks.
ps\ FIFA is in November, in case if anyone needs the news to justify that possible price increase.

Algorand (ALGO) - October 18Hello?
Welcome, traders.
By "following", you can always get new information quickly.
Please also click "Boost".
Have a good day.
-------------------------------------
(ALGOUSDT 1W Chart)
The key is whether it can rise above the 0.3310-0.4253 section.
(1D chart)
The key is whether it can be supported by rising above the 0.3310-0.3425 section.
In order to continue the uptrend, it must rise above the 0.3722-0.3938 section.
If it goes down, you should check to see if it finds support at the 0.2865-0.3091 zone.
The 0.3310 point or lower is most likely a mid- to long-term investment area.
Therefore, it is important to keep the price above 0.3310.
However, since the volume profile section is formed around 0.4253, it is recommended to trade from a short-term perspective until it rises above 0.4253.
------------------------------------------------------------ -------------------------------------------
** All descriptions are for reference only and do not guarantee a profit or loss in investment.
** If you share this chart, you can use the indicators normally.
** The MRHAB-T indicator contains indicators that indicate support and resistance points.
** HA SRRC indicators are expressed as StochRSI(line), RSI(columns), CCI(bgcolor).
** CCI indicator is expressed as overbought range (CCI > +100) and oversold range (CCI < -100).
(Short-term Stop Loss can be said to be a point where profit and loss can be preserved or additional entry can be made through split trading. It is a short-term investment perspective.)
---------------------------------

Algorand (ALGO) - October 8Hello?
Welcome, traders.
By "following", you can always get new information quickly.
Please also click "Boost".
Have a good day.
-------------------------------------
(ALGOUSDT 1W Chart)
Whether or not it can move higher than 0.6704 is key.
To do this, it is necessary to check whether it is supported and ascends in the 0.3310-0.4253 section.
(1D chart)
We need to see if we can keep the price above 0.3310.
If it falls below the 0.2865-0.3091 range, there is a possibility that it will fall to around 0.2140.
------------------------------------------------------------ -------------------------------------------
** All descriptions are for reference only and do not guarantee a profit or loss in investment.
** If you share this chart, you can use the indicators normally.
** The MRHAB-T indicator contains indicators that indicate support and resistance points.
** SR_R_C indicators are displayed as StochRSI(line), RSI(columns), CCI(bgcolor).
** CCI indicator is expressed as overbought range (CCI > +100) and oversold range (CCI < -100).
(Short-term Stop Loss can be said to be a point where profit and loss can be preserved or additional entry can be made through split trading. It is a short-term investment perspective.)
---------------------------------

$Algo golden cross formation is about to begin don't miss!$$$Algo golden cross formation is about to begin. I recommend you all to watch this coin, which has a potential of 600 percent and more, the first stop is 0.4 cents. don't miss it. Good trades, not investment advice.

Algorand (ALGO) - September 29Hello?
Welcome, traders.
By "following", you can always get new information quickly.
Please also click "Like".
Have a good day.
-------------------------------------
(ALGOUSDT 1W Chart)
The key is whether you can support and move up in the 0.3310-0.4253 zone.
(1D chart)
0.4253 : volume profile point
0.3310: boundary point of the floor section
0.3091 : volume profile point
Therefore, it is important to be able to support and move up in the 0.3091-0.4253 zone.
As it has moved out of the mid- to long-term downtrend channel, if it finds support in the above area, I would expect a sharp move.
However, if it fails to find support and falls below 0.3091, I would expect it to fall below 0.2140.
However, as I mentioned in the description of the BTC chart, I think it is time for altcoins to gain support by increasing the BTC price by at least 20.7K.
Therefore, before that, it is recommended to trade conservatively when trading altcoins.
------------------------------------------------------------ -----------------------------------------------------
** All descriptions are for reference only and do not guarantee a profit or loss in investment.
** If you share this chart, you can use the indicators normally.
** The MRHAB-T indicator contains indicators that indicate support and resistance points.
** SR_R_C indicators are displayed as StochRSI(line), RSI(columns), CCI(bgcolor).
** CCI indicator is expressed as overbought range (CCI > +100) and oversold range (CCI < -100).
(Short-term Stop Loss can be said to be a point where profit and loss can be preserved or additional entry can be made through split trading. It is a short-term investment perspective.)
---------------------------------

algoStill thinking bottoms in as I alerted to my group back in early Sept like XRP back did bottom at .30c but if BTC nukes we could overthrow to that cluster of
support & resistance I marketed off in my highlighted circle for a capitulation event.

ALGOUSDT Buy Setup!ALGOUSDT Technical analysis update
Buy zone : $0.355 - $0.365
Stop loss : $0.324
TP 1 : $0.395
TP 2 : $0.431
TP 3 : $0.505
Always keep stop loss
Thanks
Hexa

Algorand (ALGO) - September 20Hello?
Welcome, traders.
By "following", you can always get new information quickly.
Please also click "Like".
Have a good day.
-------------------------------------
(ALGOUSDT 1W Chart)
The key is whether it can rise above the 0.3310-0.4478 section.
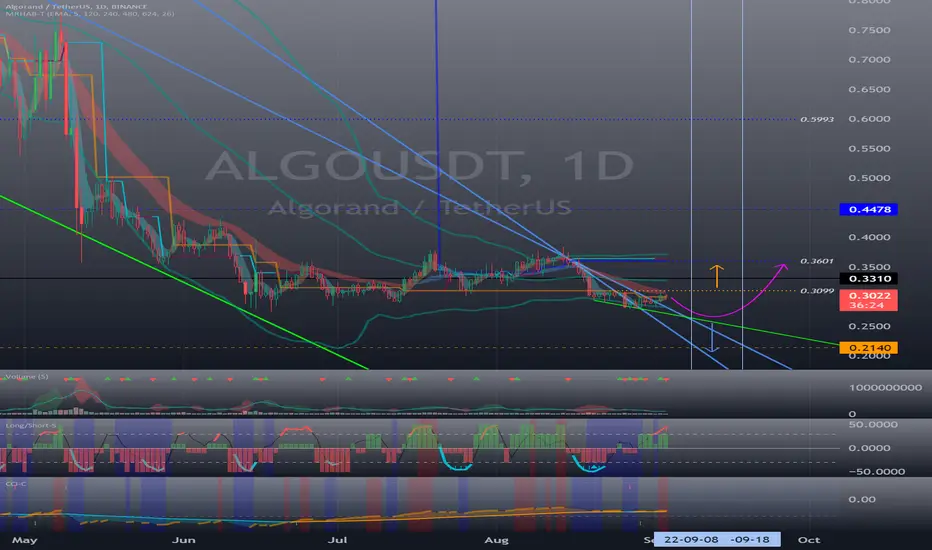
(1D chart)
The price needs to remain above 0.3099 to transition into an uptrend.
In order to continue the uptrend, it must rise above the 0.3642-0.3872 section.
If not, there is a possibility that it will fall to around 0.2140.
------------------------------------------------------------ -------------------------------------------
** All descriptions are for reference only and do not guarantee a profit or loss in investment.
** The MRHAB-T indicator, which is inactive on the chart, contains indicators that indicate support and resistance points.
** Background color of Long/Short-S indicator: RSI oversold and overbought sections
** Background color of CCI-C indicator: When the short-term CCI line is below -100 and above +100, oversold and overbought sections are displayed.
** The OBV indicator was re-created by applying a formula to the DepthHouse Trading indicator, an indicator disclosed by oh92. (Thanks for this.)
(Short-term Stop Loss can be said to be a point where profit and loss can be preserved or additional entry can be made through split trading. It is a short-term investment perspective.)
---------------------------------

ALGO/USDT
(Trend Line)
As the name implies, trend lines are levels used in technical analysis that can be drawn along a trend to represent either support or resistance, depending on the direction of the trend. Think of them as the diagonal equivalent of horizontal support and resistance.
Notice how shortly after breaking trend line resistance, the market came back to retest the trend line as new support and formed a bullish pin bar in the process.
This allowed price action traders to buy just before the market rallied for up trend

Algorand (ALGO) - September 4Hello?
Welcome, traders.
By "following", you can always get new information quickly.
Please also click "Like".
Have a good day.
-------------------------------------
(ALGOUSDT 1W Chart)
The 0.3310 point is an important support and resistance point, and whether we can move higher than 0.3310 is crucial.
(1D chart)
It is mixed, so you need to be careful with your trade.
Therefore, it is necessary to confirm whether it can be supported by rising above the 0.3310 point.
- In order to continue the upward trend from the current position, it must rise above 0.3601.
- For those who are investing in ALGO, we recommend that you take the time to trade to increase the number of coins (tokens) you have.
From a mid- to long-term perspective (at least 6 months to 1 year or more), a large uptrend is expected.
------------------------------------------------------------ -------------------------------------------
** All descriptions are for reference only and do not guarantee a profit or loss in investment.
** The MRHAB-T indicator, which is inactive on the chart, contains indicators that indicate support and resistance points.
** Background color of Long/Short-S indicator: RSI oversold and overbought sections
** Background color of CCI-C indicator: When the short-term CCI line is below -100 and above +100, oversold and overbought sections are displayed.
** The OBV indicator was re-created by applying a formula to the DepthHouse Trading indicator, an indicator disclosed by oh92. (Thanks for this.)
(Short-term Stop Loss can be said to be a point where profit and loss can be preserved or additional entry can be made through split trading. It is a short-term investment perspective.)
---------------------------------
Algorand Bullish Broadening Bottom 2022Same idea, from 2021. Algorand is still forming a broadening bottom pattern, prefectly according to the textbook.

Algorand (ALGO) - August 23Hello?
Welcome, traders.
By "following", you can always get new information quickly.
Please also click "Like".
Have a good day.
-------------------------------------
(ALGOUSDT 1W Chart)
The key is whether it can rise above 0.3310 and find support.
(1D chart)
If it does not rise above the 0.3099-0.3310 section, there is a possibility that it will fall to around 0.2140.
- Since the RSI, Stoch RSI, and CCI(9) indicators have all entered the oversold zone, if they start to break out of the oversold zone, it is likely to lead to a big rise.
To do that, you need to find support at or above the 0.3099-0.3310 range when you break out of the oversold zone.
If it doesn't and it's finding resistance as it is now, it's likely to lead to further declines.
------------------------------------------------------------ -------------------------------------------
** All descriptions are for reference only and do not guarantee a profit or loss in investment.
** The MRHAB-T indicator, which is inactive on the chart, contains indicators that indicate support and resistance points.
** Background color of Long/Short-S indicator: RSI oversold and overbought sections
** Background color of CCI-C indicator: When the short-term CCI line is below -100 and above +100, oversold and overbought sections are displayed.
** The OBV indicator was re-created by applying a formula to the DepthHouse Trading indicator, an indicator disclosed by oh92. (Thanks for this.)
(Short-term Stop Loss can be said to be a point where profit and loss can be preserved or additional entry can be made through split trading. It is a short-term investment perspective.)
---------------------------------

ALGORAND to $100 (£82) BY 2026?- IS20022 COMPLIANT crypto
- Fast and cheap to move money!
- Partnering up with FIFA 2022!

ONLY NEEDED GRAPH FOR NEXT 4 MONTHS *ALGO / USDT" *ALGORANT*On graph we see possible longer term price rebound.
White marks describes fakeouts out of 77MA on 1D and possible real breakout at this prices.
Then we see resistances marked by red line and target areas for next price movements.
Hoping and wishing you guys the best trades.
Share you opinion and boost the idea, Thanks.

Algorand (ALGO) - August 12hello?
Welcome, traders.
If you "follow", you can always get new information quickly.
Please also click "Like".
Have a good day.
-------------------------------------
(ALGOUSDT 1M Chart)
The key is whether the price can be maintained above 0.3310.
(1W chart)
The key is whether it can find support at the 0.3310-0.4478 zone and move higher than 0.6704.
- The RSI indicator is out of the oversold zone, but the Stoch RSI indicator is entering the overbought zone, so it is expected to show a mixed trend.
(1D chart)
It seems likely that a trend will form in a direction that deviates from the 0.3099-0.3872 range.
A move above 0.3872 is expected to rise above 0.4478.
However, holding the price above 0.3310 is expected to lead to an attempt to move higher above 0.3872.
If it falls below 0.3099, it is expected to decline to around 0.2140.
Therefore, if it falls below 0.3099 and resists, a stop loss is required to secure cash.
------------------------------------------------------------ -------------------------------------------
** All descriptions are for reference only and do not guarantee a profit or loss in investment.
** The MRHAB-T indicator, which is inactive on the chart, contains indicators that indicate support and resistance points.
** Background color of Long/Short-S indicator: RSI oversold and overbought sections
** Background color of CCI-C indicator: When the short-term CCI line is below -100 and above +100, oversold and overbought sections are displayed.
** The OBV indicator was re-created by applying a formula to the DepthHouse Trading indicator, an indicator disclosed by oh92. (Thanks for this.)
(Short-term Stop Loss can be said to be a point where profit and loss can be preserved or additional entry through split trading. It is a short-term investment perspective.)
---------------------------------
Algorand (ALGO) - July 31Hello?
Welcome, traders.
If you "follow", you can always get new information quickly.
Please also click "Like".
Have a good day.
-------------------------------------
(ALGOUSDT 1W Chart)
The key is whether it can find support and move higher near 0.3319.
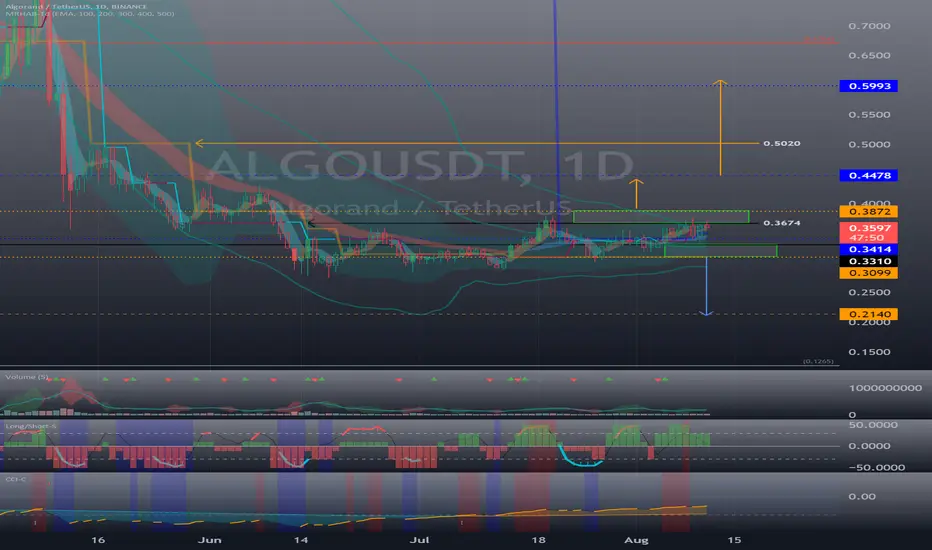
(1D chart)
Primary resistance: 0.3872-0.4478
Secondary resistance: 0.5993-0.6704
Support: 0.3099-0.3319
If it finds support above the HA-High indicator of 0.3414, I would expect it to move higher.
A break below 0.3099 to find resistance is expected to lead to further declines.
------------------------------------------------------------ -------------------------------------------
** All descriptions are for reference only and do not guarantee a profit or loss in investment.
** The MRHAB-T indicator, which is inactive on the chart, contains indicators that indicate support and resistance points.
** The OBV indicator was re-created by applying a formula to the DepthHouse Trading indicator, an indicator disclosed by oh92. (Thanks for this.)
(Short-term Stop Loss can be said to be a point where profit and loss can be preserved or additional entry through split trading. It is a short-term investment perspective.)
---------------------------------
