ALGOUSDT Is Ready to PumpAfter breakout event in ALGOBTC chart (please see the following link), it seems that ALGOUSDT is preparing to reach targets higher than $4 by the end of the year.
ALGOBTC

ALGOBTC Upward Breakout (Buy Signal)It seems that ALGOBTC chart is breaking out the triangle pattern from its top edge. If such a breakout gets fixed, it may be considered as BUY or LONG SIGNAL on ALGOBTC chart by the end of the year (please see my ALGOUSDT analysis too)

Algorand is almost ready to flyYesterday is history, tomorrow is a mystery. If this plays out, we can expect to see the start of the long awaited Altcoin Season in September, a first wave peak around October 2nd and a peak of second wave around November 25th.

ALGO: break out imminent !!The break out is imminent (days not weeks).
End of a 2 year long bullish descending wedge. Price is touting the resistance for 2 months now !
Strong positive divergence on the RSI (green line).
Historic Volatility COMPRESSION !! At the same time that volatility is reaching the end of the funnel, price is trying to break out !!
RESOLUTION is IMMINENT !!

Altseason has officially started"September 18 will change everything and be the catalyst Algorand needs. Opulous at the most popular venue in the world announcing to the world “We go with Algorand” and then the huge musical artist. The world will listen. Then governance in October. Then AlgoMint, TinyMan, and AlgoDEX by end of year… maybe xBacked too. Some surprises possibly in between.. and hopefully CBDC. The rest of the year is ripe for gains and growth of the ecosystem"
Michael Jordan in "I believe I can fly" featuring MC Hammer who "can't touch this".

ALGO: getting ready !ALGO has been bouncing around for more than 2 years, trying to find a bottom.
Despite not being at the point of an imminent break out, ALGO is getting ready to launch.
The rising RSI has been forming a bullish divergence for a long time !!


ALGOBTC and its Bullish DivergenciesAs always, simple idea & simple chart, enjoy. Been waiting for this so long, I guess this is the time.

Algorand (ALGO) - august 10Hello?
Welcome, traders.
By "following", you can always get new information quickly.
Please also click "Like".
Have a nice day.
-------------------------------------
(ALGOUSD 1W Chart)
If the price is maintained above the 0.5221395-0.76754798 range, it is expected to create a new wave.
(1D chart)
If the price is maintained in the 0.65798713-0.92350974 range, it is expected to turn into an uptrend.
However, in order to continue the uptrend, it must break out of the downtrend line.
If it goes down, you should check to see if it finds support at the 0.52522584-0.65798713 zone.
-------------------------------------
(ALGOBTC 1W chart)
We are walking sideways in the section 1075 Satoshi-6469 Satoshi.
If the price is maintained above the 1970 satoshi-2886 satoshi range, it is expected to turn into an upward trend.
To continue the uptrend, it must rise above the 4309 Satoshi point.
If it rises above the 6469 Satoshi point, it is expected to create a new wave.
(1D chart)
If it finds support at the 1820 satoshi point and moves above the 2147 satoshi point, I would expect it to turn into an uptrend.
If the volume profile section spanning the 2452 Satoshi-2886 Satoshi section is exceeded upward, it is expected to continue the upward trend.
If it falls from the 1820 Satoshi point, it may enter the mid- to long-term investment area, so careful trading is required.
------------------------------------------
We recommend that you trade with your average unit price.
This is because, if the price is below your average unit price, whether it is in an uptrend or in a downtrend, there is a high possibility that you will not be able to get a big profit due to the psychological burden.
The center of all trading starts with the average unit price at which you start trading.
If you ignore this, you may be trading in the wrong direction.
Therefore, it is important to find a way to lower the average unit price and adjust the proportion of the investment, ultimately allowing the funds corresponding to the profits to regenerate themselves.
------------------------------------------------------------ -----------------------------------------------------
** All indicators are lagging indicators.
Therefore, it is important to be aware that the indicator moves accordingly with the movement of price and volume.
However, for the sake of convenience, we are talking in reverse for the interpretation of the indicator.
** The wRSI_SR indicator is an indicator created by adding settings and options to the existing Stochastic RSI indicator.
Therefore, the interpretation is the same as the traditional Stochastic RSI indicator. (K, D line -> R, S line)
** The OBV indicator was re-created by applying a formula to the DepthHouse Trading indicator, an indicator disclosed by oh92. (Thanks for this.)
** See support, resistance, and abbreviation points.
** Support or resistance is based on the closing price of the 1D chart.
** All descriptions are for reference only and do not guarantee a profit or loss in investment.
Explanation of abbreviations displayed in the chart
R: A point or section of resistance that requires a response to preserve profits.
S-L: Stop Loss point or section
S: A point or section where you can buy to make a profit as a support point or section.
(Short-term Stop Loss can be said to be a point where profit and loss can be preserved or additional entry can be made through split trading. It is a short-term investment perspective.)
GAP refers to the difference in prices that occurred when the stock market, CME, and BAKKT exchanges were closed because they are not traded 24 hours a day.
G1 : Closing price when closed
G2: Opening price
(Example) Gap (G1-G2)


Algo possible bull flag and descending triangle breakout?In this analysis we will be going over algorand flag pattern that could potentially be breaking ALGO out of the larger descending triangle .
Algo has recently triple bottomed, is currently forming a bull flag and is looking to jump out of a descending triangle . If the top of the bull flag resistance line is popped the price action will head upward the same length of the bull flags pole. This would break the price action out above the macro pattern of the descending wedge pattern we have been in for 2.5 months.
Currently the price action is bouncing off of the .5 fib line after the retrace from the recent high (the resistance line of the descending triangle ) that helped formed the macro descending triangle formation Algo is currently in.
This one looks ready to move as long as Bitcoin plays nicely.
Have a green and prosperous week!


Algorand (ALGO) - July 18Hello?
Welcome, traders.
If you "follow", you can always get new information quickly.
Please also click "Like".
Have a good day.
-------------------------------------
(ALGOUSD 1W Chart)
If the price holds above the 0.76754798 point, we expect the uptrend to continue.
(1D chart)
If the price is maintained in the 0.65798713-0.92350974 range, it is expected to turn into an upward trend.
If it falls in the range of 0.52522584-0.65798713, there is a possibility of entering the mid- to long-term investment area, so careful trading is required.
A move above the 0.92350974 point would suggest a move to break above the downtrend line.
-------------------------------------
(ALGOBTC 1W chart)
If it rises in the sideways section of 1075 Satoshi-4309 Satoshi, it is expected to create a new wave.
(1D chart)
If the price is maintained in the 2374 Satoshi-2792 Satoshi section, it is expected that the upward trend will continue.
If it falls from the 2374 satoshi point, it can touch the 1747 satoshi-1956 satoshi section, so Stop Loss is necessary to preserve profit and loss.
However, since it will be located within the section that previously showed the volatility of the 716 Satoshi-3888 Satoshi section, you need to think about how to set up a buying opportunity.
------------------------------------------
We recommend that you trade with your average unit price.
This is because, if the price is below your average unit price, whether it is in an uptrend or in a downtrend, there is a high possibility that you will not be able to get a big profit due to the psychological burden.
The center of all trading starts with the average unit price at which you start trading.
If you ignore this, you may be trading in the wrong direction.
Therefore, it is important to find a way to lower the average unit price and adjust the proportion of the investment, ultimately allowing the funds corresponding to the profits to regenerate themselves.
------------------------------------------------------------ -----------------------------------------------------
** All indicators are lagging indicators.
Therefore, it is important to be aware that the indicator moves accordingly as price and volume move.
However, for the sake of convenience, we are talking in reverse for the interpretation of the indicator.
** The wRSI_SR indicator is an indicator created by adding settings and options to the existing Stochastic RSI indicator.
Therefore, the interpretation is the same as the traditional Stochastic RSI indicator. (K, D line -> R, S line)
** The OBV indicator was re-created by applying a formula to the DepthHouse Trading indicator, an indicator disclosed by oh92. (Thanks for this.)
** See support, resistance, and abbreviation points.
** Support or resistance is based on the closing price of the 1D chart.
** All descriptions are for reference only and do not guarantee a profit or loss in investment.
Explanation of abbreviations displayed in the chart
R: A point or section of resistance that requires a response to preserve profits.
S-L : Stop Loss point or section
S: A point or section where you can buy to make a profit as a support point or section
(Short-term Stop Loss can be said to be a point where profit and loss can be preserved or additional entry can be made through split trading. It is a short-term investment perspective.)
GAP refers to the difference in prices that occurred when the stock market, CME, and BAKKT exchanges were closed because they are not traded 24 hours a day.
G1 : Closing price when closed
G2: Opening price
(Example) Gap (G1-G2)


Algorand Ranked Top 3 Worth Trillions: Altseason RoadmapNote from the future: How did $Algo end up dominating 20% of the total market capital in crypto out of 10 trillion reichsmarks in the bubble peak while it doubled its supply through 2021? I wish I had known so I could've bought some under a dollar, I would be king in times of depression. Irrational Roaring Market, how was I supposed to know Mastercard, paypal, facebook, amazon, visa and 16 governments were going to use this technology, how was I supposed to know CBDCs would be launched in 2022. How was I supposed to know the digital dollar was being introduced in a myserious MIT project. I'm just backward rationalizing here, nobody could anyone know, it was impossible to know at the time.

$ALGO Long or Short? DAILY UPDATEBullish indicators: Breakout & retest of orange wedge as support. If it breaks out with force chances are we could see it make a nice lil run without the retest
Bearish indicators: Sitting in a larger wedge which shows signs that we could see another retest on the downside

ALGOUSD about to complete wave 4So far EW count on Algorand looks reasonable. Wave 5 could be extended, since wave 3 was not. Let's see how this plays out.
Please remember, that alternative cryptocurrencies (altcoins) are depending heavily on Bitcoin.

December 2016 Trend: Consolidation followed by ALTSEASONI underestimated Bittorrent and a few other Alts that have already surprised out of nowhere, when comparing a few patterns it's clear to where the top 100 mid cap alt will start to display similar 2017 price action in 3 waves over a 12 month range in correlation to Bitcoin.
When it comes to Algorand, it's obvious to see we're too early.


Algorand (ALGO) - June 15Hello?
Welcome, traders.
By "following", you can always get new information quickly.
Please also click "Like".
Have a good day.
-------------------------------------
(ALGOUSD 1W Chart)
If the price holds above the 0.76754798 point, we expect the uptrend to continue.
(1D chart)
We need to see if we can move higher from the 0.92350974-1.18903235 zone and move above the downtrend line.
If it finds support by moving up to the 1.18903235-1.32179365 section, it is expected to lead to further upside.
However, if it declines, it is expected that the downward trend will continue, so careful trading is required.
-------------------------------------
(ALGOBTC 1W chart)
To create a new wave, it must rise above the 4309 Satoshi point.
It remains to be seen if support at the 2452 Satoshi point can be found and continue the uptrend along the uptrend line.
If it falls below the 1970 Satoshi point, it may take a long time to rise as it enters the mid- to long-term investment area.
Therefore, careful trading is required.
(1D chart)
It remains to be seen if we can climb to the 2792 satoshi-3000 satoshi section.
If it falls from the 2374 Satoshi point, Stop Loss is required to preserve profit and loss.
If it does not fall below the downtrend line, it is likely to rise, so careful trading is required.
------------------------------------------
We recommend that you trade with your average unit price.
This is because, if the price is below your average unit price, whether it is in an uptrend or in a downtrend, there is a high possibility that you will not be able to get a big profit due to psychological burden.
The center of all trading starts with the average unit price at which you start trading.
If you ignore this, you may be trading in the wrong direction.
Therefore, it is important to find a way to lower the average unit price and adjust the proportion of the investment, ultimately allowing the funds corresponding to the profits to regenerate themselves.
------------------------------------------------------------ -----------------------------------------------------
** All indicators are lagging indicators.
Therefore, it is important to be aware that the indicator moves accordingly with the movement of price and volume.
However, for the sake of convenience, we are talking in reverse for the interpretation of the indicator.
** The wRSI_SR indicator is an indicator created by adding settings and options to the existing Stochastic RSI indicator.
Therefore, the interpretation is the same as the traditional Stochastic RSI indicator. (K, D line -> R, S line)
** The OBV indicator was re-created by applying a formula to the DepthHouse Trading indicator, an indicator disclosed by oh92. (Thanks for this.)
** See support, resistance, and abbreviation points.
** Support or resistance is based on the closing price of the 1D chart.
** All descriptions are for reference only and do not guarantee a profit or loss in investment.
Explanation of abbreviations displayed in the chart
R: A point or section of resistance that requires a response to preserve profits.
S-L: Stop Loss point or section
S: A point or section where you can buy to make a profit as a support point or section.
(Short-term Stop Loss can be said to be a point where profit and loss can be preserved or additional entry can be made through split trading. It is a short-term investment perspective.)
GAP refers to the difference in prices that occurred when the stock market, CME, and BAKKT exchanges were closed because they are not traded 24 hours a day.
G1 : Closing price when closed
G2: Opening price
(Example) Gap (G1-G2)

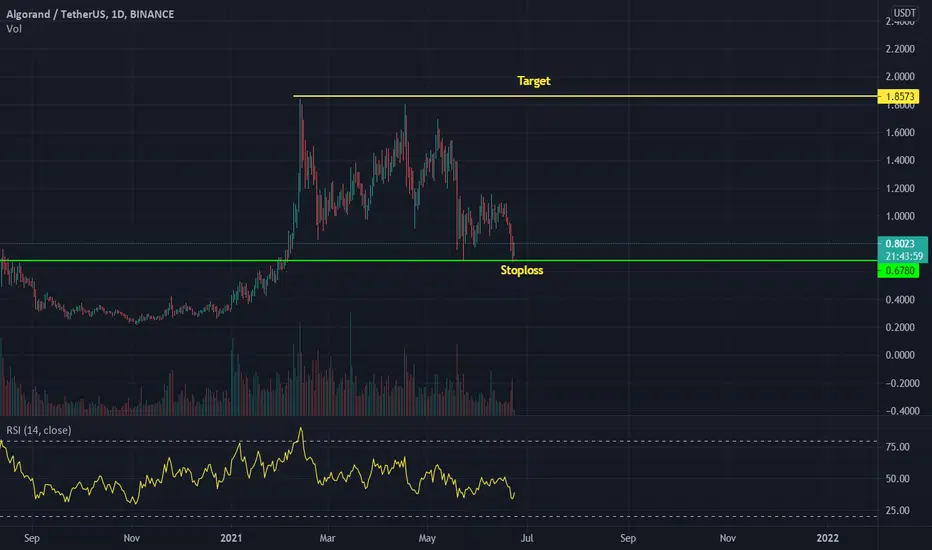
Algo going to correct ... time to short✅ short: 1.10 - 1.25 ✅
🎯TARGETS:
1- 80 cent
2- 73 cent
3- 65 cent
💵 Trade Size: 3-5% of Portfolio - leverage: X3
🚫Invalidation(SL): 1.39
please click LIKE button and Appreciate my hard work.
Must follow me for latest crypto real time updates.
Thank you.

