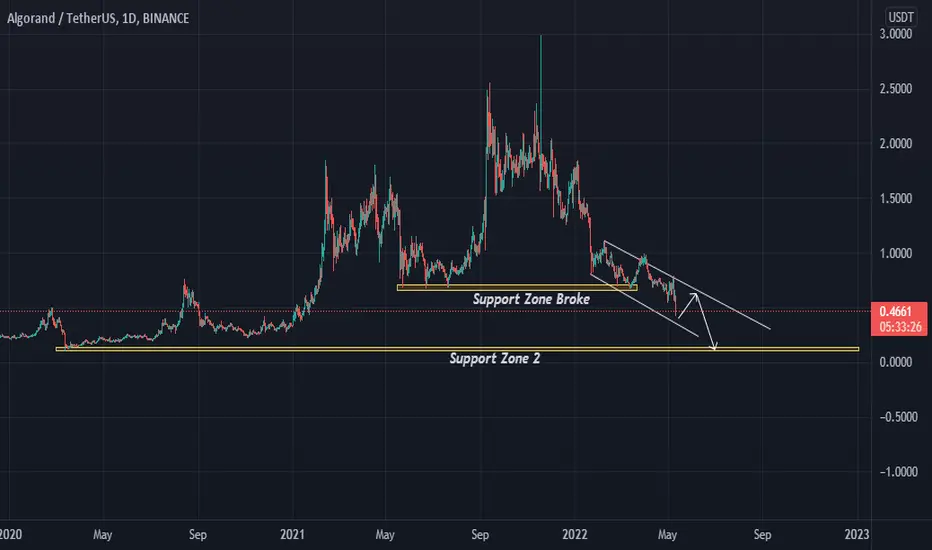
ALGORAND ALGO/USDT i saw Bearish Flag on this coin im Short on ALGO and waiting for next Support zone 2 good luck!
Algorand
ALGORAND - 0,519 is MAJOR ResistanceALGORAND but not just ALGORAND as the whole market has taken a SERIOUS beating; has had severe losses
This is our updated chart which shows 0,519 being a serious Resistance.
We would prefer to be short with a stop loss at 0,53 for now, or prefer to Buy over 0,519 (or lower at 0,31 and 0,20 doomsday prices).
Market is still in grave danger.
One Love,
the FXPROFESSOR

ALGORAND; ALGOIn search of support...
Seem's like this bad boy doesn't want to brake yet. The mudslide of BTC clearly is not helping either.

ALGOGUSD (Long Term Buy?) Scaling InScaling in to obtain best asset prices:
We are looking to acquire assets to hold long term as the markets are selling off and the SPX and ES breaking through the 4,000 level while the DXY may test new highs. We do this by scaling in slowly to obtain an attractive weighted average price in selected cryptos. For this to work, you need to be VERY TIGHT in your entries and sizes, and not chase the markets.
One of the assets we are looking to acquire is Algorand (ALGOUSD) which from their website, is "the world's most decentralized, scalable, and secure blockchain infrastructure, that is capable of powering anything from decentralized finance to generative NFT art, powering future economic models."
Reminders:
1) Unless you are selling puts, it is more difficult to protect yourself from the downside in cryptos and create a margin of safety by selling DOTM puts on lower strikes for protection.
2) Cryptos are more risky therefore portfolio allocation and trade sizes are of critical importance.
Levels where we are looking to buy.
We are looking make small purchases in the 25 to 50 cent area as it's a great price range for a long term hold.
If you buy in the 50-69 cent range, it's a good but not as great.
Anything above 69 cents, you are starting to chase as our min sell target is $1.85
No matter what the SPX ES and DXY do, we are looking to purchase ALGOUSD at levels that have attractive risk to reward ratios, where slow scaling in with a long term hold make sense.
At the low end, if we risk $0.25 to make $1.60 (eg 1.85 - 0.25 = 1.60) or over a 5x return.
At the mid level, we risk $0.50 to make $1.50 a 3x return.
* If you are not willing to scale in small amount of money for a very long time minimum 3-7 years here don't do this trade.
Hope it helps
Marc

Algorand (ALGO) - May 10hello?
Traders, welcome.
If you "follow", you can always get new information quickly.
Please also click "Like".
Have a nice day.
-------------------------------------
(ALGOUSDT 1W Chart)
Above 0.6132: It is expected to continue the upward trend from a mid- to long-term point of view.
If it falls below 0.5021, there is a possibility of entering the mid- to long-term investment zone, so careful trading is required.
Therefore, it is an important observation point to reserve the power to create a new wave by going sideways in the 0.6132-0.9353 section.
------------------------------------------------------------ -----------------------------------------------------
** All indicators are lagging indicators.
Therefore, it is important to be aware that the indicator will move accordingly as price and volume move.
However, for convenience, we are talking in reverse for the interpretation of the indicator.
** The MRHAB-T indicator used in the chart is an indicator of our channel that has not been released yet.
** The OBV indicator was re-created by applying a formula to the DepthHouse Trading indicator, an indicator disclosed by oh92. (Thanks for this.)
** Support or resistance is based on the closing price of the 1D chart.
** All descriptions are for reference only and do not guarantee a profit or loss in investment.
(Short-term Stop Loss can be said to be a point where profit and loss can be preserved or additional entry can be made through split trading. It is a short-term investment perspective.)
---------------------------------

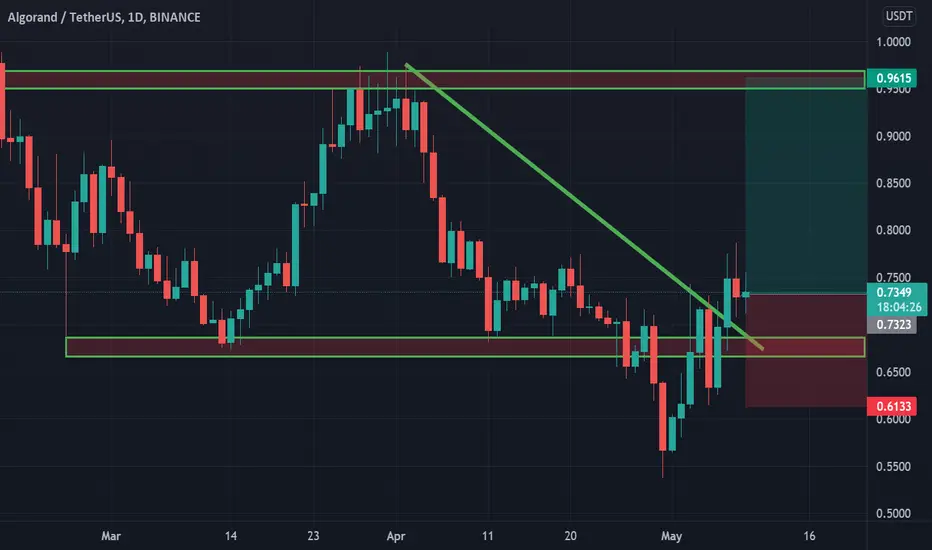
long on ALGO $ALGO broke through the resistance level and the descending trendline. Bullish movement to resistance level at 0,9615$ is likely to happen.
ALGO made HHHL; either 0.68 holds or D.Bottom at 0.54?ALGO is one of the rare cryptos still making a HHHL it is now making a rising wedge. 0.68 must hold or else it will risk going back down to retest previous bottom at 0.54.
Holding 0.68 may see next resistances at 0.80, 0.90 & the 1.00 to 1.03 zone.
See chart for possible movements.
Not trading advice


ALGOAs their have partnership now with FIFA, it can run and also football tokens as there is a world championship in Qatar this year.... worth to watch on new 2W candle... i am looking for long. PA looks decent here
NOT FINANCIAL ADVICE

ALGOUSDT LONG bouncing of lower support on daily pitchforkLooks to me like ALGO is finding good support at the bottom ranges of the trend lines with an increased probability that it will returns to upper levels. What do you think?
Thank you

ALGOUSD on a strong bullish streak but not a Buy Opportunity yetAlgorand (ALGOUSD) has completed a strong 3 day bullish streak coming close to the 1D MA50 (blue trend-line) again for the first time since the first week of April. Despite this green short-ter display, it is not a buy opportunity yet, as on the medium-term it remains within a Channel Down (dashed lines) and on the long-term it has broken below the Channel Up.
A buy signal will be given, when the price breaks above not just the 1D MA50 but also the Lower Highs trend-line (top) of the Channel Down. This Channel can be seen better on the linear scale:
On the long-term, which will be the safest trade, ALGO will turn into a confirmed buy once the price breaks not just above the 1D MA200 (orange trend-line) but also the 1W MACD makes a Bullish Cross. As you see, the last two MACD Bullish Crosses, have resulted in strong rallies within a 2-year time-frames.
Until those medium and long-term conditions are met, Algorand can be moving lower and lower in accordance to the lower Fibonacci extensions shown on the chart.
--------------------------------------------------------------------------------------------------------
** Please support this idea with your likes and comments, it is the best way to keep it relevant and support me. **
--------------------------------------------------------------------------------------------------------

$ALGO - trendline breakout + retest?after the announcement of its partnership with FIFA earlier today, ALGO got a huge pump of about 20% but will we be able to stay at these levels?
ALGO broke the downtrend trendline and is currently retesting the one, we just need to see whether we get a succesful or an unsuccesful retest of it
I will place a good long position targeting the $0.77 resistance if the price fixes well above the trendline, what do you think about it?
drop a like and follow me here and on twitter if you enjoyed this idea!

ALGO - Video Top-Down Analysis!Hello TradingView Family / Fellow Traders. This is Richard, as known as theSignalyst.
Here is a detailed update top-down analysis for ALGO.
Which scenario do you think is more likely to happen? and Why?
Always follow your trading plan regarding entry, risk management, and trade management.
Good Luck!.
All Strategies Are Good; If Managed Properly!
~Rich

ALGOUSDT 4H TA: In the ChannelAlgousdt In the 4-hour timeframe, it is in a downward channel, which is thrown up by reaching the floor of the channel with strong support. It currently has a price range of $ 0.8 for canal roof resistance and static resistance, which can grow again if it can pass through this area with strength. Otherwise it is possible to correct by reacting on the resistance up to the midline and the bottom of the channel.
Its not Buy or Sell SIGNAL
DYOR
BY : Mohamad Teriz - @AtonicShark

Bottom is in for AlgorandIt finally seems like the bottom is in for algorand or very close to it. If it dumps a little lower, a limit 45 cents could be in play. However this is a very good entry right here. 2023 could be the year for Algorand.

Bullish Divergence on Algo#Algo is getting ready for a bigger move and forming bullish Divergence on weekly timeframe is a confirmation for the same

Algorand is a very long term investmentYou either love it or you hate it, look at Apple, it took 45 years. Now I'm not saying algorand is a scam but just imagine how much a single Bitcoin is going to be worth around 2029, probably 6.5 million dollars. To think how much that is in Satoshis on Algo/BTC pair is ridiculous, 0.0001 at best. Is this coin really worth it? I swear this start up belongs to Nasdaq, not crypto.

Algo at support sneaky longBINANCE:ALGOUSDT
Times are tough but here is a sneaky way to make a small profit:
Bought at 0.66
Tp 1: .71
Tp 2: .78
SL .62


ALGOUSDT iH&SSupport on ALGO touched. Easy to put a stop loss with massive potential gains.
SL should be around 0.67$
Inverted Head & shoulders on daily.
Hidden bull divergence on MACD histogram and RSI on daily.
4H showing a partial decline with 3 rising valleys with hidden bull on MACD.
1.54$ is the first level second should be 1.83$ 50% fib level.

ALGO/USDT Futures And SpotBe careful not to use high leverage in futures.5-7 is suggested.I hope u have a good weekend.

Algorand (ALGO) path back out?Accountability? Agh. I know that I should remain neutral on this one for ALGO, just to keep a decent batting average 'round these parts ⚾️ for ol' Algorand.
Nevertheless, i am STILL bullish on ALGO.
This coin is going to have a gigantic breakout in the next several days/week. It's unfortunate that Algorand is still dictated in large part by big b (BTC) calling the shots with market fluctuation.
Things are getting better though. Coins and tokens are developing their own internal economy and ecosystems, with these becoming more and more impervious to BTC's ridiculously orchestrated fluctuations. The more people come on board and begin buying these coins, and creating traffic on the networks... the more these coins ( annnnd tokens, for all you defi peeps out there) --the more they all begin to break away from the grasp of BTC's and ETH's market fluctuations. --my love, Monero (XMR) being a prime example of this, especially at the present.
♠️🤫🐿

Algorand Price Prediction 2022Look when we broke that downtrend first time, went from 0.80 to 2.75, this time we may reach around $4
