ALGO - almost ATH!Top of the Morning!
Algo had a good run, it's hit almost ATH but it shows rejection on going further up for now. My DCA levels are:
$2.08
$1.91
$1.72
$1.54
Cheers!
Algorand

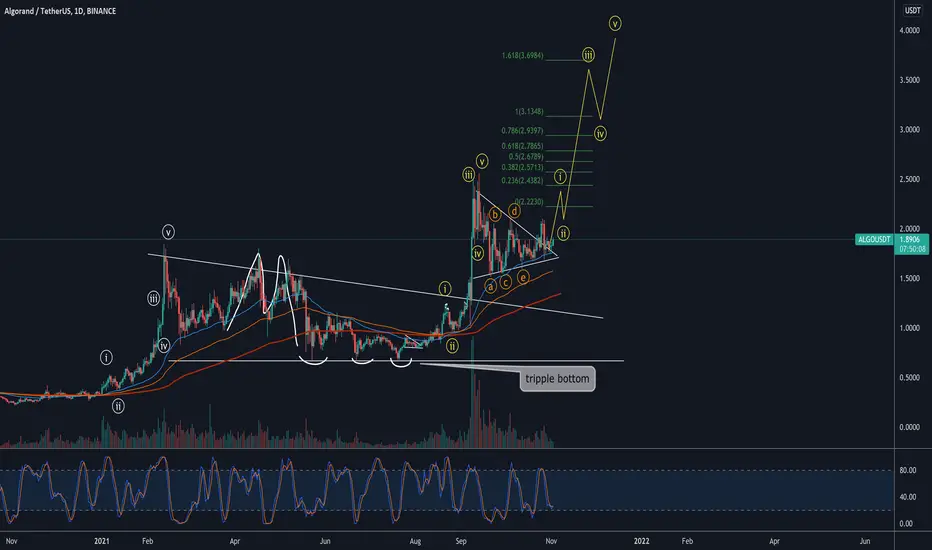
ALGORAND 1 possible long term scenarioFirst things first, monthly chart looks very bullish. Very obvious higher highs and high lows, market structure break leaving monthly demand zones. Using the fib trend tool, we can guess at AlGOs next target which would be 3.3057 which is our 1.618 fib target.
Judging by the current swings in the market, if there is some sort of major correction, I'd expect price to go down either to the 0.5 fib level or below it to fill that imbalance zone it left behind and maybe bounce from there. Though at the moment, we are still in a bull market so I don't expect such a major correction.
But if we do get one, it wouldn't be a bad thing because at 0.5 or below it, we could potentially find amazing long term entries.
So if you do see ALGO going way down for some reason, look at the monthly.
Cheers.

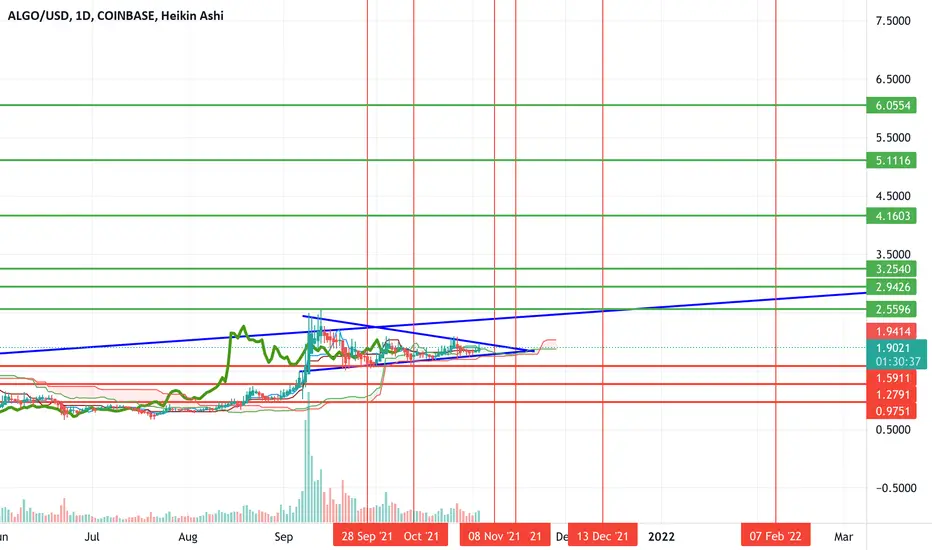
$ALGO targets $6 over the LT but w/ ST potential downside riskI think the next time we touch the blue trend line running through the middle of the chart, it should break. Which would give $algo great upside to the higher green targets w/ a potential of $6 as the final target. The key level to break on the upside is $2.56 (ATH) which would provide a path for continuation upwards.
However, the question is, what is the path to get there? I don't think the trade is as simple as it looks from the chart at the moment.
While there appears to be a flag that has formed on the chart, and the indicators are looking good, I think BTC could potentially take Algo down with it, if it were to fall.
I think the most likely scenario from here is that we break down from the flag (or break up and roll over) and find support at $.96-1.23 before the uptrend resumes. Reason being, that I'd have a hard time seeing Algo running straight up without retesting those lows first.
Let's see how it plays out. I added some key dates on the chart for changes in price action to watch.

AlgoBeen stocking up! look for entry if it retests previous levels. Algo is a great project. Follow me for more winning charts!

ALGORAND BREAKING OUT! Another resistance level breaking. In the words of @CryptoTrading_KenStandfield - the Altcoins are being pulled by Bitcoin's gravity.
I am seeing so many ALTS breaking out!
Target 1: $2.40
Target 2: $2.60 - $2.70
Come on the Alts!
Boom,
theRaggy

Huge Opportunity on ALGO 🚀ALGO looking absolutely great, after being in consolidation for a long time is ready to PUMP.
Looking extremely good, just need to wait for clear breakout with a good level of volume. In the meantime the massive ascending triangle will still going on, the more times we hit the resistance, the more likely it is that we will be able to break it and hit a new ATH.
This will be broke in the next few days/weeks (max). As soon as we breakout this resistance the price target would be around of $2.6 and as you know after breaking ATH there is no resistance 😉. If we use the Fibonacci retracement the targets would be $3.2 and $4.3.
Please guys be cautious but don't miss this awesome opportunity.

ALGORAND - Against BTC staking staking & staking
Algorand (ALGO)’s main aim is to drive low-cost cross-border payments. Being a PoS protocol, the network needs stakers for security and transaction processing. Unlike Tezos, it uses the pure proof-of-stake (PPoS) consensus mechanism. However, it still requires stakers to run full nodes.
Furthermore, there are third parties who support ALGO delegation. Staking rewards on these networks range between five and ten percent annually. Note that the rewards are influenced by the platform used. For example, those using Binance Staking enjoy an APY (annual percentage yield) of 8%.
Rank #20
Coin
On 373,858 watchlists
Algorand Price (ALGO)
$1.86
0.93%
0.00003045 BTC1.30%
0.0004137 ETH0.54%

ALGO Moving in Symmertical TriangleSo here We're , Algo after the big move moving into the summertical triangle and now on the Good Support , So Just Wait to Volume and after Breakout the triangle , you can buy it , Please Share your Idea about this chart
NOT FINANCIAL ADVICE
HAVE A GOOD TIME Fellas

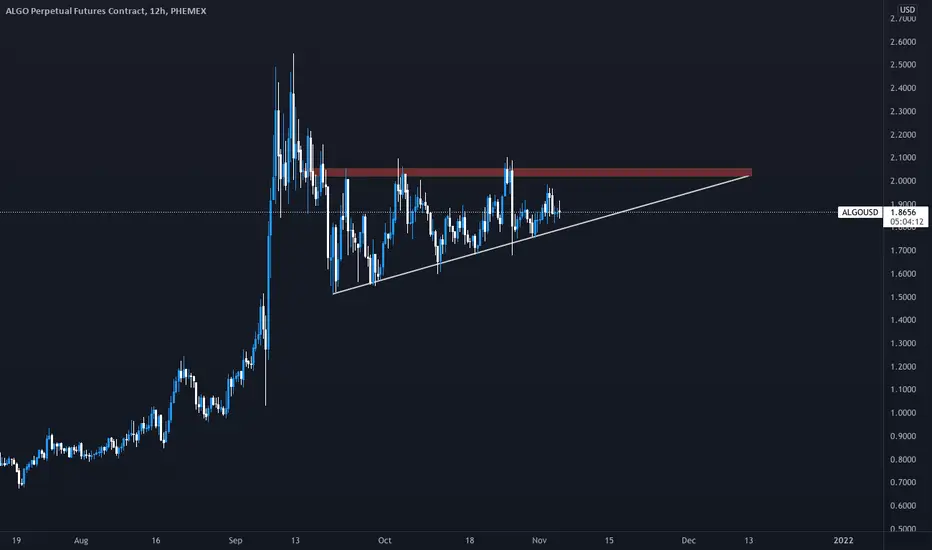
Climbing to new highs - ALGOAlgo is climbing up the ascending triangle. Red box resistance break will signal an imminent move to ATH.
DYOR and GL!
ALGO BREAKING OUT OF FLAG!VERY solid fundamentals on this one, long term price has been flowing in impulse moves upwards with consolidation flags in between. Price is currently in a squeezed flag and is testing our breakout area
- need to see a 8h - 1 day break out of flag and resistance area
- will want to have a Bollinger band beak
- first take profit @ 1.618 fib extension level
- stop loss placed below area of volatility in current consolidation area

ALGO / USDT - Big triangle pattern. on the verge a breakout?Here is my take on ALGO / USDT 4H. We are witnessing a triangle formation with a potential breakout. If the ranging motion continues then we can consider the pattern as invalidated.
If the triangle breaks the upper line of the triangle - I recommend that you wait for a solid confirmation - then enter a long position.
Take profit ideas:
TG1 - 2.08$
TG2 - 2.18$
TG3 - 2.26$
TG4 - 2.44$
I keep it simple and clean!
Likes, comments, and follows are dearly appreciated.
Let me know what you think and which ones you would like for me to analyze next.
Trade safely!

$ALGO huge breakout potentialOnce it breaks above ATH, next stops are at $10 and $20.
Price gonna finish cup and handle and then it can moon quite drammatically.

$ALGO Symmetrical TriangleRSI is showing strength maintaining above the 46 level. The 50-day MA passed up through the 200-day MA signifying a Golden Cross.
MACD doesn't look the greatest but does appear to be moving in the right direction.
Scenario A: break-out of the triangle, zoom towards previous ATH, contend with it momentarily and then make new ATH
Scenario B: breakdown out of the triangle, fall towards 200-day MA or previous support.
Which scenario do you think is more likely?
Imagine when ALGO gets the market cap of ADA or SOL... Algorand would be at about $11 if that were the case based on current market caps at the time of this post.
Weekly Chart:


ALGO to remain in correction phase above $1.75The Algorand price analysis shows that the ALGO/USD is correcting today. A decrease in price has been observed as bears are ruling the charts today. ALGO remained bullish for the last four days, and the price uplifted during that time but to a limited extent. Overall, ALGO has been following a wave pattern for more than a month and has been unable to break above the $2.3 level. Only one high swing was observed during the past weeks when ALGO went as high as $2.05 on 25th October, followed by a reversal of the same even higher magnitude when ALGO stooped down to $1.79 on 27th October. Since then, the price oscillation has been small.

#Algo tries to break out it's stong resistancethere is 2 possible scenarios : Success break out the triangle and pump to target levels or breaks down the support at 1.7
and retest 1.6 and 1.25
My idea is uptrend scenario and waiting for good entry point after success break out

Targetting 3USD- consolidated for 1,5month
- slowly upward sloping price
- flipping 2USD zone as support will open the upward potential
- 1.236 extension of summer run-up
- btc pair rolls/rolled over

ALGO - Critical Times!Hello everyone, if you like the idea, do not forget to support with a like and follow.
After breaking the orange resistance, ALGO has been stuck inside a range in the shape of a symmetrical triangle highlighted in purple.
For the bulls to take over, we need to see a break above the upper bound 2.13 marked in blue.
In this case, a bullish trend continuation would be expected till 3.0
In parallel, for the bears to take over, we need a break below the lower bound 1.55 marked in red.
In this case, a bearish reversal would be expected till around 1.0 where we will be looking for buy setups.
Good luck!
All Strategies Are Good; If Managed Properly!
~Rich

ALGOBTC Massive Broadening Wedge BottomUpdated. Publishing for myself to see if that broadening wedge bottom textbook plays out or not. ALGOBTC is in descending channel (red) and in broadening wedge bottom (yellow) both.

LongHello guys, we are moving in a triangle pattern. The best time to buy is when leaving the pattern.
#signal
#ALGO
#ALGOUSDT
Spot( Midterm)🌟
Enter : 1.9$
Target : 2$
Target : 2.09$
Target : 2.3$
Target : 2.4$
Target : 2.9$
Stop loss :1.74$
Daily Close In : 1.74$

ALGO ---> C&H pattern - DIRECTION 7$Hello everyone !
Today the Black Cat Trader is analyzing ALGO based on a weekly chart.
What we can see :
Pitchfork : Prices are stuck under the intermediary lower line of the pitchfork
Pattern : Prices are building what seems to be a beautiful Cup and Handle pattern.
What we can expect :
- If ALGO manages to break the median line of the pitchfork, we can expect prices to reach the intermediary upper line of the pitchfork first. A pull back on the neckline of the C&H would be perfect to send ALGO to the last upper line of the pitchfork.
- Note that the trend based fib extension gave us targets who match with our C&H and pitchfork final objectives.
Major resistance 1 : Median line of the pitchfork
Major resistance 2 : ATH
——
Major support 1 : Lower line of the pitchfork
Major support 2 : Long term uptrend (Green)
——
TP1 : 3,49$ (1.618)
TP2 : 5,23$ (2.618)
TP3 : 6,98$ (3.618)
TP4 : 8,72$ (4.618)
IF YOU LIKE THIS POST, FEEL FREE TO LEAVE A LIKE AND FOLLOW THE BLACK CAT TRADER
MAY THE CRYPTO BE WITH YOU GUYS (D.Y.O.R)
