ALGO 90day outlookThis is looking like a positive bid for coming quarter. purple channel likely to break up and mark higher given how long this has been consolidating with the rest of the market and overal shift to bullish since the 20th of july.
Trading Disclaimer:
All trades and ideas posted from this account, including setups, are given for educational purposes only. 95% of trades never win, and instead realize losses. Trading involves risk, there are zero guarantees that you will win any given trade, including this one or others related to it or this account. If you follow any setups, you do so at your own risk, taking full responsibility of any actions and / or outcomes. Nothing posted is to be taken as financial advice. The information and opinions presented by this account should not be construed as investment or trading advice, and is not meant to be a solicitation or recommendation to take actionable trading on any asset, cryptocurrency, securities, or any other tradable digital asset.
All content presented is for entertainment and education.
No Financial Advice.
Past performances are not a guarantee of future outcomes and or results: trading involves strategizing probabilities, there are no expectations on any given trade.
Always do your own research and consult a team of professionals from finance and law before proceeding with any type of action in personal finance.
All information provided by this account is a general market commentary and does not constitute investment advice or financial advice. None of the information communicated in this accounts tradingview publishings are financial advice and/or incentives, solicitng, advertising, manipulation tactics, and any other malicious behaviour - no, solely for entertainment purposes ONLY.
Algorand

ALGO GOOD NEWS COMING!!!Recently, I've got good news about Algo. It is technically in an appropriate position. And about fundamental, check here:https://coinmarketcal.com/en/event/programmable-liquidity-65946


ALGO WILL RUN THE QUESTION IS WHEN?Algo should play out one of two ways short term.
Not financial advice.

🔥 ALGO Huge Price ActionOver the last three days, ALGO has one of the biggest gainers.
What we're seeing now is that some leaders are ahead of the pack (ADA, AVAX, LUNA, IOTX) and that other tokens are slowly but surely following and starting to take a leap.
One of the first tokens to make big leaps now is ALGO. Assuming that ALGO will follow the move of the prior tokens, we can expect strong gains in the coming gains.
Main target for this massive move is the green area of resistance, which ranges from $1.57 - $1.70
Happy trading!

Algorand(testing key bullish levels)Could see a bounce off the 38.20% level, if it breaks down through that level look for a bounce at 23.6% level. If Algo can break through the parallel channel and the 50% level look for a 100% retracement then to 161.8% and beyond.

ALGO - personal buy near 2020 HighAlgorand (ALGO) is in a technical downtrend, which appears to be weakening (see MACD and thinning negative Ichimoku cloud). For a conservative trade, waiting for the MAs to cross would support a trend reversal. Personal trade made at @0.85111. Please follow BradtNom, leave a comment or link to your own ideas! Charts are for information purposes only. Not trade suggestions. DYOR (Do your own research) - act responsibly with your money.

ALGORAND- Our ChartI don't touch projects that go to 3,4 then back to half a dollar.. Something is fundamentally wrong.
You asked for the chart and with all my love: Here it is!
I hope it helps, price at major res/sup level and let's see what happens.
Again, I am NOT touching it
the FXPROFESSOR

ALGO: break out imminent !!The break out is imminent (days not weeks).
End of a 2 year long bullish descending wedge. Price is touting the resistance for 2 months now !
Strong positive divergence on the RSI (green line).
Historic Volatility COMPRESSION !! At the same time that volatility is reaching the end of the funnel, price is trying to break out !!
RESOLUTION is IMMINENT !!

Altseason has officially started"September 18 will change everything and be the catalyst Algorand needs. Opulous at the most popular venue in the world announcing to the world “We go with Algorand” and then the huge musical artist. The world will listen. Then governance in October. Then AlgoMint, TinyMan, and AlgoDEX by end of year… maybe xBacked too. Some surprises possibly in between.. and hopefully CBDC. The rest of the year is ripe for gains and growth of the ecosystem"
Michael Jordan in "I believe I can fly" featuring MC Hammer who "can't touch this".

ALGO: getting ready !ALGO has been bouncing around for more than 2 years, trying to find a bottom.
Despite not being at the point of an imminent break out, ALGO is getting ready to launch.
The rising RSI has been forming a bullish divergence for a long time !!

ALGOUSDT : go for long ?? As we can see, after breaking its downward trend, the price is gathering strength to start a strong climb.
In order to buy, the SL (stop loss) and capital management must be observed.
All resistances and TPs (take profits) are marked on the chart.
(DYOR)

ALGO - My Trading Plan in 3 mins!Hello everyone, if you like the idea, do not forget to support with a like and follow.
Here is the top-down analysis for ALGO, feel free to request any pair/instrument or ask any questions in the comment section below.
Best of luck!

ALGO/USDT Broke out of the triangle patternALGO/USDT (Algorand) broke out the triangle pattern and made a confirmation. Best time to enter and we could see some bullish movement.
Use the green lines (Resistance zone) as targets. Possible 60% plus
This is not financial advice please DYOR and place stop loss below the red line (strong support zone)


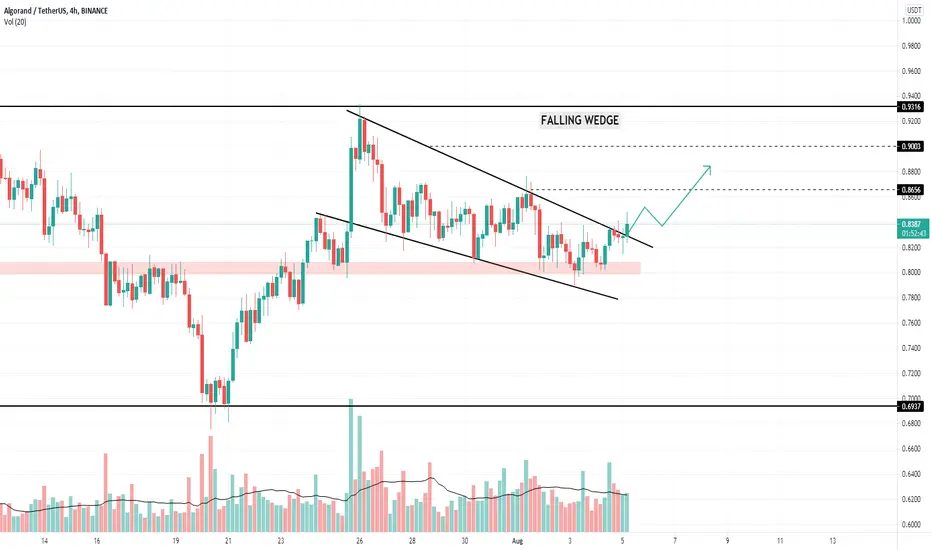
Bullish breakout in Algorand* Algorand in 4H time frame forms a falling wedge pattern, which is a trend continuation pattern.
* Here the price is consolidated between two trend-line slightly sloping downwards, the price is squeezed till it breaks the pattern.
* Algorand breaks the upper trend-line, if it continues to rally the TP1 = 0.8600, TP2 = 0.9000
ALGOBTC and its Bullish DivergenciesAs always, simple idea & simple chart, enjoy. Been waiting for this so long, I guess this is the time.

Algorand (ALGO) - august 10Hello?
Welcome, traders.
By "following", you can always get new information quickly.
Please also click "Like".
Have a nice day.
-------------------------------------
(ALGOUSD 1W Chart)
If the price is maintained above the 0.5221395-0.76754798 range, it is expected to create a new wave.
(1D chart)
If the price is maintained in the 0.65798713-0.92350974 range, it is expected to turn into an uptrend.
However, in order to continue the uptrend, it must break out of the downtrend line.
If it goes down, you should check to see if it finds support at the 0.52522584-0.65798713 zone.
-------------------------------------
(ALGOBTC 1W chart)
We are walking sideways in the section 1075 Satoshi-6469 Satoshi.
If the price is maintained above the 1970 satoshi-2886 satoshi range, it is expected to turn into an upward trend.
To continue the uptrend, it must rise above the 4309 Satoshi point.
If it rises above the 6469 Satoshi point, it is expected to create a new wave.
(1D chart)
If it finds support at the 1820 satoshi point and moves above the 2147 satoshi point, I would expect it to turn into an uptrend.
If the volume profile section spanning the 2452 Satoshi-2886 Satoshi section is exceeded upward, it is expected to continue the upward trend.
If it falls from the 1820 Satoshi point, it may enter the mid- to long-term investment area, so careful trading is required.
------------------------------------------
We recommend that you trade with your average unit price.
This is because, if the price is below your average unit price, whether it is in an uptrend or in a downtrend, there is a high possibility that you will not be able to get a big profit due to the psychological burden.
The center of all trading starts with the average unit price at which you start trading.
If you ignore this, you may be trading in the wrong direction.
Therefore, it is important to find a way to lower the average unit price and adjust the proportion of the investment, ultimately allowing the funds corresponding to the profits to regenerate themselves.
------------------------------------------------------------ -----------------------------------------------------
** All indicators are lagging indicators.
Therefore, it is important to be aware that the indicator moves accordingly with the movement of price and volume.
However, for the sake of convenience, we are talking in reverse for the interpretation of the indicator.
** The wRSI_SR indicator is an indicator created by adding settings and options to the existing Stochastic RSI indicator.
Therefore, the interpretation is the same as the traditional Stochastic RSI indicator. (K, D line -> R, S line)
** The OBV indicator was re-created by applying a formula to the DepthHouse Trading indicator, an indicator disclosed by oh92. (Thanks for this.)
** See support, resistance, and abbreviation points.
** Support or resistance is based on the closing price of the 1D chart.
** All descriptions are for reference only and do not guarantee a profit or loss in investment.
Explanation of abbreviations displayed in the chart
R: A point or section of resistance that requires a response to preserve profits.
S-L: Stop Loss point or section
S: A point or section where you can buy to make a profit as a support point or section.
(Short-term Stop Loss can be said to be a point where profit and loss can be preserved or additional entry can be made through split trading. It is a short-term investment perspective.)
GAP refers to the difference in prices that occurred when the stock market, CME, and BAKKT exchanges were closed because they are not traded 24 hours a day.
G1 : Closing price when closed
G2: Opening price
(Example) Gap (G1-G2)


ALGOUSDT Flag Pattern!ALGOUSDT Technical analysis Update
ALGO/USDT currently trading at $0.8438
Flag Pattern
Buy level: Above $0.840
Stop loss: $0.800
TP1: $0.865
TP2: $0.910
TP3: $0.99
Max Leverage 3x
Always keep Stop loss
Note: please do your own research before investing. Never invest money that you can't afford to lose.

Algo possible bull flag and descending triangle breakout?In this analysis we will be going over algorand flag pattern that could potentially be breaking ALGO out of the larger descending triangle .
Algo has recently triple bottomed, is currently forming a bull flag and is looking to jump out of a descending triangle . If the top of the bull flag resistance line is popped the price action will head upward the same length of the bull flags pole. This would break the price action out above the macro pattern of the descending wedge pattern we have been in for 2.5 months.
Currently the price action is bouncing off of the .5 fib line after the retrace from the recent high (the resistance line of the descending triangle ) that helped formed the macro descending triangle formation Algo is currently in.
This one looks ready to move as long as Bitcoin plays nicely.
Have a green and prosperous week!

ALGOI would say without any EW this looks like an IH&S pattern forming on the USD pairs with an upside target of $1.10- $1.17. It won't be easy but I feel $ALGO is lagging vs the BTC pair on the daily chart. So my analysis is pointing us towards a larger move to the upside here very soon. We went long in my group at .82-.84c.

Waiting for confirmations breakout algorand to entry.This is my ideas for algorand. i hope this can help your analysis
