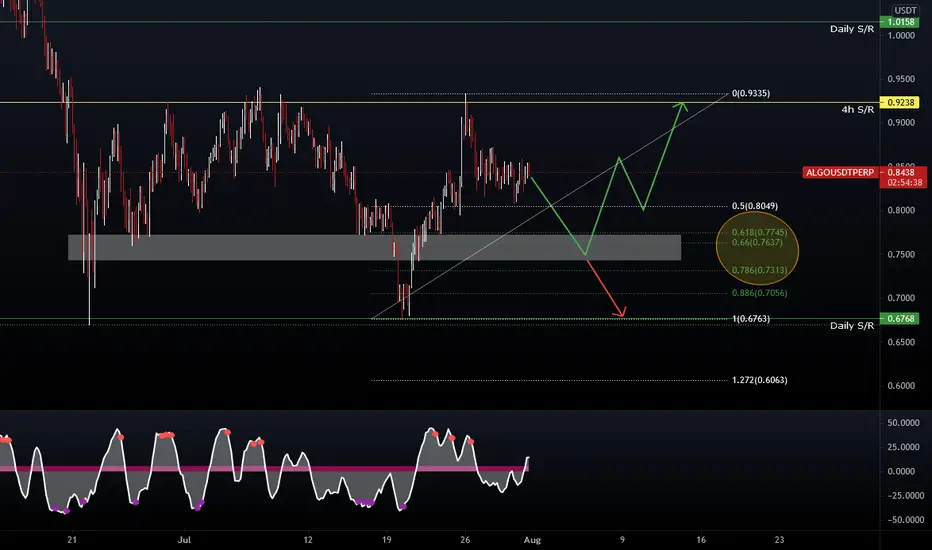
Algorand possible shortterm way Range trading.
Middle could give support, together with the FIB levels.
If we do not get support, the next place to go would be the lower area of the range
Algorand

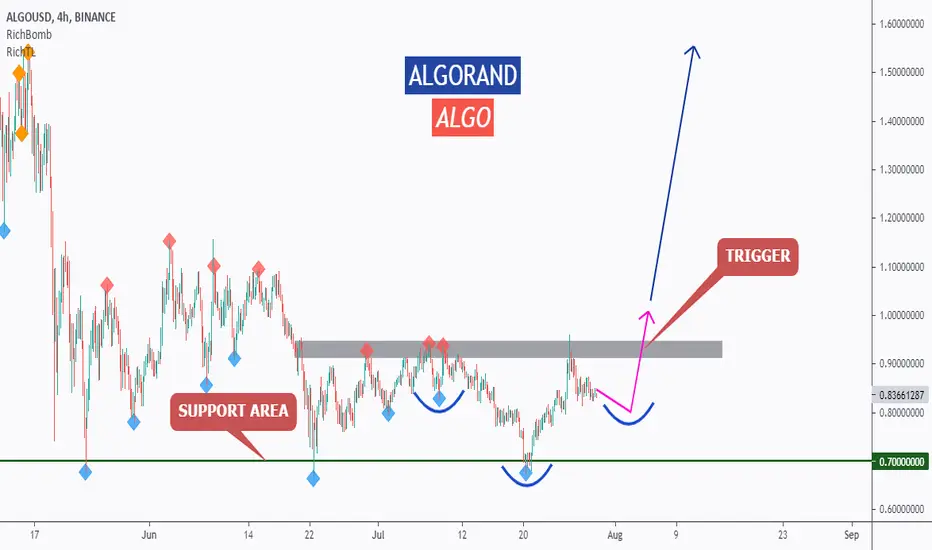
ALGO - Potential Bullish Reversal!Hello everyone, if you like the idea, do not forget to support with a like and follow.
ALGO is sitting around strong support in green so we will be looking for buy setups.
Before we buy, we want the buyers to prove that they are taking over again.
You don't want to buy a bearish market right?
on H4: ALGO is forming an inverse head and shoulders pattern but it is still an idea. so we are waiting for the right shoulder to form to consider it valid. (projection in purple)
Trigger => Waiting for the right shoulder to form and then buy after a momentum candle close above the gray neckline.
Meanwhile, until the buy is activated, ALGO would be overall bearish can still trade lower.
Good luck!
All Strategies Are Good; If Managed Properly!
~Rich
If ALGO follows past movements Not financial advice. But I would have a nice buy order set around 0.50-0.55 cents.

ALGO breaking outALGO is breaking its long-term downtrend line and resistance. RSI is also breaking resistance line and MACD crossover happening on the daily. Initial target would be the 0.93 range but we could see higher in the longer term.

ALGO.USDT (Y21.P5.E1).Cup and handle Hi Traders,
Just looking at the alts and my bullish perspective with BTC, I see a handle completing with Algorand.
The rest is in the commentary.
s3.tradingview.com
All the best,
S.SAri

Take Long on Algo #Algo $AlgoGood Time to take a long position on Algo!
Currently, due to the increase in the bitcoin range and its movements, all altcoins will be affected by it. The analysis is just a series of probabilities.
I hope you find this analysis useful🌹
Follow for more...

Algorand (ALGO) - July 18Hello?
Welcome, traders.
If you "follow", you can always get new information quickly.
Please also click "Like".
Have a good day.
-------------------------------------
(ALGOUSD 1W Chart)
If the price holds above the 0.76754798 point, we expect the uptrend to continue.
(1D chart)
If the price is maintained in the 0.65798713-0.92350974 range, it is expected to turn into an upward trend.
If it falls in the range of 0.52522584-0.65798713, there is a possibility of entering the mid- to long-term investment area, so careful trading is required.
A move above the 0.92350974 point would suggest a move to break above the downtrend line.
-------------------------------------
(ALGOBTC 1W chart)
If it rises in the sideways section of 1075 Satoshi-4309 Satoshi, it is expected to create a new wave.
(1D chart)
If the price is maintained in the 2374 Satoshi-2792 Satoshi section, it is expected that the upward trend will continue.
If it falls from the 2374 satoshi point, it can touch the 1747 satoshi-1956 satoshi section, so Stop Loss is necessary to preserve profit and loss.
However, since it will be located within the section that previously showed the volatility of the 716 Satoshi-3888 Satoshi section, you need to think about how to set up a buying opportunity.
------------------------------------------
We recommend that you trade with your average unit price.
This is because, if the price is below your average unit price, whether it is in an uptrend or in a downtrend, there is a high possibility that you will not be able to get a big profit due to the psychological burden.
The center of all trading starts with the average unit price at which you start trading.
If you ignore this, you may be trading in the wrong direction.
Therefore, it is important to find a way to lower the average unit price and adjust the proportion of the investment, ultimately allowing the funds corresponding to the profits to regenerate themselves.
------------------------------------------------------------ -----------------------------------------------------
** All indicators are lagging indicators.
Therefore, it is important to be aware that the indicator moves accordingly as price and volume move.
However, for the sake of convenience, we are talking in reverse for the interpretation of the indicator.
** The wRSI_SR indicator is an indicator created by adding settings and options to the existing Stochastic RSI indicator.
Therefore, the interpretation is the same as the traditional Stochastic RSI indicator. (K, D line -> R, S line)
** The OBV indicator was re-created by applying a formula to the DepthHouse Trading indicator, an indicator disclosed by oh92. (Thanks for this.)
** See support, resistance, and abbreviation points.
** Support or resistance is based on the closing price of the 1D chart.
** All descriptions are for reference only and do not guarantee a profit or loss in investment.
Explanation of abbreviations displayed in the chart
R: A point or section of resistance that requires a response to preserve profits.
S-L : Stop Loss point or section
S: A point or section where you can buy to make a profit as a support point or section
(Short-term Stop Loss can be said to be a point where profit and loss can be preserved or additional entry can be made through split trading. It is a short-term investment perspective.)
GAP refers to the difference in prices that occurred when the stock market, CME, and BAKKT exchanges were closed because they are not traded 24 hours a day.
G1 : Closing price when closed
G2: Opening price
(Example) Gap (G1-G2)

Algorand looking for a Green FridayThis is the 1 hr chart & as you see here we are coming off a nice Bull run since the 22nd. Using the Fib Retracement tool, it indicates we may see some big movement coming. Typically what happens once you hit the .618 line it's followed by a nice Bullish push in this case upwards of .90+ as we move through Friday morning.
We are also in a wedge pattern as we have already completed 4 out of the 5 Elliott wave points, so the next time we cross over a resistance it should indicate which direction we are headed.
We very well could hit a bearish reversal & be on our way back down to .79 & see a bit of consolidation.

These violent delights have violent ends. THE GREAT RESET“These violent delights have violent ends And in their triumph die, like fire and powder, REMEMBER, remember the Fifth of November, gunpowder, treason and plot!"


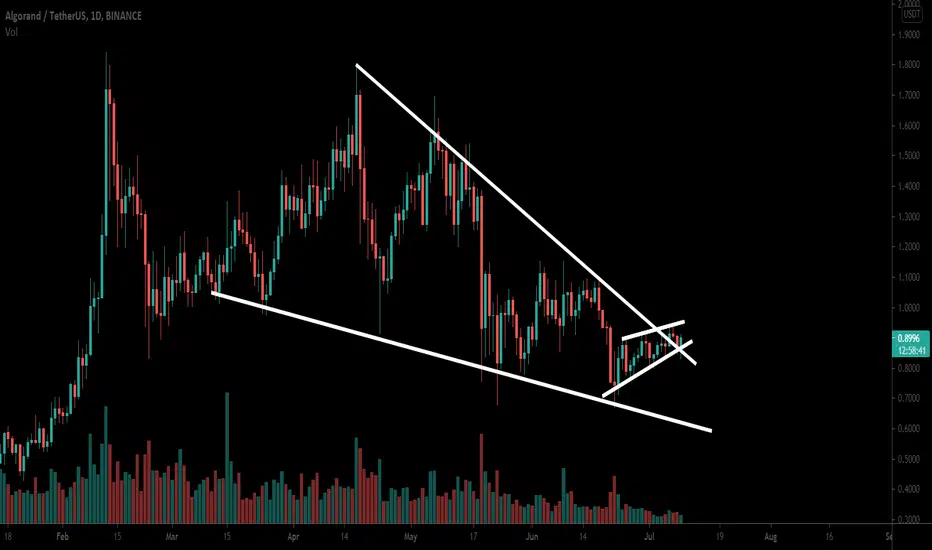
The Most Explosive Move Of Algorand (ALGO) Is Heretwo wedge patterns:
The price action of ALGO has formed a big falling wedge pattern and within this falling wedge, the priceline also has formed a smaller rising wedge pattern as well. The price action of the leading ALGO was accumulated at the support of the smaller rising wedge pattern and at the same time it was trying to break out the resistance of the bigger falling wedge pattern as well. Finally, the priceline broke out the resistance of the bigger falling wedge and now re-testing the support of the rising wedge pattern. But the volume is not supporting this break out as it is quite low at the moment. If there will be a buying volume while re-testing the previous resistance as support then the breakout can be confirmed and the price action ca turn very strong bullish otherwise it can move down in the same falling wedge pattern and even break down the support of the rising wedge as well.
A big harmonic bullish Gartley pattern:
Previously ALGO formed a bullish Cypher pattern on 2-day chart and produced more than 70% rally after completion of this pattern:
Now this time on the weekly time frame chart, the price action has formed the final leg of the bullish Gartley pattern. There is also 50 simple moving average support in the buying zone. This harmonic pattern is very big than the previous one, therefore, this time the move can be bigger.
The Fibonacci targets of this pattern can be:
Buy between: $0.8718 to $0.6086
Sell between: $1.07 to $1.57
The maximum extent of potential reversal zone $0.6086 can be used as stop loss. Or to minimize the risk we can use the 50 SMA as stop loss. As per the above targets, this trade has a big profit possibility of 157%, and the high loss possibility is 31% and incase we use the weekly 50 SMA as stop loss then the loss possibility is up to 25%, but as the 50 SMA will be moved up the loss ratio will be decreased.
Conclusion:
If the priceline will break down the support of the rising pattern then it can move more down to test the support of the falling wedge pattern on the daily time frame. However, on the weekly time frame, we have a very strong bullish reversal harmonic pattern formed. Therefore, on the long-term there are strong chances that the price action will start it bigger rally than the previous one.
Algorand (ALGO) formed big Gartley for upto 157% bullish moveHi dear friends, hope you are well, and welcome to the new update on Algorand (ALGO).
Previously we had a nice trade of Algo:
Now on the weekly time frame chart, the price action has formed the final leg of the bullish Gartley pattern. There is also 50 simple moving average support in the buying zone.


Algorand Ranked Top 3 Worth Trillions: Altseason RoadmapNote from the future: How did $Algo end up dominating 20% of the total market capital in crypto out of 10 trillion reichsmarks in the bubble peak while it doubled its supply through 2021? I wish I had known so I could've bought some under a dollar, I would be king in times of depression. Irrational Roaring Market, how was I supposed to know Mastercard, paypal, facebook, amazon, visa and 16 governments were going to use this technology, how was I supposed to know CBDCs would be launched in 2022. How was I supposed to know the digital dollar was being introduced in a myserious MIT project. I'm just backward rationalizing here, nobody could anyone know, it was impossible to know at the time.

Algorand on its way too .95+ for next weekWe're currently in a Uptrend, approaching the lower resistance of this trend & the Fib resistance which is a great opportunity for a Touch & Go. Also if you take a look at the RSI we touched the Oversold indicator which usually leads to a nice bull run, this would send us towards the upper trend resistance.
If we end up breaking the lower resistance we may consolidate in the mid to low .80's as we move through the weekend.
*Not Financial Advice

$ALGO Long or Short? DAILY UPDATEBullish indicators: Breakout & retest of orange wedge as support. If it breaks out with force chances are we could see it make a nice lil run without the retest
Bearish indicators: Sitting in a larger wedge which shows signs that we could see another retest on the downside

ALGO make stay above $1 by next week As you see where riding in a nice bullish wedge pattern in a Elliott's Wave, if we are then we may see a pullback towards the lower resistance followed by a bullish push out of the wedge to $1. Or we very easily break the lower resistance retest & fall to the lower resistance which we would consolidate for our new floor.
I'm feeling the market shift Blush this week.
*Not Financial Advice

Algorand is blockchain 4.0 after the dotcom bubble 2.0The proliferation of Information and Communications Technology over the last 30 years, has allowed us to witness an exponential increase in the use of a myriad in smart applications such as smart farming, smart healthcare, supply-chain & logistics, business, tourism and hospitality, energy management, and the list goes on. However, for all the aforementioned applications, security and privacy are major concerns keeping in view of the usage of the open channel, for example, the Internet for data transfer. Although many security solutions and standards have been proposed over the years to enhance the security levels of the aforementioned smart applications, the existing solutions are either based upon centralized architecture (having a single point of failure) or having high computation and communication costs. Moreover, most of the existing security solutions have focussed only on a few aspects and fail to address scalability, robustness, data storage, network latency, auditability, immutability, and traceability. To handle the aforementioned issues, blockchain 4.0 technology can be the ideal solution. Motivated by these facts, Silvio Micali, founder of Algorand presents a systematic blockchain based solution, applicable in various Industry 4.0-based applications. His contributions are absolutely paramount, short of disruptive.
Firstly, it's important to explore and compare the current state-of-the-art solutions in the blockchain sphere and the technology for smart applications. By illustrating the reference architecture used for the blockchain applicability in various Industry 4.0 applications, it's crystal clear to see who the sleeping giant and second mouse is. Algorand will be the one that gets the cheese.
Now according to Harvard Business Review, there are four dominating business models in today's rapidly smart and connectedly changing world that's learning to adapt much quicker than any expert previously anticipated.
Asset Builders: These companies build, develop, and lease physical assets to make, market, distribute, and sell physical things. Examples include WeWork, Tesla, Ford, Wal-Mart, and FedEx.
Service Providers: These companies hire employees who provide services to customers or produce billable hours for which they charge. Examples include United Healthcare, Accenture, Experian PLC, and JP Morgan.
Technology Creators: These companies develop and sell intellectual property such as software, analytics, pharmaceuticals, and biotechnology. Examples include Microsoft, Oracle, and Amgen.
Network Orchestrators. These companies create a network of peers in which the participants interact and share in the value creation. They may sell products or services, build relationships, share advice, give reviews, collaborate, co-create and more. Examples include eBay, Red Hat, and Visa, Uber, Tripadvisor, and Alibaba.
Algorand has positioned itself to be a Disruptive Technology provider for Governments to introduce their own CBDCs through 2022 and a Network Orchestrator for developers and entrepreneurs.
To mention a few Algorand was recently featured as a Symposium Partner and speaker at OMFIF and DMI.
What Blockchain technology is ready for Industry 4.0?
Not just to launch central bank digital currencies, but to meet smart contract demands through virtual machines in blockchain 2.0, be able to scale efficient DApps in blockchain 3.0, while at the same time lead the future as an infrastructure based Blockchain 4.0 ecosystem?
I can only think of Algorand. A triple AAA long term investment.

ALGOUSD about to complete wave 4So far EW count on Algorand looks reasonable. Wave 5 could be extended, since wave 3 was not. Let's see how this plays out.
Please remember, that alternative cryptocurrencies (altcoins) are depending heavily on Bitcoin.

Buying ALGO EverdayAveraging into ALGO everday. Algo ofers 4% APY via Coinbase.
You can watch the newest video on my youtube channel which goes over this in detail.

ALGOUSDT TO TEST $1.10 FOR SOME 36% GAINFollowing last week, we saw a negative decline from this asset as price tested the weekly support of $0.75. Now, a push-up is highly probable.
Buying the dip actually works, and a possible 36% gain from this move could be in sight.
React carefully.
Don't get liquidated.
Trade Safe.

ALKALINE PORTFOLIO - ALGO 2This will be our Alkaline Free Crypto Portfolio. This portfolio will be held for the long term, so you must manage your capital to deal with potential dips in the crypto market. We will not provide every entry in one post, as we believe in the power of dollar-cost averaging. Leverage is not allowed, this portfolio must be followed by a Spot wallet.
Our analysis will be provided with an approximate entry price and the name of the token.
All the ideas provided must be taken with the same capital so that the performance is similar to the CryptoAlkaline portfolio.
You must divide your capital into entries of 2-5%. For example, a $10k bag will place entries of $200-$ 500, and in case of running out of money from the allocated capital, new entries must be taken with the same size.
It has been proven that the cryptocurrency market follows the same direction most of the time and that in this case, diversification does not eliminate the risk of losing money. However, we rely on diversification as a tool to increase our exposure to sporadic hikes in certain Altcoins.
Understand the risks involved in buying cryptocurrencies, and execute these activities legally according to the regulations of your country.
------------------------------------------------------------------
NEW ENTRY in Algorand (ALGO/USD // ALGO/USDT)
ENTRY PRICE $ 0.885
NO LEVERAGE, NO TARGETS
Please read our "Free Crypto Portfolio Rules" before placing your positions.
From a technical view, Bitcoin is in a good place to start buying near the $30k psychological level, so we could anticipate the next Altcoin Rally buying Algorand near the support situation.
This token has a use case for instant payments with low commissions and rewards through staking. Several payment processors such as Visa & Mastercard have shown interest in this asset. This fact causes the $1 level to be detected as a good buying opportunity, as it is considered reasonable for a token that could be used to pay for goods and services.
After this purchase, our average entry in Algorand is @$0.972.
Good luck, Alkalites!
