VUZI - Personal Price Target $100 🚀VUZI (Vuzix Corporation) is a current leader in the constantly expanding AR market for both businesses and consumers alike. I have personally been heavily invested in this stock since $9.53, and my current price target for the stock is $100+ within 2-3 years, although this may potentially occur in 1-2 years.
Over the past 4 or so months, we have seen VUZI grow over 650%, and according to my analysis it looks set for a continued uptrend.
TECHNICAL / INDICATOR BASED ANALYSIS:
Currently the EMA 8 is still in a strong uptrend ever since crossing over the EMA 200. We also can see on my dashboard that the trend is currently bullish, and the Trend Panel is displaying almost 100% uptrend sentiment on all timeframes.
(link to this free indicator below)
COMPANY / FINANCIAL ANALYSIS:
I like to keep my analysis simple, and so the information below will be listed in short and easily digestible bullet points.
VUZI is an extremely strong company, with minimal debt and liabilities, and enough cash on hand to cover all of this at any time
ARKQ has consistently loaded up on shares ever since the $18 range, and they now hold over 2 million shares
With Apple and numerous other companies essentially set on releasing AR glasses for consumers within the next year or so, this will give massive validation to VUZI as a company, and it will also draw many more investors into the AR market
VUZI has a partnership with Verizon for 5G technology to be implemented
Citron has already announced he would never short the company which is a good indicator that its likely to go up, as he is an extremely bearish and very reputable analyst
VUZI recently released their full year earnings in December, in which they reported $11.6 million in total revenue as compared to $6.7 million the prior year. This is a 74% year over year increase
The market for AR headsets / glasses has been estimated to grow at a compound annual growth rate of 73.8% from 2019 to 2025, and so far it has been meeting these expectations rapidly
All in all, this is just my opinion on VUZI as a company. If you disagree with my analysis or don't think I've done enough research, feel free to tell me your thoughts in the comments. I am not a financial advisor and I trade solely because I enjoy it. If you do happen to agree with my analysis or if you enjoy what you've read so far, please drop a like an follow me! I would love to hear everyone's thoughts!
P.S. the indicator I used in this image was made by me and can be found for free here!
with love,
-Lemon 🍋
Algotrading

ALGO- RETESTMay be expected soon.
Targets are:
T1: 1.6$
T2: 1.79$
T3: 3.1$ (only if price holds above 1.79$)
Stop Loss: 0.81$.


UNI have unlimited potential, Already up 2808.5% in 7 months !Today's analysis is about UNIUSDT on 1D timeframe.
UNI is the governance token for Uniswap , just like BNB is for Binance exchange. But UNI has shown about 2800% gains in just 7 months. Uniswap is a decentralized exchange (DEX) that makes it easy for users to swap an ERC-20 token for another ERC-20 token without the need of a centralized intermediary.
Let's talk about the analysis now.
It seems like UNI is range bound for now trading between $20 and $30, and accumulating further. We can see immediate support at about $25, as it has already tried to break the above range three times, hence Triple Top. I am using a ghost feed to show the price projection for both scenarios, if the price holds the immediate support level and breaks the immediate resistance, UNI is going to see another leg upward in the free zone. On the other hand, if price breaks the immediate support level, it might see a downtrend.
I have a bullish bias as I can see a hidden volume bullish divergence, and also MACD is flat but MACD line might crossover signal if volume increases.
Daily analysis gives long term trade ideas, where investors hold their positions for weeks or even months.
I would say, if it breaks the resistance with good volume and also if MACD line and signal line crosses over with a good percentage, it's a good idea to buy some UNI or go LONG on it.
Not a financial advise, DYOR and follow us for more ideas.
HAPPY TRADING


Story of XRP! It touched 1$. What Next ?This analysis is for XRPUSDT on 4HR Timeframe
XRP have recently touched the 1$ mark and have achieved this with a good volume.
RSI have seen a downward movement after visiting the overbought zone and achieving an ATH. For MACD, the signal line is looking to cross down the macd line. If the price holds support1 which is at $0.9, this is good for XRP in order to see another leg upwards. If it breaks this support, next immediate support level is at $0.8, which if broken, it can see a down trend till $0.6 levels.
On the other hand, if XRP holds between support1 and support2 and accumulates further, it could easily break the current ATH and the immediate resistance, and visit the free territory.
Traders can open long positions, or fill their bags on spot if it accumulates between both the support levels and take profits periodically. Stop Losses can be placed below $0.80
Thanks for reading our analysis and comment below for what do you think?
Follow us for more ideas
Happy Trading

EBON Price Target 6.40's🔸 Long Above @5.60
🔸 PT @6.10
🔸 PT @6.22
🔸 Ideal PT @6.40
🔸 Stop Loss @5.40
Wait for a Confirmation before Entering.

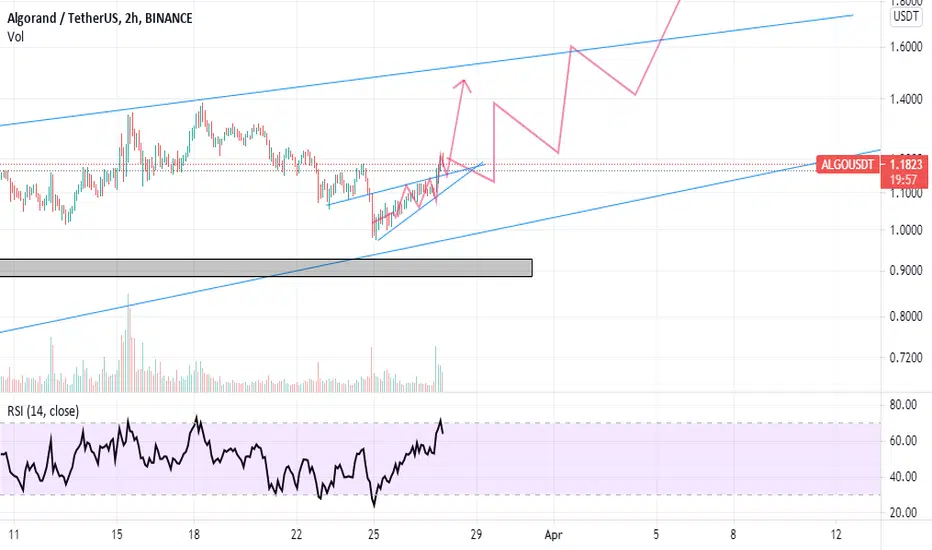
ALGOUSDT TA UPDATEAlgo is ready to breakouot within this week on next
Long Position is mentioned , and the upcoming targets
Best Buy right now & hold for next 1 or 2 months for good profits
Like and comment if you like my idea

Bullish pennant on 4HR. Is it going for another ATH ?This analysis is for BNBUSDT on 4H timeframe.
I am using below setup for this analysis
Indicator used : MFI (Money Flow Index) which is more like a volume RSI and tells us if an asset is in overbought or oversold zone. If MFI is above 80, it shows it's in the overbought zone. If below 20, it's oversold. This is the basic setup, though can be changed as per needs.
I am also using EMA's 20, 50, 100 and 200 to check the crossover, which generally shows us a bullish sign if ema's crossover each other, and bearish signs if ema's crossunder each other. In this case, all ema's are currently crossed over which shows upward price action, however every price action is also dependant on various other factors such as volume, overall market conditions etc etc.
In this analysis, I have spotted a Bullish Pennant. A bullish pennant indicates the continuation of a strong upward price move. They're formed when a market makes an extensive move higher, then pauses and consolidates between converging support and resistance lines. If the price action is able to break this pennant towards the upside, BNB might see another ATH. However, if the pennant is not broken and the asset sees a price decrease, any long positions should be closed and wait for a confirmation in either directions. MFI has been rejected from the overbought zone thrice, however if the pennant is broken upwards, it's going to get in the overbought zone once again and try to achieve a new ATH.
Happy Trading
For more trading ideas follow us.

BTC Trade Plan (4/2)-(4/4)🔸 Long Above @59000, TGT @60,200 , 60,600 , 61,000
🔸 Short Below @58600, TGT @58,000 , 57,700 , 57,250
🔸 Wait for Confirmation before Entering a Position


ALGO - very good coin for holding and staking. Huge profit here!ALGO is very nice project, this coin is on our long-term list. We accumulated huge bag for long term. If you are hodler of ALGO you can use staking (for example on exodus wallet) and earn free ALGO just for holding your ALGO there. Holders will be rewarded for sure.
If you want to know our golden list of altcoins for this bullrun and play with us on short term signals feel free to join us on our website!

TSLA Algorithm looking to go long!TSLA algorithm went long on March 31st on the 30 min timeframe around the 613 level and ran up to 668! We were able to catch this wave and made a good profit. We are looking to build position once TSLA Algorithm signals long on the daily timeframe which could have huge move to the upside going into earnings!
The plan is to wait until the TSLA algorithm enters into a long position on the daily timeframe with TTM Squeeze setting up. RSI is also reversing back into the 50 level which is a good sign along with the MACD signaling a bullish reversal. This can be a big potential move for TSLA and could be our biggest trade for the year yet!

ALGO/USDT : Moving into ascending channel BINANCE:ALGOUSDT
Hello everyone 😃
ALGO is moving into ascending channel.
There's a located resistance line at current level which chopped ALGO.
It had a rejection from bullish trendline and now there's a possible rejection to support zone again !
But overall is bullish...
Attention: this isn't financial advice we are just trying to help people on their own vision.
Have a good day!
@Helical_Trades

👧 ULTA Trade Plan (4/1)-(4/30) 👧🔸 Long Above 313.30 TGT 317.5/322/325/327/330
🔸 Short Below 309.60 TGT 305/301-300/297.4/293
❗ Wait for Confirmation before entering a Position. Stick with 4/1 for Scalps/Daytrades or 4/9 or 4/16 for Swings❗

+85% for Algo easily in the next daysNow currently trading at $1.29
✅ Buy: 1.3 - 1.2 ✅
🎯TARGETS:
1- 1.68 ( 40 .2%)
2- 2.20 (84.1%)
💵 Trade Size: 5-7% of Portfolio
🚫 Stoploss: daily candle close below 0.8385
Please click LIKE button and Appreciate my hard work.
Must follow me for latest crypto real time updates.
Thank you.

CSIQ Price Target 51.30's
🌩️ CSIQ PT 51.30's 🌩️
🔸Long Above 47. 05 to 49.99 (PT1). Holding above and we'll find 51.30's (PT2)
🔸Play Invalidated breaking under 45.70 (SL)
🔸 Short Below 46.99 PT @44.4, 42, 41.2's
❗ Wait for Confirmation before entering a Position. ❗

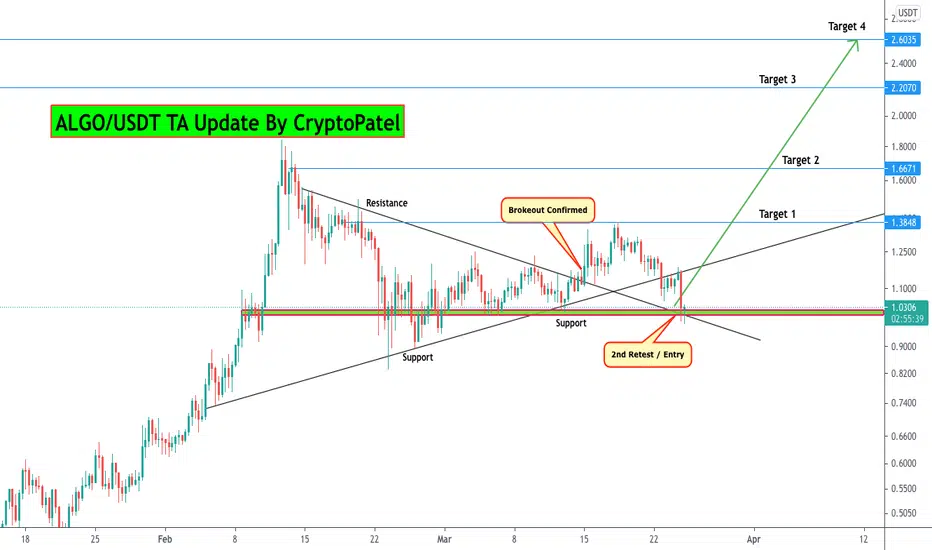
Amazing deal with high profit on ALGOUSDT for near termBINANCE:ALGOUSDT shows a clear breakout above resistance trendline of an ascending triangle and retests the last support at 1.29$, according to several analytical tools and indicators the road is open to these levels:
level 1: 1.84$
level 2: 2.37$
level 3: 3.24$
level 4: 4.09$
Stop-loss level is closing 1 daily candle below 1.18$
Good luck in your trade...!

$ALGO has FINALLY broken upward out of the channel - ITS A BEAST$algo has broken out of the channel is making a strong move upward here!!
Do not miss this opportunity, massive gains to be had here, no matter how you look at is.
REALLY GOOD time to buy $algo
**not financial advice**

ALGO/USDT : Seems bullish in mid-term overview BINANCE:ALGOUSDT
Hello everyone 😃
ALGO is moving above bullish trendline and Indicators are showing positive now.
Also Volatility had a bullish breakout and now MACD is bullish...
By the way, There's a pressure zone which is located at current level.
ALGO had a breakout from EMA 100, so It could be a good support for it..
📌 There's a possible chance for BTC to do some correction on mid-term !
It's not a good time to hold your positions more than 4 days; We advice to do scalping rather than holding !!
Attention: this isn't financial advice we are just trying to help people on their own vision.
Have a good day!
@Helical_Trades

ALGO/USDT Current Update ( Repost of Yesterday update )#ALGO/USDT current Update :-
#ALGO/USDT currently Trading at $1.025
And Yesterday We entered at $1.16
So I am buying some more at this range ( $1.025 ) added.
And same Target as I posted yesterday.
Re-Entry:- $1.025
Targets:- $1.38/$1.66/$2.22/$2.26/$3
Stop loss:- I will update when exit if trend change.
Please click LIKE button and Appreciate my hard work.
Must follow me for latest crypto updates.
ALGO/BTC Technically 200% Potential from here#ALGO/BTC Trade Analysis:-
#ALGO/BTC currently trading at $2014 Satoshi
And very near of Strong support level.
So we can buy here.
I am buying some hereZ
Entry:- 1900-2020 Satoshi
Targets:- 2982/3632/4224/5368 sat
Stop Loss:- Below red line Exit
Please click LIKe button and Appreciate my hard work.
Must follow me for latest crypto real-time updates.
Thank you.
