FDX (Overall Bearish)FDX (Overall Bearish)
1 Hour Chart :
Above 249.2 TGT 253.3/257.6
Below 247.8 TGT 245.6/244/242
Algotrading

Buy Signal: 275.81 #stocksIngenuity Trading Model used in- Stock, Forex, Futures, and Crypto markets. For Stops and overall trade management join the club.
The model is a Geometric Markov Model :
In probability theory, a Markov model is a stochastic model used to predict randomly changing systems. Markov Models are used in all aspects of life from Google search to daily weather forecast. The randomly changing systems we focus on are the equity, futures, and forex markets. The geometric element of the model is the fractal wave structure you can find on any chart you look at across any market and across all time dimensions.
Our model focuses on the current wave formation (current state)- geometric price formation along with its volume and volatility over a given time period and using that information to predict the future state- future price movement. For questions or more information feel free to contact me in the comment section or via private chat

Algo is going to retake her ATH...Algo is going to retake her All time high again...
She's still far away from final target, so, this might be a 5X to 10X profit opportunity...

ALGO/USDT in cycles....could hit new ATH in aprilFrom LOW (25/09/2019 = 0.192 $) to new HIGH (24/02/2020 = 0.5027 $) it takes 151 days.
From LOW (13/03/2020 = 0.0958 $) to new HIGH (14/08/2020 = 0.76 $) it takes 154 days.
From LOW (05/11/2020 = 0.2337 $) to new HIGH ....?
If we are in 150-155 days cycles, we can see new ATH in april ....
WHY:
1) we are in cycles
2) it could be start new ALT SEASON
3) is at 52 rank in coinmarketcap (increasingly popular)
4) have great project (Planet Watch)
This is only idea

ALgo Trading ON BTC based on RSI RSI / MACD / MARSI and Moving Average could be wisely used in order to make better spread trades.
Let’s have an analysis on the indicator RSI. We start an algo focused on RSI on the uptrend of Bitcoin since 28 oct 2020 -> today.
Rules: If the RSI drops below 25%, We take a long position. Whenever the RSI is Back to >70% we sell this position. Time per candle is 30 min.
The algo took 7 trade let’s look at his performance: 5.62% + 7.14% + 6.03% - 0.55% + 1.17% + 11.17% (the last trade is not done yet since we have not yet reached the 70% on the RSI indicator)
Total Performance since 28 oct 2020 = 30.58%
Average time before closing trade is 2 days

ALGO a setup to hit $5 Hi friends hope you are well, and welcome to the new update on Algo coin.
Breakout from wedge pattern:
On the daily chart, the priceline of Algorand coin started the formation of wedge pattern in the 1st week of Nov 2020 and now finally, it has broken out the resistance of this wedge.
Reached at $0.50 resistance:
While breaking out the wedge’s resistance the price action has also broken out the $0.40 price level resistance and now reached the next resistance at $0.50. If the $0.50 resistance will be broken out then the next resistance would be at $0.70 and then a final and key level resistance is at $0.90. On the long-term weekly chart, it can be seen that after $0.90 resistance there is no significant resistance between $0.90 to the highest price level that is $3.44 as per the Binance exchange.
An up-channel formation:
On the long-term weekly chart, it can be seen that the priceline of Algo coin has formed an up channel and moving between the support and resistance of this channel very well. While moving between the support and resistance of this channel the price action of Algorand is also making higher highs. Therefore if this time it will go for another higher high then it can be above $0.80. The exponential moving averages with the time period of 10 and 21 have also formed a bull cross beneath the candlesticks and now lifting the priceline up. And this cross is just formed therefore a more powerful rally is expected.
Conclusion:
In the near future, a more powerful rally is expected. However, if the price action will be able to breakout the resistance of the up-channel that has been formed on the daily chart, then it can also break out the key level resistance of $0.90 and can move to the highest price. And if it will surpass the previous high then it can even move to $5.

Algo 1 week Chartnot financial advice my take on the 1 week chart for Coinbase Algo please like and comment on how high you think it can go,


📺 NFLX (12/29)-(12/15) Trade Plan 📺 Trade Safe. Remember to set SL's, leaning on bullish above 515's.
Long Holding Above 517.80's
🔸 Conservative 523-524
🔸 PT 526-527
🔸 Ideal PT 530-532
Short Breaking Below 515.35
🔸 Conservative PT 513.30-512.11
🔸 PT 510-511
🔸 PT 507.54-507
🔸 Ideal PT 504.75-500.12

Is it time to gamble?LVS appears to be holding strong above its range state with the potential to continue upward. If the vaccine gap holds, around the 52 area, and net volume remains positive then LVS looks like a solid breakout candidate.

Still holding on but our stop is nearRipple was the 3rd buy of the crypto space but has significantly lagged BTC and Litecoin. It still remains much higher then the previous range state but recent news hasn't helped the currency. Our model doesn't account for news stories so the recent SEC drama was never a factor in our decision making. If XRP cant hold 0.43 we are out of the position.

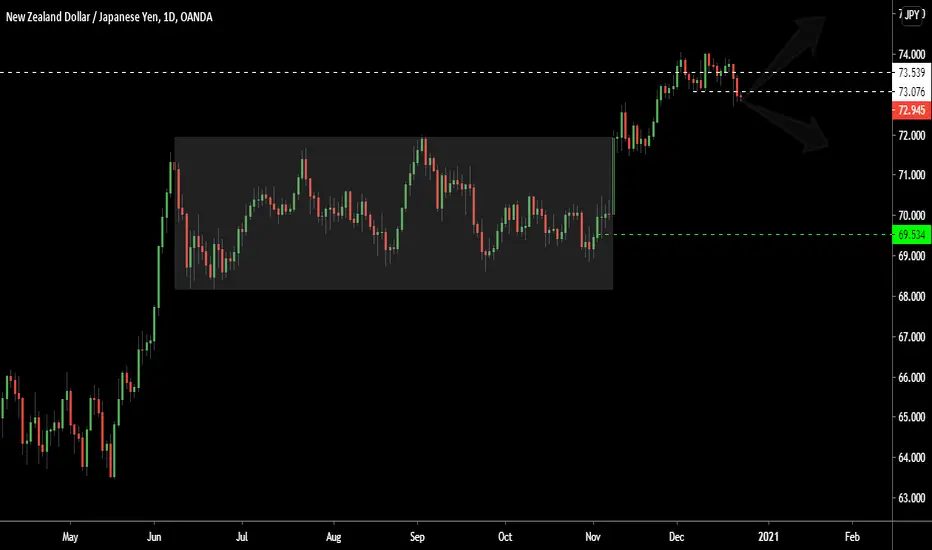
Make or break timeThe currency pair is hovering near a threshold point. Any solid break lower will bring it back into a range state toward the 72 area. If this recent continuation pattern is going to continue it needs to happen sooner rather than later. Broader risk trends like equity markets will have an impact so maybe the next move will be decided by how the stock market closes into the end of the year
Is it time to take another shot?We were burned holding CRM into earnings but price seems to be reversing back into the previous range. As long as it holds the 215 area, net volume trends higher, and the overall market holds up CRM could regain those earnings losses

Heading back into the range?If the 151 low holds this is potential a great play back into the range area near the earnings gap at 206. As long the overall market holds up and volatility continues toward 20 and below SPLK might be able to make an advance

Only clear skies ahead?Our range play has turned into a full continuation phase to the upside. We couldn't have predicted this strong of a bounce it has even outperformed AMZN. I could list a series of "fundamental stories" for why it has had a great run but when you trade with a model you don't have any. As long as shop holds above its previous range state and the net up vs down volume stays positive we will continue to hold.


Sell Signal: 3628.50Stop: 3730.00
Just as with the DJIA the model is picking up a potential reversal back into the previous range. At minimum this will hedge our long stock exposure

Finally a further move to the downsideAfter getting stopped out once trying short earlier this month, our most recent short is finally making some progress. A reminder to stick to your process and always be patient. There is never anything wrong with being stopped out because it allows you to re enter a position at a better level no matter what your strategy is.
Ingenuity Trading Model is an algorithm used in- Stock, Forex, Futures, and Crypto markets. The model is a Geometric Markov Model : Focuses on reversal and continuation wave structures
In probability theory, a Markov model is a stochastic model used to predict randomly changing systems. Markov Models are used in all aspects of life from Google search to daily weather forecast. The randomly changing systems we focus on are the equity, futures, and forex markets. The geometric element of the model is the fractal sine wave structure you can find on any chart you look at across any market and across all time dimensions.
Our model focuses on the current sine wave formation (current state)- geometric price formation along with its volume and volatility over a given time period and using that information to predict the future state- future price movement. For questions or more information feel free to contact me in the comment section or via private chat

Buy Signal: 0.6976Stop: 0.6885
First target: 0.7100
Adding to out long Canadian dollar exposure this time against the swiss franc. Our model continue to point to further gains and possibly a breakout higher out of this range it has been in for months now.
Ingenuity Trading Model is an algorithm used in- Stock, Forex, Futures, and Crypto markets. The model is a Geometric Markov Model : Focuses on reversal and continuation wave structures
In probability theory, a Markov model is a stochastic model used to predict randomly changing systems. Markov Models are used in all aspects of life from Google search to daily weather forecast. The randomly changing systems we focus on are the equity, futures, and forex markets. The geometric element of the model is the fractal sine wave structure you can find on any chart you look at across any market and across all time dimensions.
Our model focuses on the current sine wave formation (current state)- geometric price formation along with its volume and volatility over a given time period and using that information to predict the future state- future price movement. For questions or more information feel free to contact me in the comment section or via private chat. To view the entire portfolio and track our performance visit our site.

Sell Signal: 1.7188Stop: 1.7300
Looking for the down wave to continue and test recent lows
Ingenuity Trading Model is an algorithm used in- Stock, Forex, Futures, and Crypto markets. The model is a Geometric Markov Model : Focuses on reversal and continuation wave structures
In probability theory, a Markov model is a stochastic model used to predict randomly changing systems. Markov Models are used in all aspects of life from Google search to daily weather forecast. The randomly changing systems we focus on are the equity, futures, and forex markets. The geometric element of the model is the fractal sine wave structure you can find on any chart you look at across any market and across all time dimensions.
Our model focuses on the current sine wave formation (current state)- geometric price formation along with its volume and volatility over a given time period and using that information to predict the future state- future price movement. For questions or more information feel free to contact me in the comment section or via private chat

Potential continuation? The jets etf and many of the airlines within it have broken out of there previous range state and now appear to be in an expansion or continuation phase. If price can hold above 20 then you can imagine the next move for the sector is back toward 2020 highs.
