ALGOUSDT Break Downtrend – Reversal in Progress or Just a Retest📊 Technical Analysis Overview:
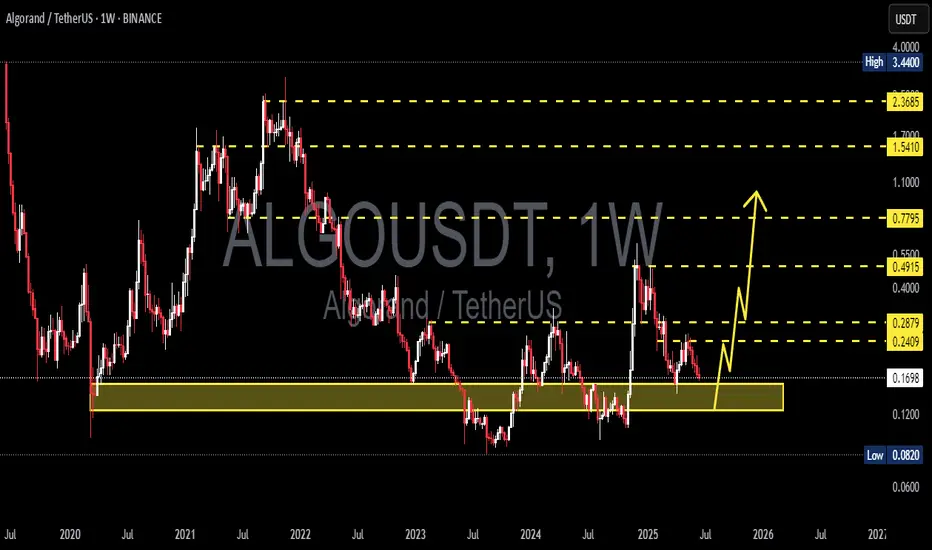
The Algorand (ALGO) / Tether (USDT) pair has shown a notable technical development by successfully breaking above a medium-term descending trendline that has acted as resistance since early 2025.
---
🔍 Pattern & Structure:
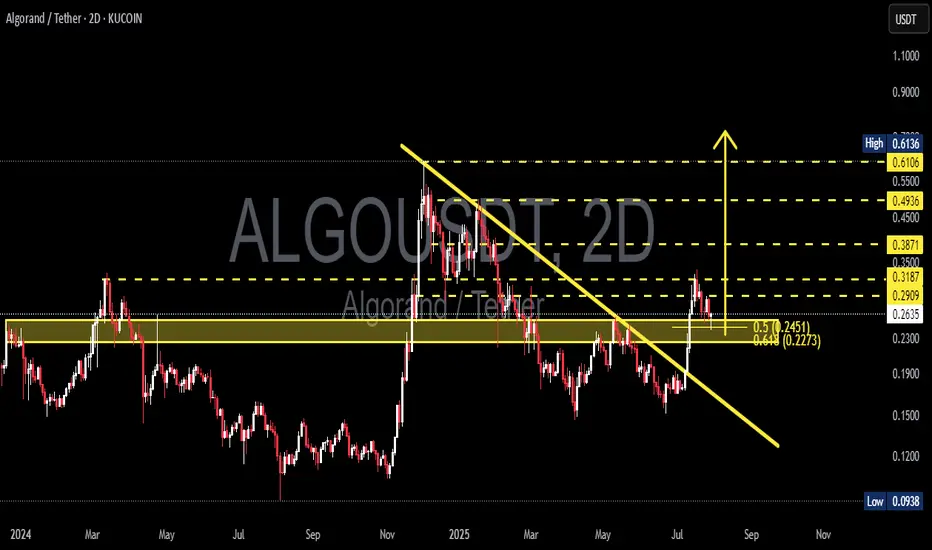
A clean breakout above the descending trendline (yellow sloped line) indicates a potential shift in trend from bearish to bullish.
Price is currently undergoing a retest of the breakout zone, aligning with the Fibonacci retracement levels 0.5 ($0.2451) and 0.618 ($0.2273).
The yellow horizontal zone ($0.25–$0.29) has been a significant support/resistance flip zone, showing strong historical reaction throughout 2024 and early 2025.
A higher high and higher low structure is starting to form — an early signal of a potential bullish reversal.
---
📈 Bullish Scenario:
If the price holds the support zone between $0.2451 and $0.2273, we could see a continuation of the upward move toward the following resistance levels:
$0.2909 (current minor resistance)
$0.3187
$0.3500
$0.3871
Mid-term targets: $0.4936 and $0.6106
A daily or 2D candle close above $0.3187 with strong volume would confirm a bullish continuation.
---
📉 Bearish Scenario:
On the other hand, failure to hold above the $0.2451–$0.2273 support zone could lead to a renewed bearish move with potential targets at:
$0.1900 (weekly historical support)
$0.1500
Extreme support: $0.0938 (2024 cycle low)
A break below $0.2273 would invalidate the breakout and may signal a bull trap.
---
📌 Summary:
ALGO is at a key inflection point. The current pullback could be a healthy correction after a breakout or a failed retest. Watch for price action and volume reaction near $0.2451–$0.2273 to confirm the next move.
#ALGO #Algorand #ALGOUSDT #CryptoAnalysis #TechnicalAnalysis #Breakout #BullishReversal #Fibonacci #SupportResistance #Altcoins #CryptoSetup #PriceAction
Algousd
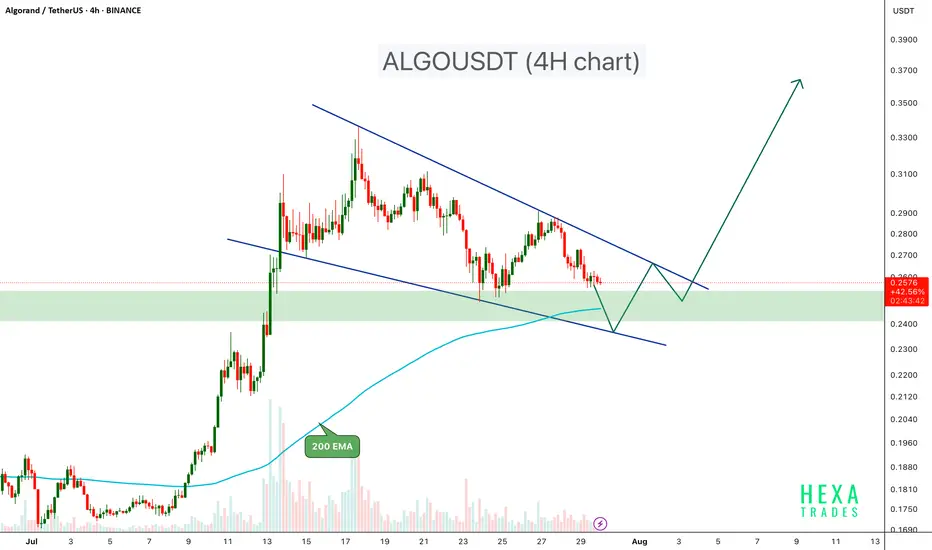
ALGOUSDT Forming Bullish Flag ALGOUSDT is currently trading inside a well-defined bullish Flag pattern on the 4-hour chart, a structure known for its bullish breakout potential. The price recently tested a significant demand zone, which previously acted as a base for a strong upward move earlier in July.
Key Points:
Bullish Flag Structure: Price is compressing within converging trendlines, forming lower highs and lower lows a classic bullish flag pattern.
Support Zone: The $0.24 – $0.255 area has acted as a strong demand zone, providing reliable support.
Bounce Potential: A bullish reaction from the lower flag boundary and demand zone could lead to a move toward the upper trendline and potentially trigger a breakout.
200 EMA Support: The 200 EMA is currently providing dynamic support, reinforcing the bullish setup.
Breakout Confirmation: A breakout above the flag resistance with strong volume could initiate a rally toward the $0.30 – $0.40 zone.
Cheers
Hexa
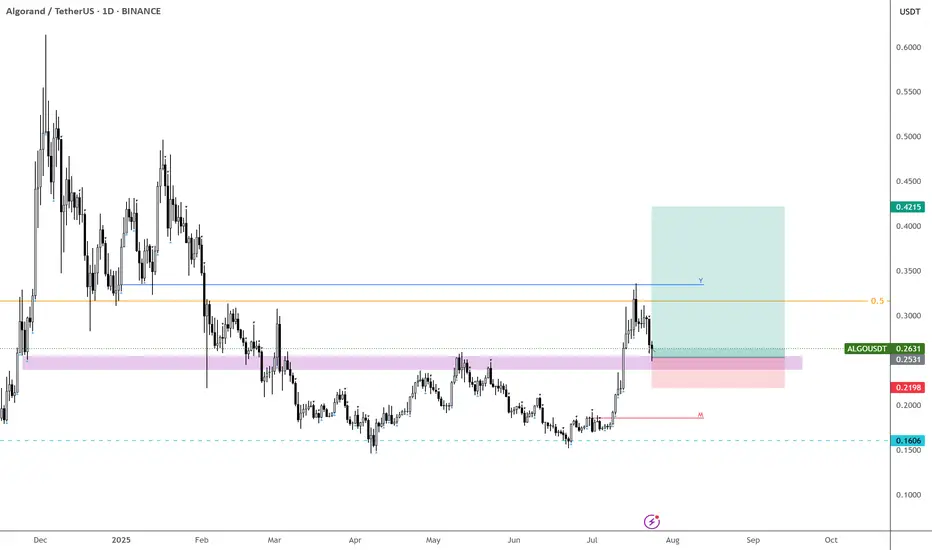
ALGO – Finally Getting the Retrace
Back at EURONEXT:ALGO —missed the lows, but finally seeing the retrace I’ve been waiting for.
Should’ve entered alongside CRYPTOCAP:HBAR , but this is the next best spot.
If this level doesn’t hold, we’re likely heading back below 20c, and many alts could retrace their entire impulse moves.
Starting to bid here—let’s see if it holds. BINANCE:ALGOUSDT
ALGOUSDT Approaching Breakout!BINANCE:ALGOUSDT is showing a potential trend reversal after bouncing from a strong historical demand zone around $0.15. Price action is testing the descending trendline for a breakout, which could trigger a bullish continuation move. Similar to the previous breakout in late 2024, this setup hints at a possible repeat rally. A weekly close above the trendline would confirm strength, opening targets at $0.32 and $0.70+.
COINBASE:ALGOUSD

Algorand breaking up from inverse head and shouldersSeems like most of the cryptos from the iso20022 compliant chains are breaking out right now and algorand is no exception. Most likely in anticipation of Fednow’s migration to it tomorrow. *not financial advice*

Algorand ALGO price analysis#Algo price is being held back from a deep dive, as far as it is appropriate to say that about altcoins right now.
The price decline on reduced volumes is similar to the previous two times on the OKX:ALGOUSDT chart.
🙂 A risky purchase from $0.15, if they hold the price there, it will be very cool.
📈 And if not, then “buckets” for buying in the $0.10-0.11 range, if you believe in the prospects of the #Algorand project
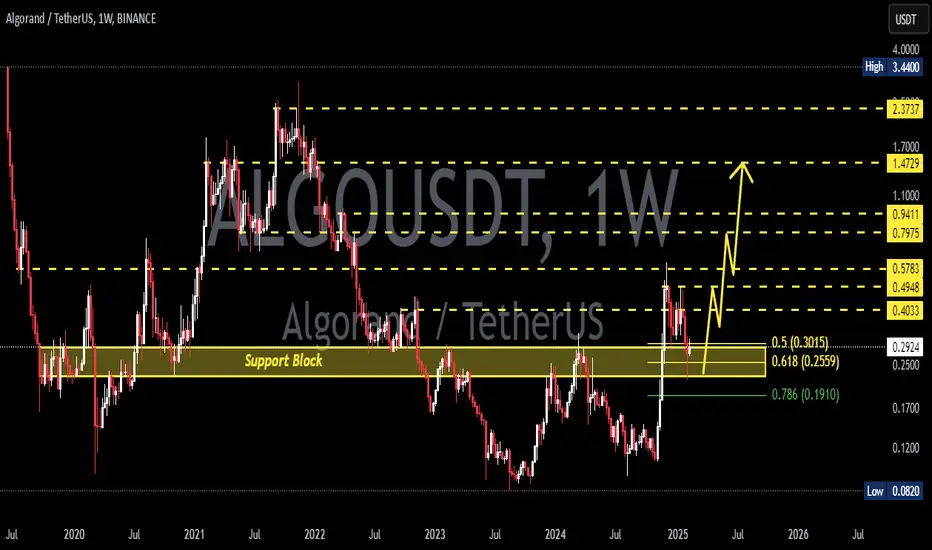
👊 And keep your fingers crossed, because there is a hypothetical chance that the price of #ALGO will rise to the $1.35-1.41 range by the end of this year, but everyone will have to be very lucky)
____________________
Did you like our analysis? Leave a comment, like, and follow to get more

ALGOUSDT 1W AnalysisALGO ~ 1W Analysis
#ALGO Buy back gradually from here with a short-term target of at least 20%++.
ALGOUSDT 1D AnalysisALGO ~ 1D Analysis
#ALGO Buy back gradually from here with a short term target of at least 15%+ from here.

ALGOUSDT making its way for journey towards 0.35$Here is the idea about ALGOUSDT.
The price is currently trading at daily support DS1.
The price was rejected from weekly resistance WR1 before coming back to daily support zone DS1.
I believe this daily support is very likely to provide support and make the price bounce from here.
The likely trajectory of the price is depicted in the chart.
The price is likely to aim for weekly resistance WR1 next on this bounce.
At WR1, the price is likely to face some pullback before ripping this resistance and target the next strong resistance which is quarterly resistance 3MR1.
Lets monitor this one as we go and adjust our expectations. But for now this is what I see as the likely path for ALGOUSDT.
Whats your thought?

How To Spot The Next Big Algorand Crypto Move!In the fast-paced world of crypto trading, many traders gravitate toward intraday and scalping strategies, chasing quick profits while often ignoring the powerful signals presented by higher timeframes. Yet, the smart money — institutional players, whales, and seasoned swing traders — operate differently. They focus on bigger timeframe supply and demand imbalances to enter high-probability trades with calculated risk and substantial reward potential. One such opportunity is currently setting up in Algorand ( BINANCE:ALGOUSDT ).
Why Higher Timeframes Matter in Crypto Trading
Most crypto traders operate on the 1-minute to 15-minute charts. While this can be effective, especially with crypto intraday strategies, it often leads to overtrading and emotional decision-making. In contrast, higher timeframes — such as the daily and weekly charts — provide clearer market structure, show major supply and demand imbalances, and are less noisy.
These timeframes reveal where whales and institutions place large orders, creating impulsive moves that leave behind clues for patient traders. Ignoring these clues is akin to trading blind.
The Weekly Demand Imbalance on BINANCE:ALGOUSDT
BINANCE:ALGOUSDT is currently showcasing a textbook example of a solid and strong weekly demand imbalance around the $0.1380 level. A few months ago, this zone sparked a massive bullish impulse — a series of consecutive large-bodied white candlesticks that broke through resistance with conviction.
Such moves don’t happen randomly. They’re often the result of institutional accumulation — smart money stepping in with size. These large players create imbalances where demand far outweighs supply, causing prices to rally aggressively. The key for retail traders is to identify the origin of these moves and wait patiently for the price to return.

ALGO/USDT Technical Analysis Deep Dive! Let’s break down this ALGOUSDT chart step-by-step — it’s a perfect example of trading patterns in action!
🏄♂️ Timeline (Aug 2024 - April 2025):
▸ Accumulation (Aug - Nov 2024): ALGO consolidates between $0.1050 and $0.1450, showing low volatility. This is a classic accumulation phase where buyers are quietly building positions.
▸ Breakout & Uptrend (Nov - Dec 2024): Boom! The price breaks above $0.1300 with strong momentum, climbing to $0.6100.
▸ Pause in a Symmetrical Triangle (Dec 2024 - Jan 2025): After the surge, ALGO takes a breather, forming a Descending Triangle (a neutral pattern). This signals market indecision — traders are waiting for the next big move.
▸ Breakout & Downtrend (Jan - Mar 2025): The price breaks below the triangle, dropping to $0.1480. This aligns with a "Descending Wedge" (reversal) from the cheat sheet , confirming the downtrend and reversal structure of the Wedge.
▸ Consolidation (Mar - Apr 2025): ALGO stabilizes between $0.1400 and $0.1600, setting the stage for the next move.
▸ Breakout & Uptrend (Apr - April 2025): Another breakout! The price surges above $0.1600, reaching $0.2200 again. It might reach higher levels like $0.2400 and $0.3000 in next weeks.
This chart shows how patterns like Descending Triangles, and Wedges can guide your trades. Spotting these using my Trading Patterns Cheat Sheet can help you time your entries and exits like a pro!
✉️ What’s your next move on ALGO? Are you buying the dip, waiting for confirmation, or taking profits? Drop your thoughts below — I’d love to hear your strategy!

ALGOUSDT 1DALGO ~ 1D Analysis
#ALGO When this bullish pattern is successful, the sustainable increase may bring the price of this coin to increase at least 10%+ from here.

Algorand Consolidation "Pointing" To An End??Here we can see COINBASE:ALGOUSD is about finished forming a Continuation Pattern, the Bullish Wedge!
Price has made an impressive .50 increase since Trump taking office but has slipped into quite a steep Consolidation Phase where Price has made run for the 88.6% Retracement and seems to be filling out the rest of the "Point" of the Wedge!
Accompanying the Chart Pattern is a Decrease in Volume as well, signaling the tight Consolidation could be looking to make a break soon!
*With a True Breakout, we will want to be vigilant of multiple factors coming into play with Increase of Volume to Validate the Break of Pattern!
Once the Pattern is Confirmed and a Breakout Validated, based on the "Flagpole" of the Pattern, we could expect a potential extension of price to go behind the current Swing High of .6133 and up into the .70 area!

ALGO at Golden Buy Zone | Low-Risk, High-Reward Setup (1D)The higher timeframe structure of ALGO on the weekly chart is still bullish, but on the daily and hourly timeframes, the structure is bearish. That’s why we expect major players to enter ALGO at key support zones.
Currently, it is consuming orders within the demand zone, and it is expected to eventually reach the POI and then move toward the targets.
If strong buyers step in, the price could reach the red box.
A daily candle closing below the invalidation level would invalidate this analysis.
For risk management, please don't forget stop loss and capital management
When we reach the first target, save some profit and then change the stop to entry
Comment if you have any questions
Thank You

ALGO, preppin for a MASSIVE ASCEND this Q2 2025 from 0.18ALGO is preppin for a massive shift based on the latest price behavior.
After goin parabolic late last year -- tapping the 0.50 mark, algo like the rest succumb to red season -- had to experience corrective pressure of the market and touching a weighty trim down to sub 0.20 area.
Today, an apparent bear saturation has been spotted. Based on the diagram we are seeing some basing zone at the higher channel -- price is being magneted on this higher area; inching closer as days progresses on that exit zone hinting a possible break in structure soon.
Ideal seeding area is the current price at 0.180.
Spotted at 0.18
Mid target at 0.5
Long term. 0.50
TAYOR. Trade safely.

ALGO Ready to Break Out—or Fake Out? Watch This Critical ZoneYello, Paradisers! have you been watching #ALGOUSD’s recent moves closely—or are you about to miss the bounce that could catch 90% of traders off guard?
💎After topping out in December 2024, ALGO entered a clear corrective phase. That correction just completed an ABC zigzag pattern right into a strong support region, slightly above its key weekly level—a zone where buyers historically step in.
💎#ALGOUSDT is showing clear bullish reactions between the 0.165–0.145 levels. More importantly, a complex bullish divergence is forming—on both RSI and MACD. This is your first warning sign that the bears are losing steam and bulls are ready to step back into control.
💎On the upside price must break and hold above the moderate resistance zone at 0.22 level. A successful reclaim here would not only validate the divergence but also represent a deviation reclaim, where price recovers a previously broken support level.
💎If this reclaim is successful and supported by volume, the next key zone to monitor is between 0.25 and 0.275. This region carries particular significance, as it aligns with both the descending trendline resistance and the 25% Fibonacci retracement. It is a critical level that will likely determine whether the current bounce evolves into a sustained bullish leg.
💎Should buyers maintain momentum beyond that point, the next upside target lies between 0.365 to 0.380 levels.
Paradisers, strive for consistency, not quick profits. Treat the market as a businessman, not as a gambler.
MyCryptoParadise
iFeel the success🌴

Will ALGORAND'S 'anti Trump' management team kill the project?ALGORAND has some serious potential in regard to its technology and its use case, but it’s well known that the people behind ALGO are publicly—and unfortunately loudly—against Trump and his agenda to 'Make America Great Again' and to make 'America the crypto capital of the world.'
I like ALGORAND's project and technology, but I also think that the management's inability to keep their political opinions to themselves, and instead focus on their business model, could end up working against ALGO over the next four years. I think it’s not only a bad idea to take a public political stance as they have when you have a business to run, but their poor judgment could severely hurt ALGO investors over the course of the current administration. But, let’s hope that isn’t the case.
Good luck, and always use a stop loss!

ALGO buy setup (1D)Here, we have a high-potential zone for ALGO.
The green zone represents strong support, and if the price reaches this area, we will look for buy/long positions.
The red box is a fresh order block that hasn’t been tapped yet, containing the main sell orders.
The target can be this red box.
Closing a daily candle below the invalidation level will invalidate this analysis.
For risk management, please don't forget stop loss and capital management
Comment if you have any questions
Thank You

#ALGO/USDT#ALGO
The price is moving in a descending channel on the 1-hour frame and is expected to continue upwards
We have a trend to stabilize above the moving average 100 again
We have a descending trend on the RSI indicator that supports the rise by breaking it upwards
We have a support area at the lower limit of the channel at a price of 0.2351
Entry price 0.2434
First target 0.2479
Second target 0.2536
Third target 0.2594

Is an 11X in the cards for ALGO, taking price to $2.00 +?The days of "alt-coin season" are over, and we are now living in the time of Utility Season. Many cryptocurrencies that lack real-world utility simply didn't rally much, if at all, during the "Trump pump." Did you ever ask yourself why? Because the days of speculation are coming to an end, and the new era of utility is quickly becoming the law of crypto.
Ninety-nine percent of cryptocurrencies will not survive what's coming, and if your chosen crypto isn't on the ISO 20022 list, then kiss it goodbye!
ALGO will be one of the few chosen beneficiaries of Utility Token Season and is looking like the charts could indicate a run-up of around 11X to the $2.00+ level in the coming 6 to 9 months.
Good luck, and always use a stop loss!

ALGO ANALYSIS (1D)ALGO's structure is still bullish on higher timeframes and will remain so unless the origin of the previous bullish wave is broken.
We have a low-risk Rebuy zone where spot entries can be made gradually within this range.
The target could be the supply zone.
A daily candle closing below the invalidation level would invalidate this analysis.
Do not enter the position without capital management and stop setting
Comment if you have any questions
thank you

Is ALGO Finally Bottoming Out? A Massive Move Could Be Coming!Yello, Paradisers! #ALGOUSDT is flashing major reversal signals, and if the pattern plays out, a big move could be on the horizon. Are the bulls finally ready to step in? Let’s break it down!
💎#ALGO has been stuck in an A-B-C correction pattern, with Wave A kicking off the downtrend, Wave B bringing a retracement, and Wave C completing the correction. But here’s where it gets interesting—ALGO is now showing signs of accumulation, hinting that bulls might be gearing up for the next impulsive wave.
💎To confirm the reversal, ALGO must break the $0.33 resistance. If bulls successfully push past this level, momentum could accelerate, sending price toward the descending resistance at $0.37. This is a pivotal breakout level, and clearing it would give bulls the strength to aim for the $0.46–$0.50 resistance zone—the 61.8% Fibonacci retracement, a historically strong level where major reactions tend to happen.
💎On the downside, ALGO has solid support at $0.265–$0.250, a key demand zone that bulls have defended since November 2024. As long as this support holds, the probability of a strong move higher remains intact.
Paradisers, as always, patience and precision are key in this market. This isn’t a time for reckless trades—let the levels guide you, trade strategically, and stay disciplined.
MyCryptoParadise
iFeel the success🌴

ALGOUSDT 1WALGO ~ 1W Analysis
#ALGO If you still have a Conviction on this coin. Maybe this is very good support to start buying again from here.