Algorand (ALGO) - October 18Hello?
Welcome, traders.
By "following", you can always get new information quickly.
Please also click "Boost".
Have a good day.
-------------------------------------
(ALGOUSDT 1W Chart)
The key is whether it can rise above the 0.3310-0.4253 section.
(1D chart)
The key is whether it can be supported by rising above the 0.3310-0.3425 section.
In order to continue the uptrend, it must rise above the 0.3722-0.3938 section.
If it goes down, you should check to see if it finds support at the 0.2865-0.3091 zone.
The 0.3310 point or lower is most likely a mid- to long-term investment area.
Therefore, it is important to keep the price above 0.3310.
However, since the volume profile section is formed around 0.4253, it is recommended to trade from a short-term perspective until it rises above 0.4253.
------------------------------------------------------------ -------------------------------------------
** All descriptions are for reference only and do not guarantee a profit or loss in investment.
** If you share this chart, you can use the indicators normally.
** The MRHAB-T indicator contains indicators that indicate support and resistance points.
** HA SRRC indicators are expressed as StochRSI(line), RSI(columns), CCI(bgcolor).
** CCI indicator is expressed as overbought range (CCI > +100) and oversold range (CCI < -100).
(Short-term Stop Loss can be said to be a point where profit and loss can be preserved or additional entry can be made through split trading. It is a short-term investment perspective.)
---------------------------------
Algousd

ALGO SHORTConsidering the price correction, I give the probability of this move, you can sit without a trigger guard with the STOP LOSS of the last HH or wait for a more reliable trigger.

ALGO Algorand still accumulation phase..after 4 months. Time is running out slowly.
1st target top of the channel, once surpassed $1.00-1.30 will be the next target
Hold my beer pls
----
No financial advice, do your own research, don't be stupid
AlgorandAlgorand create an falling wedge...
Algorand, the green blockchain.
We are born sustainable!
Algorand is far more energy efficient than other blockchains, and is going further by offsetting its small carbon footprint in partnership with ClimateTrade.

Algorand (ALGO) formed bullish Gartley for upto 34.50% rallyHi dear friends, hope you are well and welcome to the new trade setup of Algorand (ALGO) with US Dollar pair.
Previously we had a nice trade of ALGO:
Now on a daily time frame, ALGO has formed a bullish Gartley pattern.
Note: Above idea is for educational purpose only. It is advised to diversify and strictly follow the stop loss, and don't get stuck with trade

Algorand (ALGO) - October 8Hello?
Welcome, traders.
By "following", you can always get new information quickly.
Please also click "Boost".
Have a good day.
-------------------------------------
(ALGOUSDT 1W Chart)
Whether or not it can move higher than 0.6704 is key.
To do this, it is necessary to check whether it is supported and ascends in the 0.3310-0.4253 section.
(1D chart)
We need to see if we can keep the price above 0.3310.
If it falls below the 0.2865-0.3091 range, there is a possibility that it will fall to around 0.2140.
------------------------------------------------------------ -------------------------------------------
** All descriptions are for reference only and do not guarantee a profit or loss in investment.
** If you share this chart, you can use the indicators normally.
** The MRHAB-T indicator contains indicators that indicate support and resistance points.
** SR_R_C indicators are displayed as StochRSI(line), RSI(columns), CCI(bgcolor).
** CCI indicator is expressed as overbought range (CCI > +100) and oversold range (CCI < -100).
(Short-term Stop Loss can be said to be a point where profit and loss can be preserved or additional entry can be made through split trading. It is a short-term investment perspective.)
---------------------------------

ALGOUSD ❕ exit from oversold areaOn the 1H Timeframe the RSI has exited the oversold zone.
Price is testing 200EMA as support on the 4H Timeframe.
I believe the asset could rebound if it consolidates above current support.

$Algo golden cross formation is about to begin don't miss!$$$Algo golden cross formation is about to begin. I recommend you all to watch this coin, which has a potential of 600 percent and more, the first stop is 0.4 cents. don't miss it. Good trades, not investment advice.

ALGO - Buying SignalBYBIT:ALGOUSDT
4H time frame
-
ALGO is in a descending channel, and it started to form this channel since increased by 41%.
The price stops making lower lows and hit Fib 0.382 smoothly for support confirmation.
We can long it at 0.34 and add more position at 0.335(Fib retracement level_0.382)
-
Entry: 0.34
Add: 0.335
TP: 0.3565, 0.3735
SL: 0.33

Algorand (ALGO) - September 29Hello?
Welcome, traders.
By "following", you can always get new information quickly.
Please also click "Like".
Have a good day.
-------------------------------------
(ALGOUSDT 1W Chart)
The key is whether you can support and move up in the 0.3310-0.4253 zone.
(1D chart)
0.4253 : volume profile point
0.3310: boundary point of the floor section
0.3091 : volume profile point
Therefore, it is important to be able to support and move up in the 0.3091-0.4253 zone.
As it has moved out of the mid- to long-term downtrend channel, if it finds support in the above area, I would expect a sharp move.
However, if it fails to find support and falls below 0.3091, I would expect it to fall below 0.2140.
However, as I mentioned in the description of the BTC chart, I think it is time for altcoins to gain support by increasing the BTC price by at least 20.7K.
Therefore, before that, it is recommended to trade conservatively when trading altcoins.
------------------------------------------------------------ -----------------------------------------------------
** All descriptions are for reference only and do not guarantee a profit or loss in investment.
** If you share this chart, you can use the indicators normally.
** The MRHAB-T indicator contains indicators that indicate support and resistance points.
** SR_R_C indicators are displayed as StochRSI(line), RSI(columns), CCI(bgcolor).
** CCI indicator is expressed as overbought range (CCI > +100) and oversold range (CCI < -100).
(Short-term Stop Loss can be said to be a point where profit and loss can be preserved or additional entry can be made through split trading. It is a short-term investment perspective.)
---------------------------------

ALGOUSD - Strong Bottoms ALGO has formed a large falling wedge which is common among many crypto coins currently
The green horizontal is a strong support line, using the curved line to show the kind of cup structure price is forming once hitting this green line
It is a very bullish structure
Lets see how it plays out

#ALGO, Showing the biggest volume activity since May#ALGO
Showing the biggest volume activity since May as its trying to bounce from lowest value since 2020
Both 2D/3D Buy signals from the UCTS already in the charts
taking a small position here & watching how it develops because I'm still a little skeptic about any relief rally

ALGOUSDT Buy Setup!ALGOUSDT Technical analysis update
Buy zone : $0.355 - $0.365
Stop loss : $0.324
TP 1 : $0.395
TP 2 : $0.431
TP 3 : $0.505
Always keep stop loss
Thanks
Hexa

ALGO Algorand text book styleAbsolutely bullish setup as long at the 0.279 low is holding.
1) Big Falling Wedge
2) Some side way action for accumulation
What next?
Most likely some 3-9x run.
Whether corrective or impulsive we shall see
Hold my beer pls
----
No financial advice, do your own research, don't be stupid

Algorand looks ready to trigger its inv h&s patternAfter doing a fakeout above the yellow neckline we now have price action for king above the white neckline….not sure which one will be the most valid but if the white neckline reaches its target they both do. I imagine it will be retesting the 1day 200ma before too long. *not financial advice*

ALGOUSD ❕ expanding channelTrading volumes are increasing as the price rises.
ALGO continues to be above liquidity.
TD Sequential has formed a reversal signal upwards (1H TF)
I believe that the asset may continue to grow if it fixes above the support level.

Algorand #ALGO - better not lose FIB golden pocketAlgorand currently at FIB golden pocket between $0.3118 - $0.3487
Next lower volume profile support at $0.2271 - losing that FIB 78.6% at $0.1939 is the typical last Crypto support
A bullish divergence on RSI might help ALGO for a recovery soon IMO
COMMENTS & FOLLOW appreciated
*not financial advice
do your own research before investing

Algorand (ALGO) - September 20Hello?
Welcome, traders.
By "following", you can always get new information quickly.
Please also click "Like".
Have a good day.
-------------------------------------
(ALGOUSDT 1W Chart)
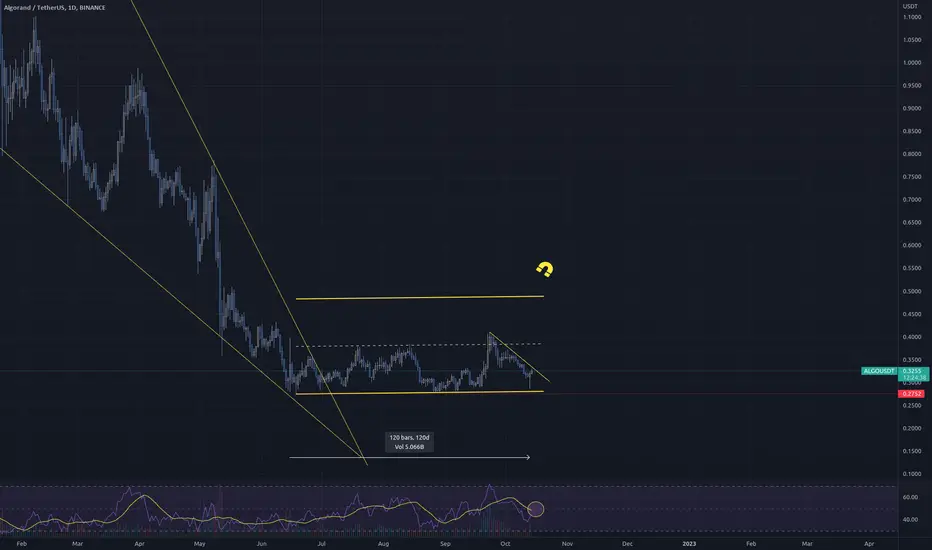
The key is whether it can rise above the 0.3310-0.4478 section.
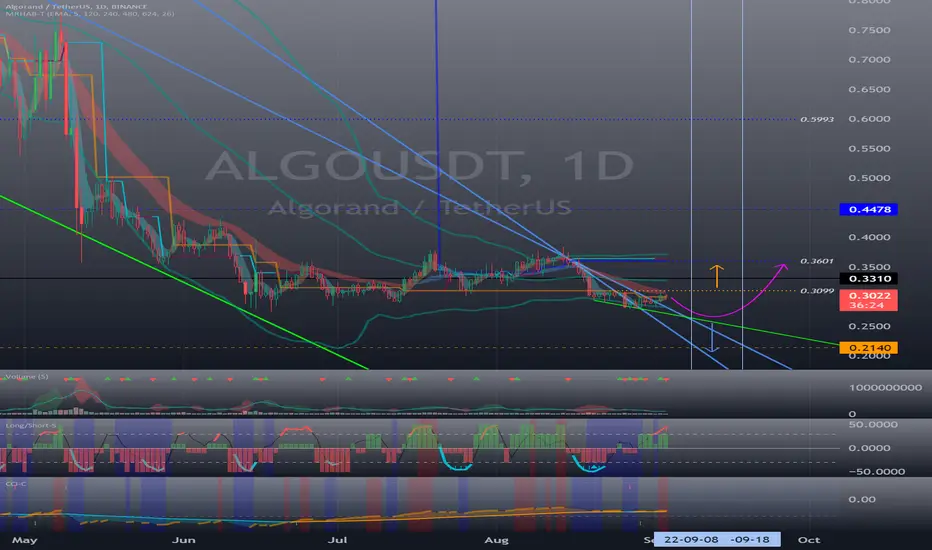
(1D chart)
The price needs to remain above 0.3099 to transition into an uptrend.
In order to continue the uptrend, it must rise above the 0.3642-0.3872 section.
If not, there is a possibility that it will fall to around 0.2140.
------------------------------------------------------------ -------------------------------------------
** All descriptions are for reference only and do not guarantee a profit or loss in investment.
** The MRHAB-T indicator, which is inactive on the chart, contains indicators that indicate support and resistance points.
** Background color of Long/Short-S indicator: RSI oversold and overbought sections
** Background color of CCI-C indicator: When the short-term CCI line is below -100 and above +100, oversold and overbought sections are displayed.
** The OBV indicator was re-created by applying a formula to the DepthHouse Trading indicator, an indicator disclosed by oh92. (Thanks for this.)
(Short-term Stop Loss can be said to be a point where profit and loss can be preserved or additional entry can be made through split trading. It is a short-term investment perspective.)
---------------------------------

ALGOHello guys this is my trading analysis about ALGO thank you
IF you like my work please like share and follow thanks
TURTLE TRADER 🐢

Algorand (ALGO) - September 4Hello?
Welcome, traders.
By "following", you can always get new information quickly.
Please also click "Like".
Have a good day.
-------------------------------------
(ALGOUSDT 1W Chart)
The 0.3310 point is an important support and resistance point, and whether we can move higher than 0.3310 is crucial.
(1D chart)
It is mixed, so you need to be careful with your trade.
Therefore, it is necessary to confirm whether it can be supported by rising above the 0.3310 point.
- In order to continue the upward trend from the current position, it must rise above 0.3601.
- For those who are investing in ALGO, we recommend that you take the time to trade to increase the number of coins (tokens) you have.
From a mid- to long-term perspective (at least 6 months to 1 year or more), a large uptrend is expected.
------------------------------------------------------------ -------------------------------------------
** All descriptions are for reference only and do not guarantee a profit or loss in investment.
** The MRHAB-T indicator, which is inactive on the chart, contains indicators that indicate support and resistance points.
** Background color of Long/Short-S indicator: RSI oversold and overbought sections
** Background color of CCI-C indicator: When the short-term CCI line is below -100 and above +100, oversold and overbought sections are displayed.
** The OBV indicator was re-created by applying a formula to the DepthHouse Trading indicator, an indicator disclosed by oh92. (Thanks for this.)
(Short-term Stop Loss can be said to be a point where profit and loss can be preserved or additional entry can be made through split trading. It is a short-term investment perspective.)
---------------------------------
Algorand (ALGO) - August 23Hello?
Welcome, traders.
By "following", you can always get new information quickly.
Please also click "Like".
Have a good day.
-------------------------------------
(ALGOUSDT 1W Chart)
The key is whether it can rise above 0.3310 and find support.
(1D chart)
If it does not rise above the 0.3099-0.3310 section, there is a possibility that it will fall to around 0.2140.
- Since the RSI, Stoch RSI, and CCI(9) indicators have all entered the oversold zone, if they start to break out of the oversold zone, it is likely to lead to a big rise.
To do that, you need to find support at or above the 0.3099-0.3310 range when you break out of the oversold zone.
If it doesn't and it's finding resistance as it is now, it's likely to lead to further declines.
------------------------------------------------------------ -------------------------------------------
** All descriptions are for reference only and do not guarantee a profit or loss in investment.
** The MRHAB-T indicator, which is inactive on the chart, contains indicators that indicate support and resistance points.
** Background color of Long/Short-S indicator: RSI oversold and overbought sections
** Background color of CCI-C indicator: When the short-term CCI line is below -100 and above +100, oversold and overbought sections are displayed.
** The OBV indicator was re-created by applying a formula to the DepthHouse Trading indicator, an indicator disclosed by oh92. (Thanks for this.)
(Short-term Stop Loss can be said to be a point where profit and loss can be preserved or additional entry can be made through split trading. It is a short-term investment perspective.)
---------------------------------

ALGORAND to $100 (£82) BY 2026?- IS20022 COMPLIANT crypto
- Fast and cheap to move money!
- Partnering up with FIFA 2022!

$ALGOUSDT - Reversal play with +30% upsideTechnical Analysis (TA)
We are seeing a breakout from the wedge and early reversal signs on the weekly chart.
We should expect price to reach between 0.42 and 0.50.
Price Target
Entry: 0.38
Target 1: 0.42
Target 2: 0.50
