$ALGO ALGOBought some algo here , will cut if daily close back below 0.3248, thesis: algo cooperation with FIFA ( 30 days to world cup)
ALGOUSDT

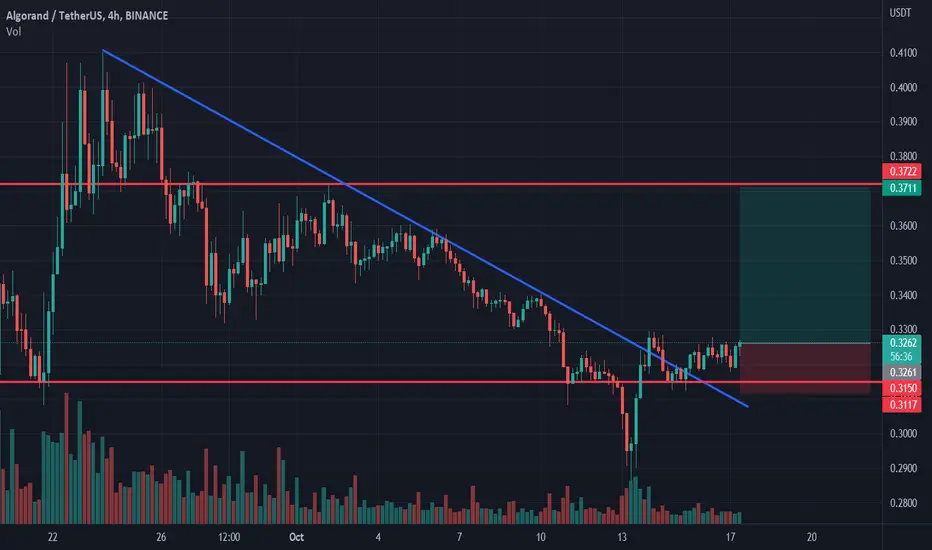
Algorand longAlgorand bounced off the support level. Asset broke trough off the descending trendline. Bullish movement to resistance level at 0.371 is possible.
ALGO completes recontest - time for longUpon the break of triangular patterns, the best time to open a trade is when it comes back down to test the triangle as support. If you zoom in, this is exactly what ALGO has done.
Therefore, it is a great time to go long.
The TP levels are set on the chart, and I'm sure it will continue higher after as well.

ALGO retest Algo is retesting the diagonal breakout.
Imbalanced areas to be filled.
Market is errational be cautious.

ALGO/USDT Short...ALGO/USDT Sell.... This is not signal... Don't risk more than 3% of your account on any trade...
ALGO SHORTConsidering the price correction, I give the probability of this move, you can sit without a trigger guard with the STOP LOSS of the last HH or wait for a more reliable trigger.

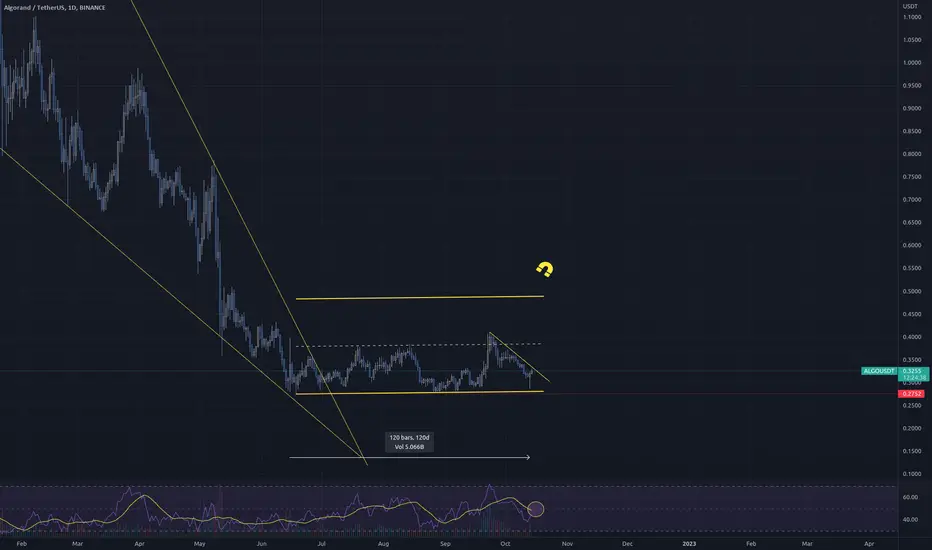
ALGO Algorand still accumulation phase..after 4 months. Time is running out slowly.
1st target top of the channel, once surpassed $1.00-1.30 will be the next target
Hold my beer pls
----
No financial advice, do your own research, don't be stupid
AlgorandAlgorand create an falling wedge...
Algorand, the green blockchain.
We are born sustainable!
Algorand is far more energy efficient than other blockchains, and is going further by offsetting its small carbon footprint in partnership with ClimateTrade.

ALGO Scalp longIdea is to take ALGO trendline breakout while BTC is bullish too:
- ATR is full at short direction
- We are under VWAP
- Market needs a pullback
- 3rd touch
- At bottom we already collected liquidity. It would be logical to go for stoplosses at high
If you like the idea, please, press a like to let me know that my work is valuable for you. Thank you and trade wisely!💓😊

Algorand (ALGO) formed bullish Gartley for upto 34.50% rallyHi dear friends, hope you are well and welcome to the new trade setup of Algorand (ALGO) with US Dollar pair.
Previously we had a nice trade of ALGO:
Now on a daily time frame, ALGO has formed a bullish Gartley pattern.
Note: Above idea is for educational purpose only. It is advised to diversify and strictly follow the stop loss, and don't get stuck with trade

ALGO/USDT Long ---> Short... ALGO/USDT... This is not signal... Dont risk more than 3% of your account on any trade...

Algorand (ALGO) - October 8Hello?
Welcome, traders.
By "following", you can always get new information quickly.
Please also click "Boost".
Have a good day.
-------------------------------------
(ALGOUSDT 1W Chart)
Whether or not it can move higher than 0.6704 is key.
To do this, it is necessary to check whether it is supported and ascends in the 0.3310-0.4253 section.
(1D chart)
We need to see if we can keep the price above 0.3310.
If it falls below the 0.2865-0.3091 range, there is a possibility that it will fall to around 0.2140.
------------------------------------------------------------ -------------------------------------------
** All descriptions are for reference only and do not guarantee a profit or loss in investment.
** If you share this chart, you can use the indicators normally.
** The MRHAB-T indicator contains indicators that indicate support and resistance points.
** SR_R_C indicators are displayed as StochRSI(line), RSI(columns), CCI(bgcolor).
** CCI indicator is expressed as overbought range (CCI > +100) and oversold range (CCI < -100).
(Short-term Stop Loss can be said to be a point where profit and loss can be preserved or additional entry can be made through split trading. It is a short-term investment perspective.)
---------------------------------

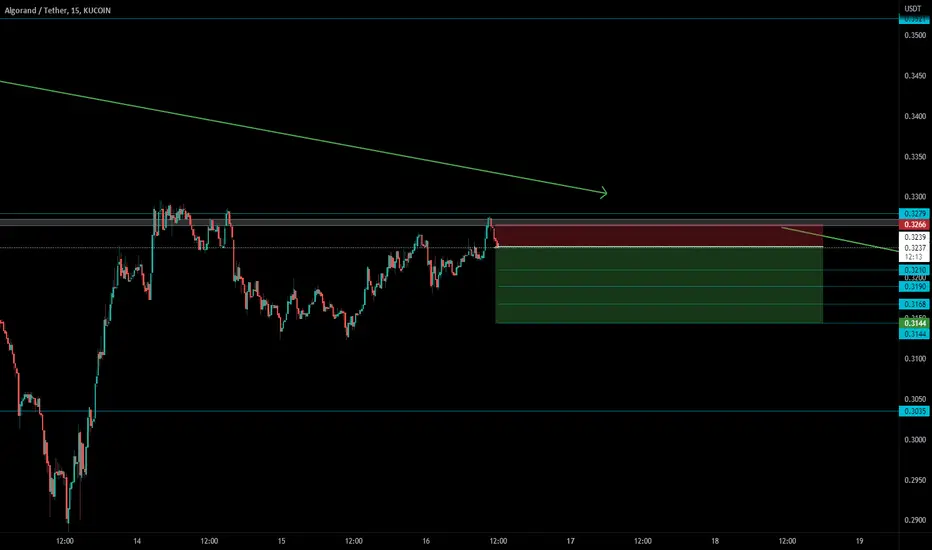
Algorand shortAlgorand bounced off the resistance level. Asset broke trough the ascending trendline. Bearish movement to support level at 0.29 is possible.
$Algo golden cross formation is about to begin don't miss!$$$Algo golden cross formation is about to begin. I recommend you all to watch this coin, which has a potential of 600 percent and more, the first stop is 0.4 cents. don't miss it. Good trades, not investment advice.

Algo longCan try out Algo for a long here.
There is a version of C&H here. However on calculation it is a failed C&H as it went beyond the allowed depth of the handle by 9%.
I still thought it would be a good test with a tight stop loss shown.
Stop loss shown.


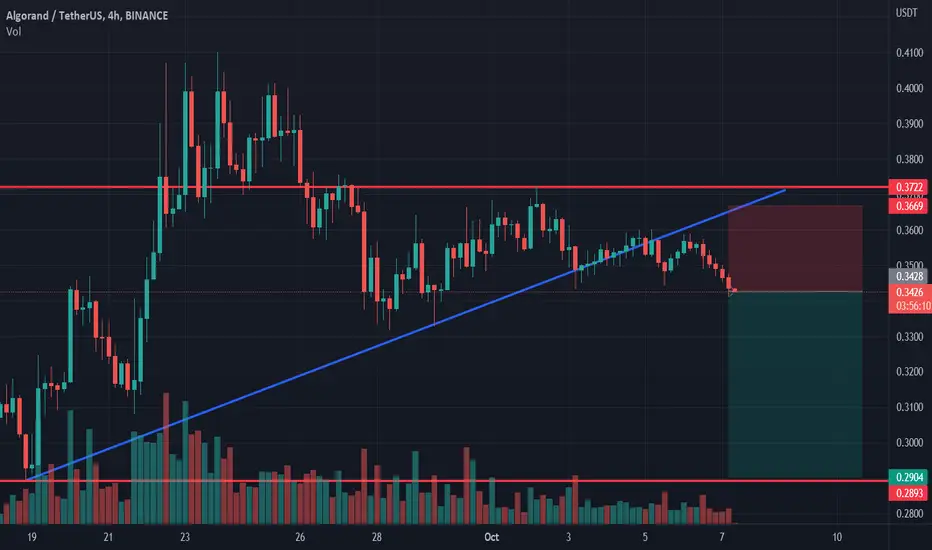
Algo - Pivotal MomentAlgo has been forming a bullish pennant structure on the 4H time frame.
Depending on how it breaks the structure, we might see strong price action.
Right now it seems to be breaking the bullish trendline on the downside.
Remain cautious and operate with tight stop loss

Algorand longAlgorand bounced off the lower boundary of ascending channel. Bullish movement to resistance level at 0.372 is possible.

Another potential $ALGO short play...BINANCE:ALGOUSDTPERP - Has bounced at support -
moving up towards heavy resistance (blue zone) which given rapidly declining OI and Binance crowd aping into linear "line-break" from recent high -
Not a continuation traded - aim for reversion
SL would be at prior high or narrative switch.
Otherwise. Goblin time.

ALGO longAlgo looks bullish as market is starts firing longs
⭐️ BTC has similar trendline
⭐️ Accumulating on local level
⭐️ 4th approach
⭐️ Volume at bottom
⭐️ 40 ATR
⭐️ Over VWAP
Will enter when price slowly squeezes to the trendline on 5m timeframe, the base will form and the tape will get faster.
Fix profit by parts:
1% - 1/3
2% - 1/3, stoploss to breakeven
What's left, hold to the maximum
If you like the idea, please, press a like to let me know that my work is valuable for you. Thank you and trade wisely!💓😊

ALGO - Buying SignalBYBIT:ALGOUSDT
4H time frame
-
ALGO is in a descending channel, and it started to form this channel since increased by 41%.
The price stops making lower lows and hit Fib 0.382 smoothly for support confirmation.
We can long it at 0.34 and add more position at 0.335(Fib retracement level_0.382)
-
Entry: 0.34
Add: 0.335
TP: 0.3565, 0.3735
SL: 0.33

Algorand (ALGO) - September 29Hello?
Welcome, traders.
By "following", you can always get new information quickly.
Please also click "Like".
Have a good day.
-------------------------------------
(ALGOUSDT 1W Chart)
The key is whether you can support and move up in the 0.3310-0.4253 zone.
(1D chart)
0.4253 : volume profile point
0.3310: boundary point of the floor section
0.3091 : volume profile point
Therefore, it is important to be able to support and move up in the 0.3091-0.4253 zone.
As it has moved out of the mid- to long-term downtrend channel, if it finds support in the above area, I would expect a sharp move.
However, if it fails to find support and falls below 0.3091, I would expect it to fall below 0.2140.
However, as I mentioned in the description of the BTC chart, I think it is time for altcoins to gain support by increasing the BTC price by at least 20.7K.
Therefore, before that, it is recommended to trade conservatively when trading altcoins.
------------------------------------------------------------ -----------------------------------------------------
** All descriptions are for reference only and do not guarantee a profit or loss in investment.
** If you share this chart, you can use the indicators normally.
** The MRHAB-T indicator contains indicators that indicate support and resistance points.
** SR_R_C indicators are displayed as StochRSI(line), RSI(columns), CCI(bgcolor).
** CCI indicator is expressed as overbought range (CCI > +100) and oversold range (CCI < -100).
(Short-term Stop Loss can be said to be a point where profit and loss can be preserved or additional entry can be made through split trading. It is a short-term investment perspective.)
---------------------------------

💰ALGORAND analysis in One-hour time🔥🔰You can see Algorand's cryptocurrency analysis in a one-hour time frame (ALGOUSDT_ 1H)🔍💣
💥The price behavior is clear in the picture🧐 If the price can reach the DEMAND zone, it can experience an upward trend up to the Downward trend line🖤, and if it can break the Downward trend line🖤 upwards and stabilize❗ above it, it can have an upward trend up to the SUPPLY zone 🚀🔺
Do you think this analysis can be profitable❓
I hope the analysis was useful for you🤍🌹
📌Please introduce the channel to your friends 🙏🏻
__________📈TRADER STREET📉___________
