AGLO descending wedge breakout confirmed - LONGALGO descending wedge - a bullish breakout has been confirmed.
Take profits along the fib level in the chart.
Previous with this pattern on a longer time is below
ALGOUSDT

Algorand (ALGO/USDT analysis)📉📈
HEY traders, what's going on today ?!
Since 21 Feb2021, when I posted the ' Algorand ' analysis and after reaching its ATH ,it has been declining till now ,although according to my analysis first it declined to the
lower entry point then jumped from there , but wasn't able to rise more as much as I predicted . (more than 320%💰 (1x)long).
So today I'm gonna have another analysis on the weekly timeframe for Algo/usdt , and as you can can see after finishing the ascendant Eliot waves , it started the corrective wave (ABC) ,and already trading below the important pivot zone and between (38.2 -23.6 ) of fibo Level . so if it be able to breakout the descending trendline and overcome the pivot zone it can retest the higher resistance zone . but otherwise it will fall again to lower support lvls.
✌️ Good luck with your trading and investing and remember: Trade smart…OR JUST DON’T TRADE!
--------------------------------------------------------------------------------------------------------------------
👉This analysis is my personal opinion ,not a financial advice ,so do your own research.
💚if you're fan of my analyses please follow me , give a big thumbs 👍 OR drop a comment 🗯

Algorand longAlgorand bounced off the lower boundary of ascending channel. Bullish movement to resistance area at 0.323 is possible.

Coins I am looking to trade $jasmy $bat $ren $algo $trb $alice Today's Intraday plan is to scalp some strong coins. I validate this in M15 thats where maximum scalps happen.
Being a purely intraday trader, I love to take profits and move on.
Rule of the game is dont play against market
Book Profit and assess market next day
Come join me

Dotcom Bubble 2.0 & Dollar Collapse by 2025Buying Algorand and Bitcoin at any price this year represents the opportunity of a lifetime. Imagine buying internet stocks in 1998 and 1999

ALGO/USDT Main trendThe main trend in which the uptrend channel was formed. Long-term work from the trend channel. Position trading. The idea is more for understanding where the price is in the primary trend. A cup has formed in the secondary trend in the channel, the price is at its resistance.
Cryptocurrency of 2 groups. XRP group. Al/gor/and.
Coinmarketcap: Algorand.
ALGO/USDT Secondary trend.

ALGO/USDT Secondary trendSecondary trend. It formed a cup, the price at its resistance.
Cryptocurrency of 2 groups. XRP group. Al/gor/and.
Coinmarketcap: Algorand.
ALGO/USDT Main trend

Algorand shortAlgorand bounced off the resistance level. Asset bounced off the descending trendline. Bearish movement to support level at 0.284 is possible.

Algorand (ALGO) - June 30hello?
Welcome, traders.
If you "follow", you can always get new information quickly.
Please also click "Like".
Have a good day.
-------------------------------------
(ALGOUSDT 1W Chart)
Below 0.5021 is likely to be a mid- to long-term investment area.
(1D chart)
Below 0.3310, it is likely to enter the long-term investment realm.
So, the key is whether it can move higher than 0.3091-0.3310.
Rather than rising immediately, it is likely to rise after it leads to a further decline.
As I said in the explanation of the BTC chart, I think that it is more likely to rise faster if it moves sideways while showing a large fluctuation.
------------------------------------------------------------ -----------------------------------------------------
** All indicators are lagging indicators.
Therefore, it is important to be aware that the indicator will move accordingly as price and volume move.
However, for convenience, we are talking in reverse for the interpretation of the indicator.
** The MRHAB-T indicator used in the chart is an indicator of our channel that has not been released yet.
** The OBV indicator was re-created by applying a formula to the DepthHouse Trading indicator, an indicator disclosed by oh92. (Thanks for this.)
** Support or resistance is based on the closing price of the 1D chart.
** All descriptions are for reference only and do not guarantee a profit or loss in investment.
(Short-term Stop Loss can be said to be a point where profit and loss can be preserved or additional entry can be made through split trading. It is a short-term investment perspective.)
---------------------------------

AlgousdMove up or wait?
What are the benefits of Day Trading?
1. You can get trades in different market conditions. The market can be bullish , bearish , or in a range - as a day trader you can trade in all these conditions. For the crypto market, it is an obvious advantage when the market becomes bearish and you can’t trade profitably as a swing or a long-term trader.
2. You trade within the borders of a single day and it means you control all your trades. You close your trades and sleep well, without thinking how the market will move during the night. The same goes for situations when you are not at your laptop but you have active trades.
3. A lot of trade opportunities which markets give you every day. You can pick the most interesting and strong which perfectly match your trading style.
4. More trades mean better income you can get from the market. If we compare day trading with swing and long-term trading, we will see that day trading is a much more profitable approach. It is possible to make 1-5% per day as a day trader when a swing trader will dream about 10-20% per month. As for investors, they focus on 20-30% annual income.
5. More trades give you more experience and knowledge. It means you improve your trading much faster using new experience and knowledge. Day trading can highlight the strong and weak sides of your personality as a trader. You have an opportunity to improve yourself and it will need less time than if you were a swing/long-term trader.
6. More income from day trading means less capital you need to start from. You can

AlGORAND #ALGO idea 28 June 2022AlGORAND #ALGO idea 28 June 2022 - Algo could possibly dip down to the $0.17 price range before regaining strength

ALGO HEADING BACK ABOVE THE SUPPORTWaiting to see a possible breakout on both support and trend line with the bull trend to look further continuation to the upside as shown on the chart targeting 0.42, the next resistance area.

KAVAUSDTPERPAfter the growth of the price from its daily floor, it was able to settle in a side channel. Due to the approaching price of gold, this first issue, if it leaves this site channel from any side, can enter a buy or sell position. It was in this currency

ALGO open the parachute!🔥🔥Subscribe to the channel, get notifications about signals!🔥
#ALGO
▪️There was an increase of 13%, now the indicators are overbought, which indicates a possible correction.
💎In the near future we will correct down by about $0.3
ALGOI think the next downtrend has begun
This is my personal opinion. Please do not trade based on my analysis and data.

ALGO 1H BUYAlgorand is also in a strong uptrend against BTC. It recently dropped and hit the Blue trendline, where my BUY order was placed, as per the strategy. Here is the trade I'm taking.

Algorand (ALGO) - June 16hello?
Traders, welcome.
If you "follow", you can always get new information quickly.
Please also click "Like".
Have a good day.
-------------------------------------
(ALGOUSDT 1W Chart)
The 0.5021-0.6132 section or less is likely to be a mid- to long-term investment area.
Therefore, the key is whether it can move higher than the 0.5021-0.6132 section.
(1D chart)
An important volume profile section is formed around 0.3091.
Therefore, if it falls below 0.3091, there is a possibility of entering the long-term investment area, so careful trading is required.
Looking at the overall picture, the volume proifle section is formed over the section 0.3091-0.6132.
Therefore, it needs to move above 0.6132 to continue the uptrend.
Once you see support at 0.3310, you can make an aggressive buy with a small amount.
This aggressive buy can be used as a way to increase the number of coins for profit by making short-term trades.
A full-fledged buy is possible when we see support in the 0.5021-0.6132 section and rise above 0.6132.
------------------------------------------------------------ -----------------------------------------------------
** All indicators are lagging indicators.
Therefore, it is important to be aware that the indicator will move accordingly as price and volume move.
However, for convenience, we are talking in reverse for the interpretation of the indicator.
** The MRHAB-T indicator used in the chart is an indicator of our channel that has not been released yet.
** The OBV indicator was re-created by applying a formula to the DepthHouse Trading indicator, an indicator disclosed by oh92. (Thanks for this.)
** Support or resistance is based on the closing price of the 1D chart.
** All descriptions are for reference only and do not guarantee a profit or loss in investment.
(Short-term Stop Loss can be said to be a point where profit and loss can be preserved or additional entry can be made through split trading. It is a short-term investment perspective.)
---------------------------------

ALGO/USDT - Potential Short ScenarioHello Traders!
ALGO price continues to move within the descending trend completing the previous market cycle.
The culmination of the falling phase will be an aggressive downward exit of the price under the support level of $0.25
Medium-term purchases can be considered at $0.1440 - $0.1900.
The targets of such purchases will be price levels of $0.25 and $0.36
Good luck and watch out for the market
P.S. This is an educational analysis that shall not be considered financial advice

ALGONot financial advice.
The essence of investing & trading is the intelligent and patient preying on the greed, fear, impatience, addiction and ignorance of the majority. It's definitionally Darwinian.

Algo.Algo saw a clean 5 wave impulse which had begun back in march of 2020.
The impulse was completed in November of 2021.
Since that top, Algo has put in what looks to be a zig-zag (labeled a-b-c).
-it has retraced roughly 61.80% of the entire bull run.
-quadruple bullish divergence on the daily time-frame is present (very rare).
-indicative that this dip could potentially be a wave (2).
if i'm right about all of these alts being in a 1-2,
then we are in for a ride into the skies.
---
things definitely don't look too good in the world right now,
the economic crisis which is happening right now would be the single biggest argument against what i'm portraying here.
the only way this scenario could play out, is if something drastic changed in the world in the near future.
---
i will continue to entertain the idea that these could indeed be 1-2's, but i'm also going to approach this very conservatively and with extreme care \ caution; making sure to use proper risk management if i ever was to play any of these.
nothing in this market is certain, in fact, it's all extremely uncertain right now; and there is an infinite amount of possibilities which could potentially be at play.
this is merely the bull case, nothing more.
there is also a very probable bear case, so you gotta be very careful.
don't be attached to either side, just let the market show you what it wants to do, then simply go with the flow.
---
Best of luck!

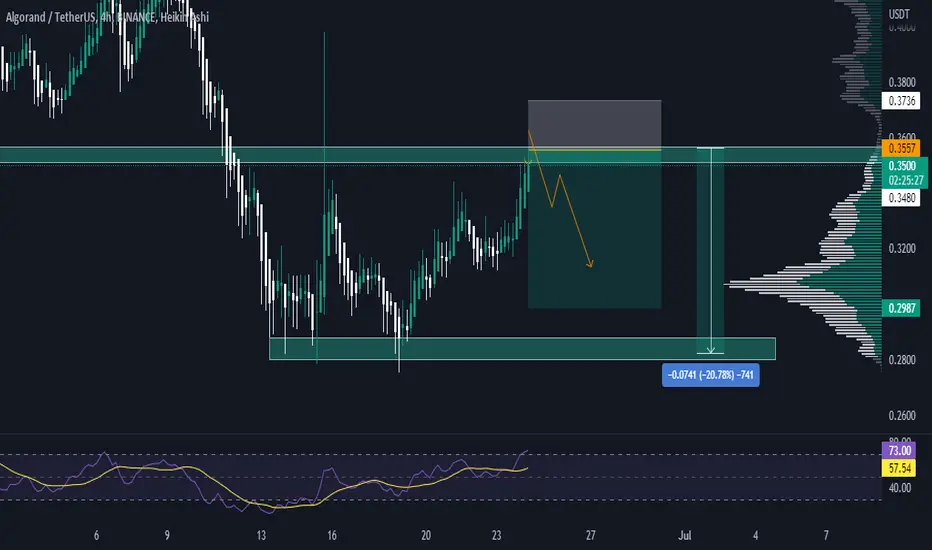
Algorand ALGO short Entry Range, Take Profit and Stop Losspreviews Algorand short
ALGO/USDT short
Entry Range: $0.35 - 0.38
Take Profit 1: $0.30
Take Profit 2: $0.25
Take Profit 3: $0.19
Stop Loss: $0.44

SHORT ALGO- Back to 25 CENTS price action on algo along with the rest of the market has solid signs of bearish consolidation
a retest of 25 cents lines up with the pervious historical support back in the 2020 bullish impulse

ALGO/USDT 80% Potential Upward if Break This Resistance#ALGOUSDT Technical Analysis:-
#ALGO Trading at SuperTrend Resistance $0.42
If Price Break This Resistance Then We Can see 30% to 80% Upward Move from here.
Resistance:- $0.5/$0.62/$0.75
Stop Loss: $0.367
