Algorand (ALGO) path back out?Accountability? Agh. I know that I should remain neutral on this one for ALGO, just to keep a decent batting average 'round these parts ⚾️ for ol' Algorand.
Nevertheless, i am STILL bullish on ALGO.
This coin is going to have a gigantic breakout in the next several days/week. It's unfortunate that Algorand is still dictated in large part by big b (BTC) calling the shots with market fluctuation.
Things are getting better though. Coins and tokens are developing their own internal economy and ecosystems, with these becoming more and more impervious to BTC's ridiculously orchestrated fluctuations. The more people come on board and begin buying these coins, and creating traffic on the networks... the more these coins ( annnnd tokens, for all you defi peeps out there) --the more they all begin to break away from the grasp of BTC's and ETH's market fluctuations. --my love, Monero (XMR) being a prime example of this, especially at the present.
♠️🤫🐿
ALGOUSDT

Algorand (ALGO) we could see a rise...I'm still feeling bullish on Algorand.
Have always felt that it is a vastly underrated coin. The ALGO blockchain is one of, if not the most resilient, secure blockchain in the crypto-verse.
It has never been breached, and it the transaction times are faster and cheaper than any other currency I've come across with the exception of maybe some very obscure swappable tokens that I'd rather not mention here.
C'mon ALGO!
♠️🤫🐿

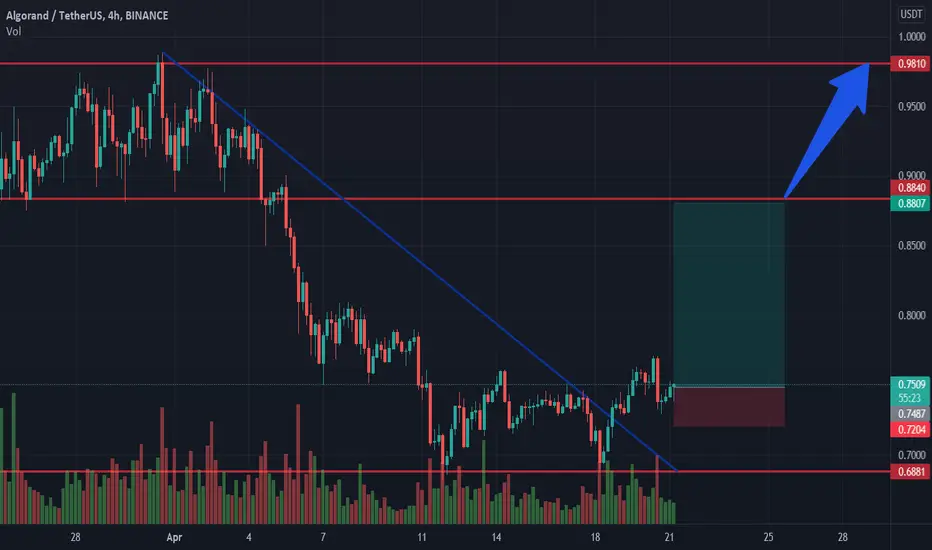
Algorand longAlgorand bounced off the support level. Asset broke through the descending trendline. Bullish movement to resistance level at 0.88 is expected to happen. If the next resistance level will be broken up the Algorand is supposed to reach 0.98.
Algo is supremely BULLISHALGO is ready to start, do not miss this extremely bullish move. Get ready for 300% returns.

ALGO... seeing some love? I'm just throwing this out there because ALGO is a very underrated, and undervalued currency.
<₮0.75 is a good stop in general, and I feel as though 0.75 could finally provide some decent support.
ALGO still offers the least expensive, most-secure option of sending crypto from one place to another.
The ALGO blockchain has never crashed. Ever. I don't think any other chains can say the same thing.
🤷♂️ bullish IMO
♠️🤫🐿

AlgoUsd moonshootAlgoUSDT now is situated into a huge falling wedge which is a bullish pattern.
We need a nice weekly close here to make a beautiful double bottom with a strong bullish divergence between the price and RSI/Stoch indicators
Some weekly targets are :O.7956 $
0.842 $
1.13 $ -Target from wedge
Also the volume is still decreasing which means a huge reversal and volume boost will come
Be prepared for a shot

ALGOUSDT SETUPALGOUSDT:
Price is trying to regain some momentum after going through an accumulation phase. If bulls react and behave aggressively we can expect a good short-term recovery to upside resistance levels.

Algousdt——buyThe lowest risk price for buying paint. It is blue, red is the loss limit, green is the profit limit

ALGO can reach 0.80$ALGO is in a Bearish Trend. The Price Is Forming a Pattern which Can be Considered a Descending Triangle as well. The Major Support level is around 0.69$ If ALGO makes a Bullish Pullback From there There is a High chance To Break the Bearish Trend line and Make it's Way To 0.80$.By the way the Price is about to Break the Bearish Trend line Right now So This would Means The Chance of reach 0.80 From here is High!
_ _ _ _ _ _ _ _ _ _ _ _ _ _ _ _ _ _ _ _ _ _ _ _ _ _ _ _ _ _ _ _ _
Thank you for seeing idea .
Have a nice day and Good luck

ALGO Algo is really good for long term
break red line means the correction is completed and ready to hit the targets above

Algorand FIB levels + Targets shorttermI see a bright future for
Algorand being one of the ISO20022 agenda.
- NO FA
- Always do your own research
- Share,like and suscribe

ALGOUSDT If BTC have mini bullrun ! AlgoUSDT just done wave 1, 2
Next is wave3,4
2 Target
1. 1.5USD
2. 1.7USD

the expectation for a breakout is higher than you think!!hello everyone
ALGOUSDT may have a breakout to the upper channel in 4 hours timeframe; I Hate to repeat myself over and over in every analysis,but volume,trend lines and bitcoins leaving the brokers,show a possible breakout and an uptrend(possibility of breakouts are 40% and possibility of reversals are 20%).
If we breakout of this level of resistance,our next level will be on 0.78$ which is a weak one for now.

ALGO daily is looking to make the move up anytime.ALGO daily chart
This chart is still intact and once it gets the
push above the descending trendline, This
chart could really show whos boss...The ALGO
blockchain has been rated top 3 best blockchains
in this industry as well. Lets see what it can do here
in the next 1-7 weeks. RSI and chart is reading
a Bullish Divergence.


ALGO: the falling wedge BREAKOUT! Short review!Algorand (ALGO) is in a big falling wedge. This pattern is more likely to break UP, so we will consider a bullish scenario.
The squeeze under the trend line will be the main trigger for opening long positions. On the lower timeframes a breakout of the local trend line is also an additional bullish signal. Consolidation before a breakdown is necessary, as a major player needs to accumulate ALGO.
Targets:
1. $1,33-1,42
2. $1,73-1,88
Friends, press the "like" button, write comments and share with your friends - it will be the best THANK YOU.
P.S. Personally, I open an entry if the price shows it according to my strategy.
Always do your analysis before making a trade.

ALGO forms double bottom at 1 year support.ALGO has bounced off of a strong support level around the $.67 mark and has formed a double bottom at this strong support level after descending since September from the $2.4 high. Further downside may be limited to this strong support area and the price looks poised for an upswing after forming the double bottom.
BINANCE:ALGOUSDT


ALGO Long term analysis ELLIOT WAVES this is a LONG term analysis.
I believe whatever 5 waves up we had is a LEADING DIAGONAL wave 1 of a bigger impulsive wave.
Looking for that wave 2 tripple three correction.
I believe ALGO is a must buy around the box area as It will be a money maker in the next 2 years.

Algorand (ALGO) count me in!Algorand is a token that I have not covered on this platform too much. It's a shame because ALGO is one of my favorites. In terms of the accessibility, speed, and efficiency- ALGO blockchain is top notch. I mean, heck- if you ever want to send cryptocurrencies anywhere for the cheapest possible price... what do you use? -- ALGO
The volume and number of wallets opened/holding ALGO has also steadily increased over the last several months with no real fall off...
♠️🤫🐿

ALGO could make the move up after this trendline break.ALGO daily chart
This chart is still intact and once it gets the
push above the descending trendline, This
chart could really show whos boss...The ALGO
blockchain has been rated top 3 best blockchains
in this industry as well. Lets see what it can do here
in the next 1-8 weeks. RSI is literally Oversold
and on Deck to move up now.

ALGO breaking out on 4hr timeframe?It seems like ALGO has retested the previous supply zone and currently trying to flip it as a support.
Buying ALGO here can be a good move, if it holds here R:R is good.

ALGOUSDT Analysis (LOCAL VISION)Hello friends.
Please support my work by clicking the LIKE button👍(If you liked). Also i will appreciate for ur activity. Thank you!
Everything on the chart.
Entry: market and lower
Target: 1 - 1.15 - ~1.3
after first target reached move ur stop to breakeven
Stop: 0.66 (depending of ur risk). ALWAYS follow ur RM .
Risk/Reward: 1 to 4.5
risk is justified
Good luck everyone!
Follow me on TRADINGView, if you don't want to miss my next analysis or signals.
It's not financial advice.
Dont Forget, always make your own research before to trade my ideas!
Open to any questions and suggestions.
