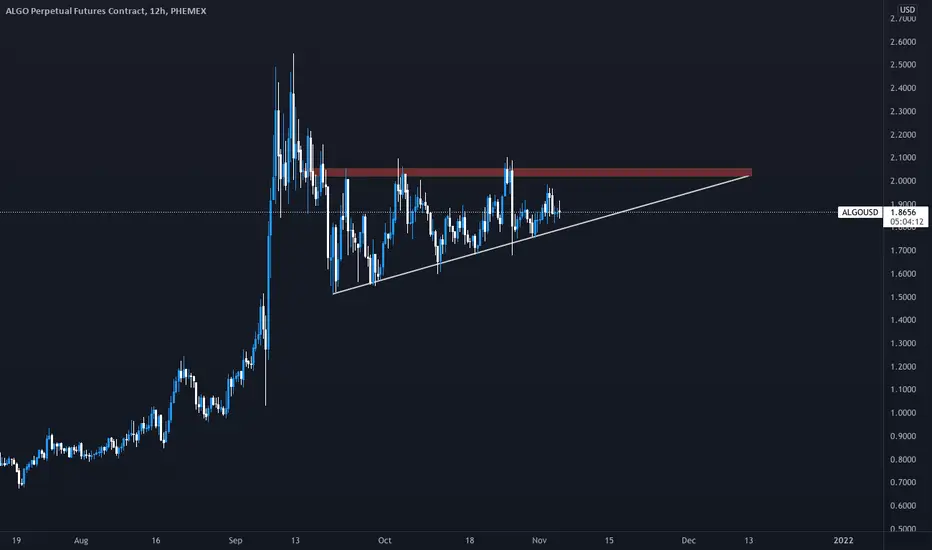
ALGO Moving in Symmertical TriangleSo here We're , Algo after the big move moving into the summertical triangle and now on the Good Support , So Just Wait to Volume and after Breakout the triangle , you can buy it , Please Share your Idea about this chart
NOT FINANCIAL ADVICE
HAVE A GOOD TIME Fellas
ALGOUSDT

AlgoUsdt Bullish Ascending TriangleAlgo goes up inside the Ascending Triangle in a daily timeframe.
Current:1.84
Target: 2.05
SL: 1.68
R/R: 1.3

ALGOUSDTsee and watch :)
The trendline has been broken and it seems that the price can increase up to the specified limits ...
ALGO/USDT (daily chart)The algorand coin (ALGO) is facing a major resistance at 2.04$ closing the daily candle under this resistance will give us a chance
for a good entry at 1.89$ and 1.85$. confirming the breakout by closing a daily candle above the resistance at 2.04$ will move
the coin toward the targets shown in the chart.

ALGO TA NOV 4Algo is still showing bullish signs from crossing EMA's to building momentum. ALGO could potentially reach 2.0lvl to complete the bat pattern (green). Pls be noted also that the 2.09lvl is its resistance from prev high.

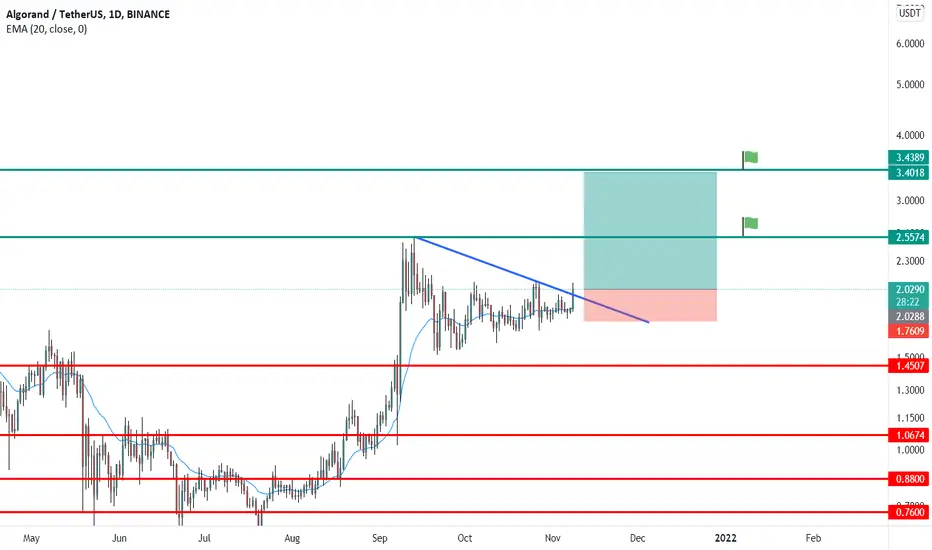
ALGO - Daily TFOn a daily TF, ALGO is oscillating in a triangle and it is at the price floor. If it breaks the $2.08 support, you can enter for $2.5, $2.8, and $3.1.

ALGO doing the move ?
ALGO seem to be breaking out of his triangle but i would stay cautious as long as we don't have a daily above 2.05$.
If it does close above then the plan would be to buy any retest of 1.95$ and target 2.5$ as 1st TP which would be what i would play since MACD daily is turning bullish.
If it close under then we would need to rethink the upper trendline of the pattern perhaps and exclude the price action of 10 to 12th september which is missleading.
Ideally we want a daily close at 2.1$ so both trendline would become potential support combine with the current resistance area 1.95$/2.05$
Let's see how this will play out

Climbing to new highs - ALGOAlgo is climbing up the ascending triangle. Red box resistance break will signal an imminent move to ATH.
DYOR and GL!
ALGO BREAKING OUT OF FLAG!VERY solid fundamentals on this one, long term price has been flowing in impulse moves upwards with consolidation flags in between. Price is currently in a squeezed flag and is testing our breakout area
- need to see a 8h - 1 day break out of flag and resistance area
- will want to have a Bollinger band beak
- first take profit @ 1.618 fib extension level
- stop loss placed below area of volatility in current consolidation area

ALGO/USDTEverything is clear in the picture. Ask your questions in the comments section. Please like, good luck♥️

ALGO/USDT on an ascending triangle.ALGO/USDT on an ascending triangle pattern. B/O above the flat top with the right volumes may push the price to previous high 2.4-2.5 levels.
#NOT A BSH recommendation.

ALGO / USDT - Big triangle pattern. on the verge a breakout?Here is my take on ALGO / USDT 4H. We are witnessing a triangle formation with a potential breakout. If the ranging motion continues then we can consider the pattern as invalidated.
If the triangle breaks the upper line of the triangle - I recommend that you wait for a solid confirmation - then enter a long position.
Take profit ideas:
TG1 - 2.08$
TG2 - 2.18$
TG3 - 2.26$
TG4 - 2.44$
I keep it simple and clean!
Likes, comments, and follows are dearly appreciated.
Let me know what you think and which ones you would like for me to analyze next.
Trade safely!


ALGO LONG (update)Chart shows the play.
Entered in the white rectangle when the daily candle closed above the solid yellow bull flag.
1.5-1.7 Entry
2.2 TP
2.4 TP
Best of luck

#Algo tries to break out it's stong resistancethere is 2 possible scenarios : Success break out the triangle and pump to target levels or breaks down the support at 1.7
and retest 1.6 and 1.25
My idea is uptrend scenario and waiting for good entry point after success break out

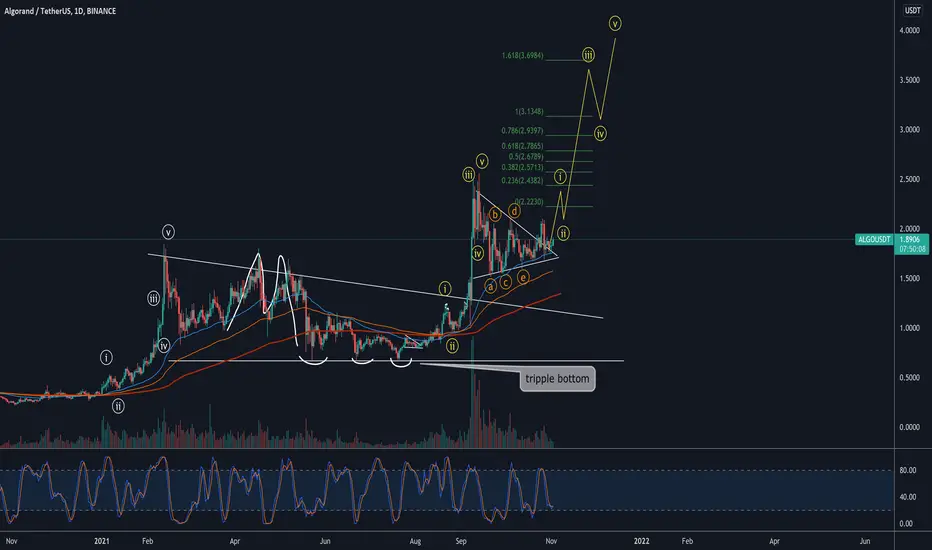
Targetting 3USD- consolidated for 1,5month
- slowly upward sloping price
- flipping 2USD zone as support will open the upward potential
- 1.236 extension of summer run-up
- btc pair rolls/rolled over

ALGOBTC Massive Broadening Wedge BottomUpdated. Publishing for myself to see if that broadening wedge bottom textbook plays out or not. ALGOBTC is in descending channel (red) and in broadening wedge bottom (yellow) both.

LongHello guys, we are moving in a triangle pattern. The best time to buy is when leaving the pattern.
#signal
#ALGO
#ALGOUSDT
Spot( Midterm)🌟
Enter : 1.9$
Target : 2$
Target : 2.09$
Target : 2.3$
Target : 2.4$
Target : 2.9$
Stop loss :1.74$
Daily Close In : 1.74$

Algo analysisTry to pick Algo at bottom box also on buying zone .
Algo will outperform soon and expected min 30% profit soon

ALGO ---> C&H pattern - DIRECTION 7$Hello everyone !
Today the Black Cat Trader is analyzing ALGO based on a weekly chart.
What we can see :
Pitchfork : Prices are stuck under the intermediary lower line of the pitchfork
Pattern : Prices are building what seems to be a beautiful Cup and Handle pattern.
What we can expect :
- If ALGO manages to break the median line of the pitchfork, we can expect prices to reach the intermediary upper line of the pitchfork first. A pull back on the neckline of the C&H would be perfect to send ALGO to the last upper line of the pitchfork.
- Note that the trend based fib extension gave us targets who match with our C&H and pitchfork final objectives.
Major resistance 1 : Median line of the pitchfork
Major resistance 2 : ATH
——
Major support 1 : Lower line of the pitchfork
Major support 2 : Long term uptrend (Green)
——
TP1 : 3,49$ (1.618)
TP2 : 5,23$ (2.618)
TP3 : 6,98$ (3.618)
TP4 : 8,72$ (4.618)
IF YOU LIKE THIS POST, FEEL FREE TO LEAVE A LIKE AND FOLLOW THE BLACK CAT TRADER
MAY THE CRYPTO BE WITH YOU GUYS (D.Y.O.R)

ALGO ready for next leg upALGO is consolidating in the bull flag and is ready to move. Watch for the breakout and hold on to it for big move to our target.

ALGO/USDT Cup and Handle 1H; 11/2/2021Algorand is making a cup and handle pattern, the green horizontal line is the stop loss.
TP 1: $1.9671
TP 2: $1.9993
TP 3: $2.0316
This is not financial advice, happy trading.
