ALGO - Trade opportunity after the breakoutBINANCE:ALGOUSDT (1D CHART) Technical Analysis Update
ALGO is currently trading at $0.2276 and currently in consolidation phase. Price has formed a nice triangle pattern. If the price breaks out from the resistance line then we have a good opportunity for long trade. If the price breaks down then the next support is around 0.15
Entry level: $ 0.24
Stop Loss Level: $ 0.21
TakeProfit 1: $ 0.256
TakeProfit 2: $ 0.268
TakeProfit 3: $ 0.2931
TakeProfit 4: $ 0.3190
Max Leverage: 5x
Position Size: 1% of capital
Don't forget to keep stop loss.
Follow Our TradingView Account for More Technical Analysis Updates, | Like, Share and Comment Your thoughts.
Cheers
GreenCrypto
ALGOUSDT

Another perspective of the ALGO Cup & Handle pattern.The Cup & Handle pattern in ALGO has broken out, and perfectly retested the rim-line. We could see some incredible price gains in the coming months.
Good luck, and always use a stop-loss!

ALGO/USDT bullish reversal from support ? 👀🚀ALGO analysis💎 Paradisers, let’s delve into the intriguing movement of #ALGOUSDT. Currently, it’s retracing and meticulously retesting a critical support level at $0.2162. This level holds immense importance, and its ability to transition from a retest to a firm support could be a bullish signal.
💎 After successfully breaking out of a descending channel, the price of #ALGO is now confidently approaching the key support level at $0.2162. If the price sustains its momentum at this level, we can anticipate a bullish reversal. With sustained upward momentum, the target lies above the formidable resistance at $0.3277.
💎 However, should the price of EURONEXT:ALGO dip below this pivotal zone, it’s crucial to adapt our strategy. We foresee a bullish rebound from the secondary support level at $0.1939. Failing to regain ground here could potentially lead to further declines. Stay vigilant and agile as we navigate these market fluctuations!
MyCryptoParadise
iFeel the success🌴

ALGOUSDT-4H candle-Dow TheoryALGOUSDT Implementing Dow Theory 4 hours candle analysis
#dowtheory #algousdt #cryptoanalysis

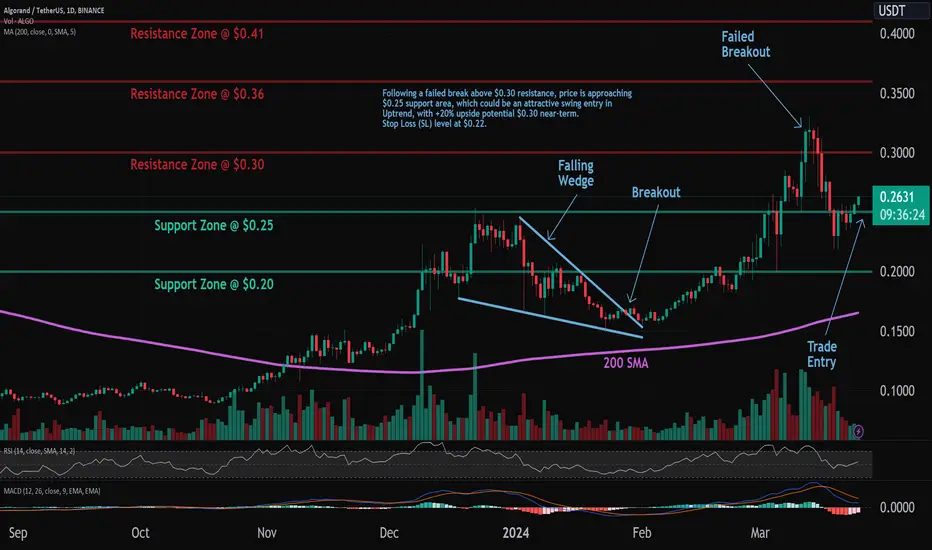
ALGO: Pullback in UptrendTrade setup : Price remains in an Uptrend. We would be buyers on pullbacks near $0.25 support area, which is also near its up trendline, and could be an attractive swing entry in Uptrend, with +20% upside potential $0.30 near-term. Stop Loss (SL) level at $0.215.
Trend : Downtrend on Short-Term basis and Uptrend on Medium- and Long-Term basis.
Momentum is Bearish (MACD Line is below MACD Signal Line, and RSI is below 45).
Support and Resistance : Nearest Support Zone is $0.25, which it broke, then $0.20. The nearest Resistance Zone is $0.30, then $0.36 and $0.41.

ALGOUSDTALGOUSDT is in strong bullish trend.
As the market is consistently printing new HHs and HLs.
currently the market is retracing a bit after last HH, which is 50% Fib retracement level and local support as well. if the market successfully sustain this buying confluence the next leg up could go for new HH.
What you guys think of this idea?

ALGO: Pullback in UptrendTrade setup : Price remains in an Uptrend. We would be buyers on pullbacks near $0.25 support area, which is also near its up trendline, and could be an attractive swing entry in Uptrend, with +20% upside potential $0.30 near-term. Stop Loss (SL) level at $0.22.
Trend : Uptrend across all time horizons (Short- Medium- and Long-Term).
Momentum is Mixed as MACD Line is below MACD Signal Line (Bearish) but RSI ~ 50 (Neutral).
Support and Resistance : Nearest Support Zone is $0.25, then $0.20. The nearest Resistance Zone is $0.30, then $0.36 and $0.41.

ALGO's wave 5 could gain some significant ground here soon!ALGO has been doing very well the past month or so, and is looking to do even better here shortly. The current wave 5 is generally the most explosive, and largest gaining. Although, the price action looks like it could potentially drop closer to the lower trend line (white line). This line has held very well so far since this uptrend started, and the wave pattern will continue to stand as long as the price action doesn't drop below the wave one high. If the wave 5 plays out properly we could easily see ALGO run into the mid .40's.
Good luck, and always use a stop-loss!

ALGOUSDT: Falling Wedge - Getting Ready for breakoutFalling wedge is bullish pattern (reversal pattern) formed by two converging bearish lines.
As you can see in the chart, BINANCE:ALGOUSDT has formed a clear falling wedge patter.
If the breakout is confirmed, we can enter the trade around 0.173
After the breakout we can expect a minor correct, however breakout entry should be good and position can be average to get better entry price if the correction happens.
EntryPrice: 0.1734 (after breakout) - 0.165 (for averaging the entry)
Stoploss: 0.1490
TP1: 0.1894
TP2: 0.2040
TP3: 0.2253
TP4: 0.2531
Don't forget to keep stoploss.
Like and follow us for more interesting ideas.
Cheers
GreenCrypto

ALGO: Pullback in UptrendTrade setup : Price remains in an Uptrend. Following a failed break above $0.30 resistance, price is approaching $0.25 support area, which could be an attractive swing entry in Uptrend, with +20% upside potential $0.30 near-term. Stop Loss (SL) level at $0.22.
Trend : Uptrend across all time horizons (Short- Medium- and Long-Term).
Momentum is Mixed as MACD Line is below MACD Signal Line (Bearish) but RSI ~ 50 (Neutral). MACD Histogram bars are rising, which suggests that momentum could be nearing another upswing.
Support and Resistance : Nearest Support Zone is $0.25, then $0.20. The nearest Resistance Zone is $0.30, then $0.36 and $0.41.
Chance of growth up to 30%This currency is in an upward trend and there is a good opportunity for the growth of this currency, according to the chart and analysis, you can enter with capital management.

Above 300%Hello
ALGOUSDT will increase by approximately 300%, making it possible to achieve higher targets.
I deleted my indicators.
Spot trade please.

Algorand on a Classic Mooove 🚀Hey Traderz,
The Chart says the story. Classic Rounding Bottom Pattern with a nice pullback.
Hoping for a 100% gain. Let's hope for some positive news coming on the corner and the price raise quicker.
Don't let greed catch you. Book the profits and Exit the markets.
Entry - Around 0.2427 - 0.2600
Stoploss - 0.2000
- Everything depends on How BTC performs. But let's keeeeep hope.
Happy Trading !!!!

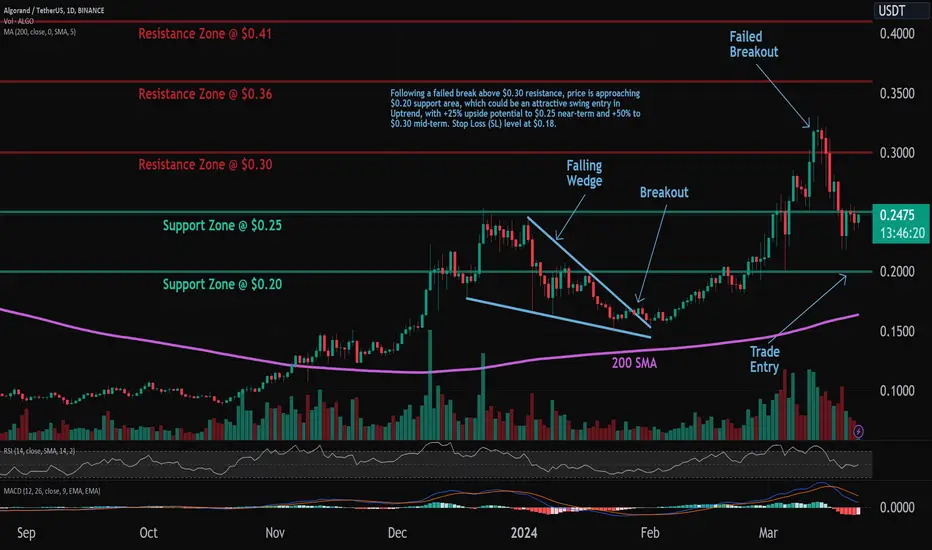
ALGO: Pullback in UptrendTrade setup : Price remains in an Uptrend. Following a failed break above $0.30 resistance, price is approaching $0.20 support area, which could be an attractive swing entry in Uptrend, with +25% upside potential to $0.25 near-term and +50% to $0.30 mid-term. Stop Loss (SL) level at $0.18.
Trend : Neutral on Short-Term basis and Uptrend on Medium- and Long-Term basis.
Momentum is Mixed as MACD Line is below MACD Signal Line (Bearish) but RSI ~ 50 (Neutral).
Support and Resistance : Nearest Support Zone is $0.25, which it broke, then $0.20. The nearest Resistance Zone is $0.30, then $0.36 and $0.41.
ALGO is set up for an EXPLOSIVE move to the upside!ALGO is set up for what I think is going to be an EXPLOSIVE move to the upside. After the cup & handle breakout I predicted came to pass, and a nice retest of the rim-line, which just occurred, I think we are about to experience an EXPLOSIVE Wave 5 to the upside.
Buckle up!
Good luck, and always use a stop-loss!

Algorand uptrend local targetsBINANCE:ALGOUSDT
Lets take a look on D timeframe for Algo
Possible Targets and explanation idea
➡️Local fib we perfectly touched -0.18 lvl and would be good to test green block again
➡️Like usual we got many variations of price movements but I marked 2
➡️Both of this price movement for continuation Up.
➡️Green - retest 27 block and continuation in spring
➡️Red - retest buy line "take profit" indicator on D and Up
Hope you enjoyed the content I created, You can support with your likes and comments this idea so more people can watch!
✅Disclaimer: Please be aware of the risks involved in trading. This idea was made for educational purposes only not for financial Investment Purposes.
---
• Look at my ideas about interesting altcoins in the related section down below ↓
• For more ideas please hit "Like" and "Follow"!

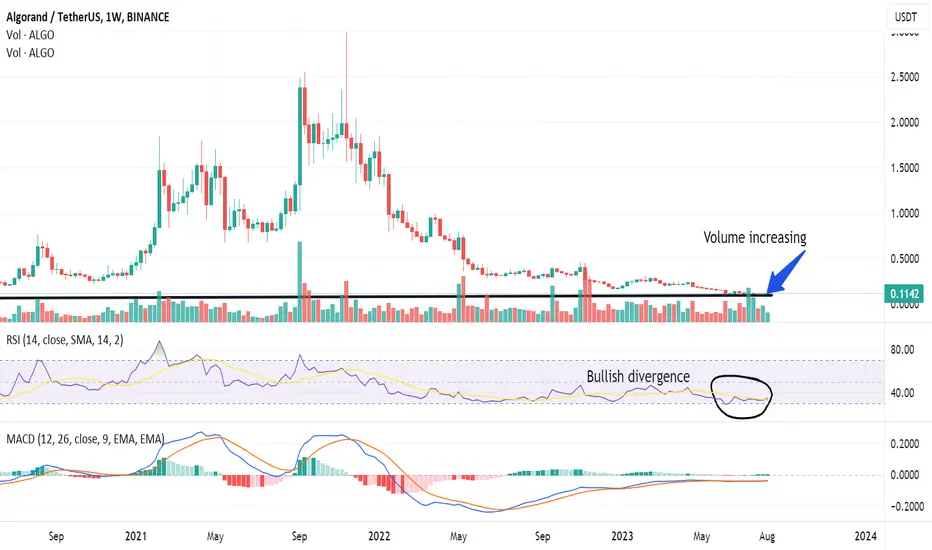
Bullish uptrend COMING SOON Algousdt, AlgorandDear friends, Algorand has been in a downtrend for MANY MONTHS, it reached major support area of 0,09 cent. (ATTENTION, it still can FALL lower). Now Algorand seems to be establishing a BOTTOM.
Bullish signs: Bullish divergence, volume increasing, major support zone, oversold territory.
2 things can happen now: Algorand slowly increases. Or Algorand makes new low under 0,09 to take stop-losses and liqiudity and then starts an uptrend.
BINANCE:ALGOUSDT COINBASE:ALGOUSD KUCOIN:ALGOUSDT
ALGO ANALYSIS🚀#ALGO Analysis : Pattern Formation
🔮As we can see in the chart of #ALGO that there is a formation Inverse Head And Shoulder Pattern and it's a bullish pattern. Also there is a perfect breakout and retest of the levels. This indicates a potential bullish move.📈📈
🔰Current Price: $0.2353
🎯 Target Price: $0.3871
⚡️What to do ?
👀Keep an eye on #ALGO price action. We can trade according to the chart and make some profits⚡️⚡️
#ALGO #Cryptocurrency #TechnicalAnalysis #DYOR

ALGO/USDT Local trend. Wedge breakout zone. 5 11 2023Logarithm. Time frame 1 day
Main trend. Accumulation/distribution zones. Time frame 1 week.
ALGO/USDT Main trend. Cycles. 07 2023
Secondary trend. All price drops from 2-year highs.
ALGO/USDT Secondary trend. Wedge - trend.
This local wedge breakout zone on the line chart.

Algorand: $0 is next? Algorand, another dead project.The chart speaks volumes. There is 0 demand for this coin. I believe this coin will soon enter its bearish phase and head towards zero.

ALGO: Pullback in UptrendTrade setup : Following a bullish breakout from a Falling Wedge pattern, price resumed its Uptrend. It briefly broke above $0.30 resistance but failed stay above it as traders took profits. Pullback near $0.25 support area could be an attractive swing entry in Uptrend, with +20% upside potential to $0.30 near-term and +40% to $0.36 mid-term. Stop Loss (SL) level at $0.225.
Trend : Uptrend across all time horizons (Short- Medium- and Long-Term).
Momentum is Mixed as MACD Line is below MACD Signal Line (Bearish) but RSI ~ 50 (Neutral).
Support and Resistance : Nearest Support Zone is $0.25 (previous resistance), then $0.20. The nearest Resistance Zone is $0.30, then $0.36 and $0.41.

ALGORAND To $3+ Before EOYAccording to my autistic calculations Algorand will trade above $3 somewhere between june and october this year.
I don't make the rules...
NFA

🚧ALGOUSDT is Bullish now🚧 & many Traders don't see it 👀!!!Hi.
COINEX:ALGOUSDT
✅Today, I want to analyze ALGO for you in a Weekly time frame so that we can have a MID-term view of ALGO regarding the technical analysis. (Please ✌️respectfully✌️share if you have a different opinion from me or other analysts).
ALGO has formed an inverse head and shoulders pattern. If price followed this pattern and will soon reach to 0.90 . The expected movement is measured as the price movement (AB=CD).
✅ Due to the Ascending structure of the chart...
- High potential areas are clear in the chart.
Stay awesome my friends.
_ _ _ _ _ _ _ _ _ _ _ _ _ _ _ _ _ _ _ _ _ _ _ _ _ _ _ _ _ _ _ _ _
✅Thank you, and for more ideas, hit ❤️Like❤️ and 🌟Follow🌟!
⚠️Things can change...
The markets are always changing and even with all these signals, the market changes tend to be strong and fast!!
