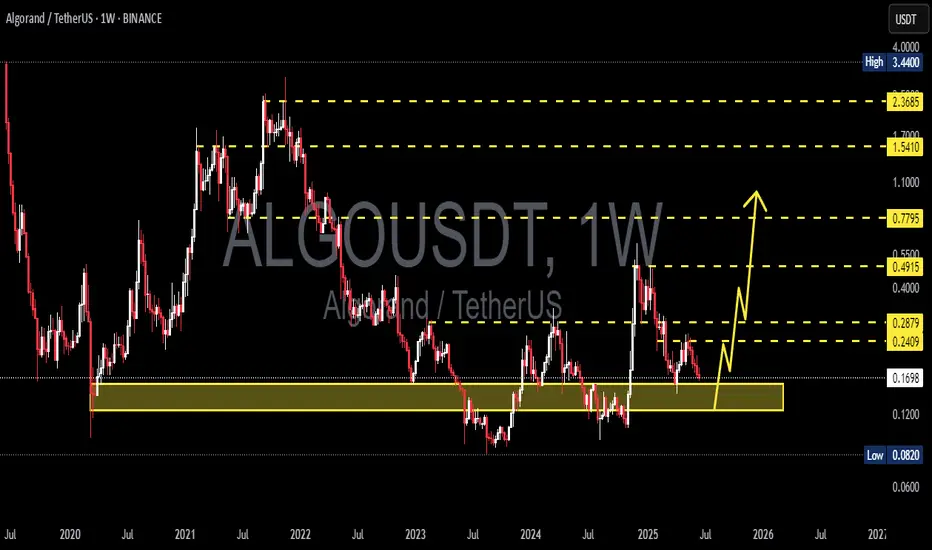
ALGOUSDT Approaching Breakout!BINANCE:ALGOUSDT is showing a potential trend reversal after bouncing from a strong historical demand zone around $0.15. Price action is testing the descending trendline for a breakout, which could trigger a bullish continuation move. Similar to the previous breakout in late 2024, this setup hints at a possible repeat rally. A weekly close above the trendline would confirm strength, opening targets at $0.32 and $0.70+.
COINBASE:ALGOUSD
Algousdtlong

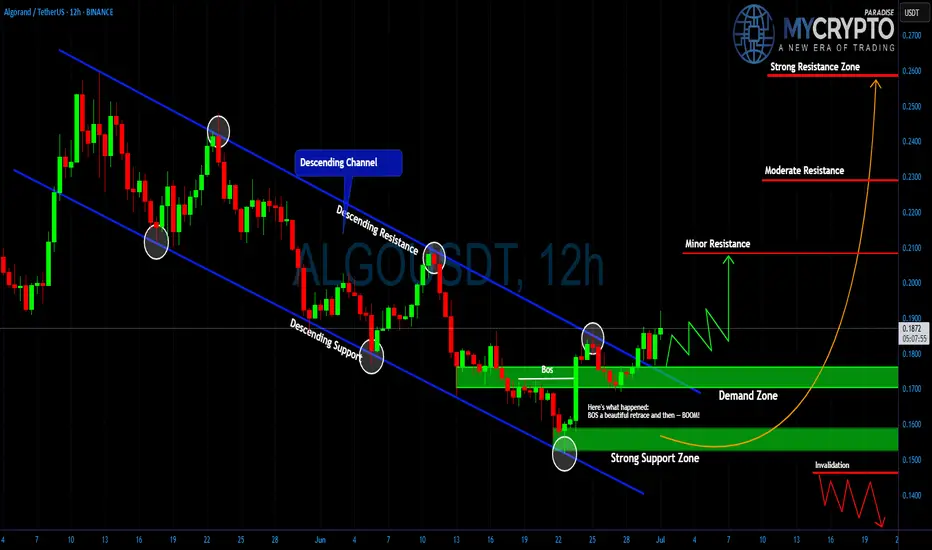
ALGO: Surprise Rally Ahead?Yello Paradisers, did you spot that breakout from the descending channel in time or are you still waiting for confirmation that already happened?
💎#ALGO/USDT has officially broken out of its multi-week descending channel after a textbook Break of Structure (BoS). Price action gave us a beautiful retrace into the demand zone, and from there boom momentum began shifting. This move is now showing early signs of bullish continuation, but as always, the majority will only realize it once the big move is already done.
💎#ALGO had been trading within a clearly defined descending channel, with price reacting precisely between the descending resistance and descending support lines. The breakout occurred after a strong candle pierced the descending resistance, and more importantly, we got a BoS followed by a clean retest of the demand zone around $0.165–$0.175. That reaction was sharp and decisive, indicating strong interest from buyers stepping in.
💎As of now, it is trading near $0.186 and forming higher lows, which supports the idea of an ongoing trend reversal. The structure has changed, and bulls are slowly regaining control. If price sustains above $0.190, the doors open for further upside. The first key level that could slow momentum is minor resistance near $0.210. If that level breaks with volume, moderate resistance around $0.230 becomes the next critical zone. Above that, the major target sits at $0.260, a strong resistance area where a lot of liquidity could be triggered.
💎On the flip side, the strong support zone between $0.145 and $0.155 remains our invalidation area. If price drops below this range, the bullish setup collapses, and we reassess the entire structure. But unless that happens, the bias remains cautiously bullish.
Trade Smart. Stay Patient. Be Consistent.
MyCryptoParadise
iFeel the success🌴
ALGOUSDT 1W AnalysisALGO ~ 1W Analysis
#ALGO Buy back gradually from here with a short-term target of at least 20%++.
ALGOUSDT 1D AnalysisALGO ~ 1D Analysis
#ALGO Buy back gradually from here with a short term target of at least 15%+ from here.

ALGOUSDT making its way for journey towards 0.35$Here is the idea about ALGOUSDT.
The price is currently trading at daily support DS1.
The price was rejected from weekly resistance WR1 before coming back to daily support zone DS1.
I believe this daily support is very likely to provide support and make the price bounce from here.
The likely trajectory of the price is depicted in the chart.
The price is likely to aim for weekly resistance WR1 next on this bounce.
At WR1, the price is likely to face some pullback before ripping this resistance and target the next strong resistance which is quarterly resistance 3MR1.
Lets monitor this one as we go and adjust our expectations. But for now this is what I see as the likely path for ALGOUSDT.
Whats your thought?

How To Spot The Next Big Algorand Crypto Move!In the fast-paced world of crypto trading, many traders gravitate toward intraday and scalping strategies, chasing quick profits while often ignoring the powerful signals presented by higher timeframes. Yet, the smart money — institutional players, whales, and seasoned swing traders — operate differently. They focus on bigger timeframe supply and demand imbalances to enter high-probability trades with calculated risk and substantial reward potential. One such opportunity is currently setting up in Algorand ( BINANCE:ALGOUSDT ).
Why Higher Timeframes Matter in Crypto Trading
Most crypto traders operate on the 1-minute to 15-minute charts. While this can be effective, especially with crypto intraday strategies, it often leads to overtrading and emotional decision-making. In contrast, higher timeframes — such as the daily and weekly charts — provide clearer market structure, show major supply and demand imbalances, and are less noisy.
These timeframes reveal where whales and institutions place large orders, creating impulsive moves that leave behind clues for patient traders. Ignoring these clues is akin to trading blind.
The Weekly Demand Imbalance on BINANCE:ALGOUSDT
BINANCE:ALGOUSDT is currently showcasing a textbook example of a solid and strong weekly demand imbalance around the $0.1380 level. A few months ago, this zone sparked a massive bullish impulse — a series of consecutive large-bodied white candlesticks that broke through resistance with conviction.
Such moves don’t happen randomly. They’re often the result of institutional accumulation — smart money stepping in with size. These large players create imbalances where demand far outweighs supply, causing prices to rally aggressively. The key for retail traders is to identify the origin of these moves and wait patiently for the price to return.

ALGOUSDT 1DALGO ~ 1D Analysis
#ALGO When this bullish pattern is successful, the sustainable increase may bring the price of this coin to increase at least 10%+ from here.

ALGO Ready to Break Out—or Fake Out? Watch This Critical ZoneYello, Paradisers! have you been watching #ALGOUSD’s recent moves closely—or are you about to miss the bounce that could catch 90% of traders off guard?
💎After topping out in December 2024, ALGO entered a clear corrective phase. That correction just completed an ABC zigzag pattern right into a strong support region, slightly above its key weekly level—a zone where buyers historically step in.
💎#ALGOUSDT is showing clear bullish reactions between the 0.165–0.145 levels. More importantly, a complex bullish divergence is forming—on both RSI and MACD. This is your first warning sign that the bears are losing steam and bulls are ready to step back into control.
💎On the upside price must break and hold above the moderate resistance zone at 0.22 level. A successful reclaim here would not only validate the divergence but also represent a deviation reclaim, where price recovers a previously broken support level.
💎If this reclaim is successful and supported by volume, the next key zone to monitor is between 0.25 and 0.275. This region carries particular significance, as it aligns with both the descending trendline resistance and the 25% Fibonacci retracement. It is a critical level that will likely determine whether the current bounce evolves into a sustained bullish leg.
💎Should buyers maintain momentum beyond that point, the next upside target lies between 0.365 to 0.380 levels.
Paradisers, strive for consistency, not quick profits. Treat the market as a businessman, not as a gambler.
MyCryptoParadise
iFeel the success🌴

ALGOUSDT Facing a Major Reversal? Bears Ready to Take Over!Yello, Paradisers! Is ALGOUSDT about to take a sharp dive? The price is currently hovering around a key supply zone, struggling to push higher. With buyers failing to break through, the risk of a strong bearish rejection is increasing, signaling a potential short opportunity.
💎The market structure has shown a clear Change of Character (CHoCH), suggesting a shift from an uptrend to a potential downtrend. Price remains below the 50 EMA, reinforcing the bearish momentum. If sellers step in with force, the downside move could accelerate quickly.
💎Key downside targets are forming around 0.2188 and 0.1663, where the next major support zones lie. If the bearish scenario plays out, these levels could be reached sooner than expected. Any failure to reclaim higher levels will only strengthen the case for further declines.
This is where patience and discipline pay off. Market traps are everywhere, and only those who stay focused and trade smart will come out on top. Be ready for the move, Paradisers!
MyCryptoParadise
iFeel the success🌴

ALGOUSDT 1WALGO ~ 1W Analysis
#ALGO Buy from here if you still have a Conviction on this coin with a short -term target of at least 20%+.

ALGO / USDT : Gearing up for a breakout above Trendline ALGO/USDT: Gearing Up for a Breakout Above Trendline Resistance
ALGO/USDT is shaping up for an exciting move 📈 as it approaches a critical trendline resistance zone 📊. The price has been consolidating tightly, creating the perfect setup for a potential breakout 💥. If the breakout happens, we could see a strong bullish trend unfold 🚀. Keep a close eye 👀 on this pair and wait for confirmation before acting.
Key insights:
1. Trendline resistance: ALGO/USDT is approaching a long-standing trendline that has previously acted as a barrier. A break above this could mark the start of a strong upward move.
2. Volume surge: Watch for a significant increase in trading volume during the breakout to confirm buyer strength 🔥.
3. Bullish signals: Momentum indicators like RSI and MACD are trending positively ⚡, supporting the case for a bullish breakout.
Steps to confirm the breakout:
Look for a clear 4H or daily candle closing above the trendline 📍.
A noticeable spike in volume during the breakout can signal strong buying activity 📊.
A retest of the broken resistance as a new support zone adds credibility to the move ✅.
Be cautious of fake breakouts, such as sharp reversals or wicks above the trendline ⚠️.
Risk management strategies:
Use stop-loss orders to manage your risk effectively 🔒.
Ensure position sizing aligns with your overall trading strategy 🎯.
This analysis is for educational purposes only and not financial advice. Always conduct your own research (DYOR) 🔍 before making investment decisions.

ALGOUSDT 1WALGO ~ 1W Analysis
#ALGO If you still have a Conviction on this coin. Maybe this is very good support to start buying again from here.
#ALGO/USDT #ALGO
The price is moving in a descending channel on the 1-hour frame and is adhering to it well and is heading to break it strongly upwards
We have a bounce from the lower limit of the descending channel, this support is at a price of 0.3500
We have a downtrend on the RSI indicator that is about to be broken, which supports the rise
We have a trend to stabilize above the moving average 100
Entry price 0.3533
First target 0.4080
Second target 0.4381
Third target 0.4753

#ALGO/USDT Ready to go higher#ALGO
The price is moving in a descending channel on the 1-hour frame and sticking to it well
We have a bounce from the lower limit of the descending channel, this support is at 0.4064
We have a downtrend on the RSI indicator that is about to be broken, which supports the rise
We have a trend to stabilize above the moving average 100
Entry price 0.4313
First target 0.4475
Second target 0.4593
Third target 0.4960

Algorand middle term targetsAlgorand middle term targets BINANCE:ALGOUSDT
Possible Targets and explanation idea
➡️We already sweep covid historical march 2020 low
➡️On a W tf we can see money inflow based on my Money Power indicator
➡️Perfect scenario with test of Buy line of my Take Profit indicator
➡️Target will be break out of downtrend line and test with full fill around 0.53$ monthly FVG.
Hope you enjoyed the content I created, You can support with your likes and comments this idea so more people can watch!
✅Disclaimer: Please be aware of the risks involved in trading. This idea was made for educational purposes only not for financial Investment Purposes.
---
• Look at my ideas about interesting altcoins in the related section down below ↓
• For more ideas please hit "Like" and "Follow"!

Algo pump before World Cup in Qatar?BINANCE:ALGOUSDT
✅Before we start to discuss, I would be glad if you share your opinion on this post's comment section and hit the like button if you enjoyed it.
Thank you.
Algo is official partner FIFA, and in next month we will see major football event last 6 years. And its first time we will see World Cup championship in Qatar and in autumn (before it always was in June)
The idea is, hype around Algo and coins like CHZ bring a lot of attention to this coin.
Possible Targets and explanation
➡️Since January step by step big players accumulate ALGO (you can see on Direction indicator)
➡️We trade in -0.27 zone by fib
➡️More than 230 Days in accumulation phase
➡️Got a not strong but first signal to buy on D1 timeframe
➡️Marked first possible target to take profit.
➡️Daily downtrend line retested.
Hope you enjoyed the content I created, You can support with your likes and comments this idea so more people can watch!
✅Disclaimer: Please be aware of the risks involved in trading. This idea was made for educational purposes only not for financial Investment Purposes.
* Look at my ideas about interesting altcoins in the related section down below ↓
* For more ideas please hit "Like" and "Follow"!

ALGOUSDT %150 HUGE VOLUME SPIKE!Green Line and Blue Box: Excellent Buy Zones
Both the green line and the blue box are thoroughly analyzed and show tremendous potential.
Highlights:
Green Line: A critical support level—simple yet effective. Buyers are likely to step in here.
Blue Box: Carefully selected using the best tools: volume footprint, volume profile, CDV, and liquidity heatmap. It’s a high-probability zone.
Buyer Confirmation: Early signs of buyer activity make these levels even more compelling.
Key Observations:
"The blue box is very carefully picked using volume footprint, volume profile, cumulative delta volume, and liquidity heatmap. When trading this zone, I will look for buyers and upward market structure breaks in lower time frames for confirmation."
This setup looks promising, and I’m optimistic about its potential. Let’s watch for confirmation before acting! 🚀
Let me tell you, this is something special. These insights, these setups—they’re not just good; they’re game-changers. I've spent years refining my approach, and the results speak for themselves. People are always asking, "How do you spot these opportunities?" It’s simple: experience, clarity, and a focus on high-probability moves.
Want to know how I use heatmaps, cumulative volume delta, and volume footprint techniques to find demand zones with precision? I’m happy to share—just send me a message. No cost, no catch. I believe in helping people make smarter decisions.
Here are some of my recent analyses. Each one highlights key opportunities:
🚀 RENDERUSDT: Strategic Support Zones at the Blue Boxes +%45 Reaction
🎯 PUNDIXUSDT: Huge Opportunity | 250% Volume Spike - %60 Reaction Sniper Entry
🌐 CryptoMarkets TOTAL2: Support Zone
🚀 GMTUSDT: %35 FAST REJECTION FROM THE RED BOX
🎯 ZENUSDT.P: Patience & Profitability | %230 Reaction from the Sniper Entry
🎯 DEXEUSDT %180 Reaction with %9 Stop
🐶 DOGEUSDT.P: Next Move
🎨 RENDERUSDT.P: Opportunity of the Month
💎 ETHUSDT.P: Where to Retrace
🟢 BNBUSDT.P: Potential Surge
📊 BTC Dominance: Reaction Zone
🌊 WAVESUSDT.P: Demand Zone Potential
🟣 UNIUSDT.P: Long-Term Trade
🔵 XRPUSDT.P: Entry Zones
🔗 LINKUSDT.P: Follow The River
📈 BTCUSDT.P: Two Key Demand Zones
🟩 POLUSDT: Bullish Momentum
🌟 PENDLEUSDT.P: Where Opportunity Meets Precision
🔥 BTCUSDT.P: Liquidation of Highly Leveraged Longs
🌊 SOLUSDT.P: SOL's Dip - Your Opportunity
🐸 1000PEPEUSDT.P: Prime Bounce Zone Unlocked
🚀 ETHUSDT.P: Set to Explode - Don't Miss This Game Changer
🤖 IQUSDT: Smart Plan
⚡️ PONDUSDT: A Trade Not Taken Is Better Than a Losing One
💼 STMXUSDT: 2 Buying Areas
🐢 TURBOUSDT: Buy Zones and Buyer Presence
🌍 ICPUSDT.P: Massive Upside Potential | Check the Trade Update For Seeing Results
🟠 IDEXUSDT: Spot Buy Area | %26 Profit if You Trade with MSB
📌 USUALUSDT: Buyers Are Active + %70 Profit in Total
🌟 FORTHUSDT: Sniper Entry +%26 Reaction
🐳 QKCUSDT: Sniper Entry +%57 Reaction
📊 BTC.D: Retest of Key Area Highly Likely
This list? It’s just a small piece of what I’ve been working on. There’s so much more. Go check my profile, see the results for yourself. My goal is simple: provide value and help you win. If you’ve got questions, I’ve got answers. Let’s get to work!

ALGOUSDT 1WALGO Update ~ 1W
#ALGO So far it still maintains its bullish structure. This buy range is very wide, buy in stages with a minimum target of 20%+
Algo usdt 20% potential spot tradeALGO/USDT is showing a promising 20% potential in the spot market, supported by increasing trading activity and bullish sentiment. A breakout above key resistance levels could drive further upward momentum, making it an appealing short-term trade opportunity.

Algorand (ALGO) Surges 1650% at 10x Leverage!Algorand (ALGO) Trade Overview:
Algorand (ALGOUSDT) delivers an explosive performance, achieving a phenomenal 1650% gain at 10x leverage using the Risological Trading Indicators . The 4-hour timeframe captured this breathtaking rally as ALGO hit all targets and surpassed expectations.
Key Levels:
TP1: 0.1247 ✅
TP2: 0.1364 ✅
TP3: 0.1482 ✅
TP4: 0.1555 ✅
Technical Analysis:
The trade was initiated as ALGO broke past the Risological Green Lines, confirming a strong bullish momentum. The gradual upward curve of these lines provided early indications of sustained buying pressure. The price surged consistently, clearing all the predefined targets with ease.
This move reflects a textbook breakout scenario, powered by volume spikes and an aligned bullish sentiment in the market. Traders leveraging Risological tools were well-positioned to capture this remarkable upside, securing massive profits.

#ALGO/USDT#ALGO
The price is moving in a descending channel on the 4-hour frame and is sticking to it well
We have a bounce from the lower limit of the descending channel and we are now touching this support at a price of 0.1186
We have an upward trend on the RSI indicator that is about to be broken, which supports the rise
We have a trend to stabilize above the moving average 100
Entry price 0.1280
First target 0.1333
Second target 0.1370
Third target 0.1416

ALGOUSDTALGO ~ 1W
#ALGO If you still have Conviction on this coin,. This support block would be a very good buying place for now,. with a minimum target of 20%++

Target 0.165Following weekly chart and got a long signal ( actually yesterday) from my screener.
TP1 0.154
TP2 0.165
SL Not a super ratio but close under 0.123 weekly close.
