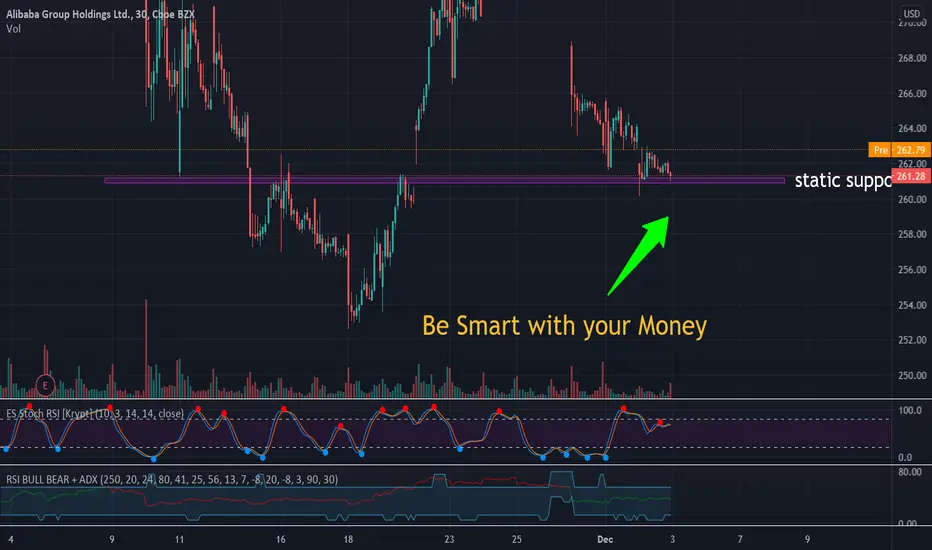
US Stock In Play: $BABA (Alibaba Group Holdings Ltd.)BABA bullish reversal coinciding with trendline support, immediate resistance at $280 gap.
Alibaba

ALIBABAthere are lots of things to consider.
Let's start with the price chart.
we had 2 down gap, not yet covered very well, plus the last one of 30th Nov.
considering the 200 ma, it's close, yet away $20.
then the ma 20 days, that took down the price 2 times, at $303 and $280, which is just on top of the price again at $270 (price now $266)
MACD
isn't really good looking now. 12 ma is crossing downturn the 26 ma, which is usually bearish, plus it's close to 0 in the bars.
talking about the RSI.
it's optimistic, since it says the price is going to be more bought, yet under 50% (ca 45%)
VOLUME
It's looking good. volume, since the spike when ALIBABA went down from $310, is lowering, which could mean the downtrend strength is lowering, so it can reverse.
yet the volume is not calm and has not been as low as during the upturn (just like from 270 to 310 in October).
I want to try to use a 1-10 (may scale it in future, just today's new idea), to rate the stock IMO
sooooooo, I'm going to give baba a 7. it's because fundamentally its good, china is a good place for this business right now, and the price is as low as 5 months ago. 1Y +32% ok? quite good.
the chart is not the best at the moment, but if ur not considering buying into it, u should at least check it daily to see if it hit 200 ma.
CAMELOT0707 RATE 03 December 2020 = 7/10
the weekly chart for a larger view.
hourly chart :D you never know

BABA stock is going to be bullishAlibaba holdings is going to be bullish as the market opens and its going to regain its volume power of buyers as the RSI indicator shows weak signals of bearish
Alibaba H4 - first ShortAlibaba H4 - first Short (rebound from resistance 280 to support 252) then Long (rebound from support 252 back to resistance 280 and descending channel 286)

AlibabaWhat Is Holding Back Alibaba Exponential Growth
The Chinese company Alibaba Group owns more than 900 enterprises, generates a turnover of almost $ 400 billion, and creates tens of millions of jobs.
Alibaba was recently set to conduct the largest IPO in history, bringing its subsidiary Ant Group fintech service to two exchanges at once - Shanghai and Hong Kong. During the IPO, the company planned to raise at least $ 34 billion.
Trading in securities was supposed to begin on November 5, but two days before the start of trading, the IPO was suspended by the Chinese government. As a result, Alibaba shares fell in value.
Alibaba's quarterly revenue beats all the forecasts of the analysts. A big increase is expected in connection with the Black Friday and Cyber Monday holidays.
The latest news: Alibaba will help the government build electric vehicles and has been laying the groundwork for this for more than 5 years by working with the Chinese state-owned automaker SAIC Motor.
Technically, Alibaba is currently in an uptrend, the price is moving in the channel and exponential growth is just around the corner.
Best regards EXCAVO


BABA Alternate wave countAlternate wave count on BABA shows we could be contained in the range of 305-2260 with a prolonged consolidation. Nonetheless, we are still favoring a more bullish outlook on BABA on the medium the longer term into 2021. Exact Trade Execution details in video update.
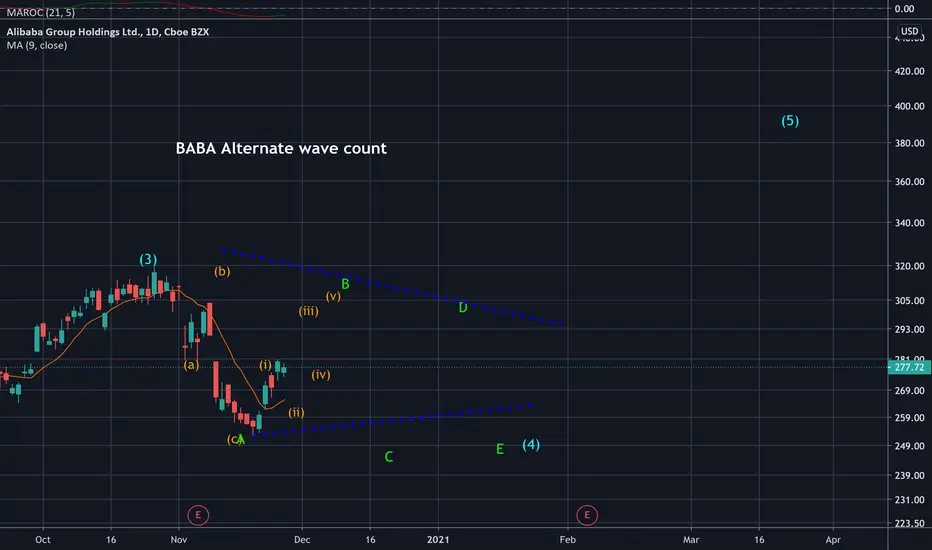
BABA Bullish Trade Setup BABA dips into wave (ii) support level at 38.2% retracement or 263 setting up for a potential move higher targeting the 340-360 range into 2021. Looking to establish some minor longs on BABA with dips into 263 with either Leaps or Longer Term Bullish Vertical.

Elliott Wave View: New Bullish Cycle in AlibabaShort Term Elliott Wave view in Alibaba suggests the decline from October 27 peak has ended at $252.5 as wave (4). The internal subdivision of wave (4) unfolded as a zigzag Elliott Wave structure. The 60 minutes chart below shows wave C of that zigzag which completed at $252.5. The stock has since turned higher in wave (5).
Alibaba however still needs to break above wave (3) at $319.3 to rule out a double correction in wave (4). Short term rally from wave (4) low at 252.52 is unfolding as a 5 waves impulse structure. Up from wave (4) low, wave ((i)) ended at 258.31 and pullback in wave ((ii)) ended at 252.67. Stock then resumed higher in wave ((iii)) towards 278, and pullback in wave ((iv)) ended at 270.11. Expect the stock to finish wave ((v)) soon and this complete wave 1 of (5) in higher degree. Afterwards, it should pullback in wave 2 of (5) to correct cycle from November 18 low before the rally resumes. As far as November 18 pivot low at 252.52 holds, expect the stock to find support in 3, 7, or 11 swing for the next leg higher.


Alibaba trendline breakout, more upside ! Alibaba has broke out of the bearish trendline and could bounce from the bullish trendline intersection, more upside is available!


Re-accumulation phase for Alibaba before markup I believe BABA has shown us the first levels of its trading range at the $315 level and $255 level and I think this is the range we will see the strong hands start accumulation before the Ant IPO for the markup. I will be swinging BABA in this range until it’s time for the final rally up in its final phase of this range.

Alibaba (BABA): Dissecting the FUD, Fundamentals, and TechnicalsAlibaba Group is a Chinese multinational tech company specializing in e-commerce, and IT. This Chinese company is listed on the New York Stock Exchange (NYSE) as BABA. In this analysis, I’ll be covering the company’s fundamentals by looking at its business model and financials, as well as technical analysis for the stock. I’ll also be providing my own insight on why this stock has been rather underperforming for the past few weeks, and what we can expect for the future.
Business Model
- Alibaba, while it initially started with a focus on e-commerce, has expanded to other territories as well
- It aims to offer the necessary digital infrastructure as an e-commerce platform, providing small businesses the necessary tools and equipment to operate online.
- Alibaba also takes part in cloud computing, just like AWS and Azure, offering data storage, big data analysis, and machine learning services.
- Alibaba also has a business dedicated to digital media, producing original content
- Alibaba owns 33% of Ant Financial’s shares, which is what affected the price action so heavily recently
Ant Financial IPO FUD
- Ant Financial is a company that was formerly known as Alipay.
- Its expected market valuation after the dual listing was expected to reach over $310 billion, which would have significantly affected BABA’s price as well.
- However, the Chinese Communist Party halted the Initial Public Offering (IPO) of this company, without an official explanation.
- Ant Financial has transformed the way Chinese people interact with money. It challenged China’s banking system by brining easy use of payments, borrowing, and investing through smartphones across the entire country
- Ant Financial’s business model, in essence, puts financial services outside the direct control of the CCP and Chinese banks
Financials
- So at this point, we understand why Alibaba’s stock prices have been negatively affected by news.
- Looking at the company’s financials, we can discover that the firm’s fundamentals remain solid
- The company has shown a parabolic growth in their revenue since 2010, reaching record highs for the 2020 Estimate
- Accordingly, its operating income grows at a steady pace as well.
- Its gross profit margin averages at 55.5%, which is considered as extremely high profit margins
- They did report a decline in yoy EPS for the 12 months ending in September 30, 2020, and a 60% yoy decline in the EPS for the quarter ending at the same time.
- Nevertheless, it has still managed to beat the consensus EPS, and continues to demonstrate yoy growth
Technical Analysis
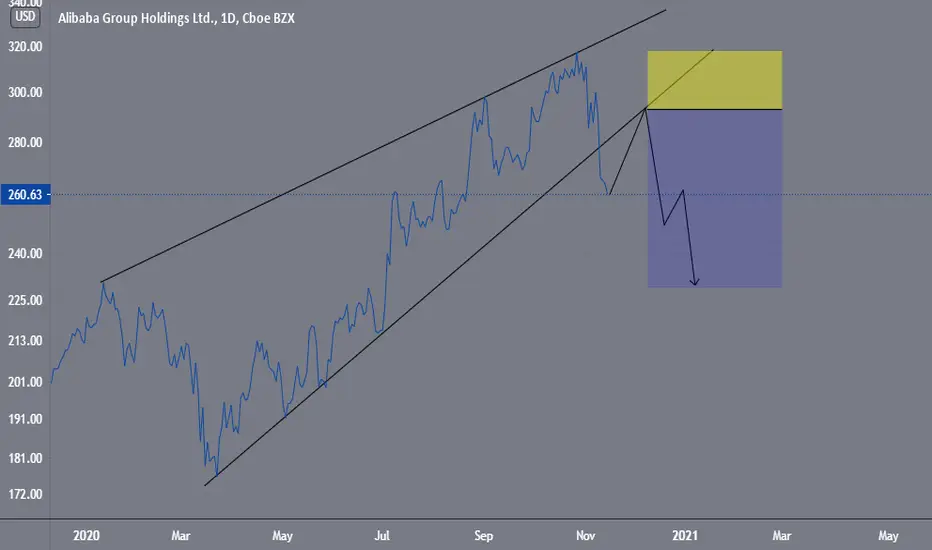
- This is the weekly chart for Alibaba
- We can see that it was consolidating in a rising wedge pattern, before breaking out in July 2020.
- Due to the Ant Financial IPO cancellation FUD (fear, uncertainty, and doubt), stock prices fell from $320 down to $255.
- Elliott Wave counts suggests a further potential downside to $220-230 levels, where it could complete the corrective wave at the gap support
- We can also see that prices have never broke down the 150 Simple Moving Average (SMA) on the weekly.
- This indicates that the converging point of the 150 SMA and the 0.618 Fibonacci retracement support at $200 could be considered our last line of support
- Thanks to the recent corrective move, however, the Relative Strength Index (RSI) has been flushed out to neutral levels, from overbought territories
- It seems as though the RSI could bounce on the trend line support soon
Conclusion
Alibaba is a solid company with strong fundamentals and financials, as well as a business model that expands throughout a wide range of areas. It has fallen victim to the restrictions imposed by the Chinese Communist Party recently, but it’s important to understand the role this company plays for the Chinese economy and the world economy. Companies like Alibaba are essentially too big to fall. There are attempts made by governments of various countries such as the US with big tech companies, and South Korea with Samsung Group, to regulate dominant firms. Regardless, none of them have actually succeeded besides a small correction in stock prices driven by FUD. As such, while technical analysis suggests further potential downside, I believe that investors should approach this stock from a buy perspective.
If you like this analysis, please make sure to like the post, and follow for more quality content!
I would also appreciate it if you could leave a comment below with some original insight.

$BABA has bottomed folksI've been following $BABA for the past 3 weeks and I think we hit bottom today at $253. RSI on daily touch 32 and bounce off. I'm calling it and bought some DEC 31 275C and leap.


BABA Daily chart with Fib and EwaveLooks like BABA resting on some support today after falling from support yesterday. Currently resting on .786 fib level. BABA is CHEAP right now, but there can be more downside with major support at $230-ish level as the ultimate bottom (unless there's a market-wide sell-off this is not very probable. I am personally adding to my March calls here.

BABA - BUY opportunity including Stop Loss and Take ProfitAnalysis of BABA (Alibaba Group).
Current price is an opportunity to buy BABA.
Alibaba group lays on a strong support level, and just might bounce back up.
Even if my RSI Tunnels indicator is bearish, but it's in the deeps and there might be an opportunity here for a long.
Stop Loss = 255
Take Profit = 300
Buy around current prices, 265-266
We can loss around 10$ (255 stop loss) per share but we can win 35$ (300 take profit) per share
definitely positive risk reward ratio.
Sounds like a good deal to me.
Of course, if BABA breaks the 300 price barrier , you might want to consider holding it a bit more as it can reach it's 320 range.
Soon i might publish more interesting ideas, Follow to get notified.

Retesting Support Hello guys I hope you guys like my chart not to much on it but I’m looking for sometime this month for alibaba to bounce back to 300+ Let’s see how it plays out

BABA BY REQUEST!! 5 min breakdownThanks for reaching out! if you have a ticker you want me to look at im happy to do so!

BABA: 2 Day Chart Shows Where Bulls May Be HidingBABA 2 Day Analysis.
I just caught a trend I wanted to point out.
The bulls do have a very strong trend in play underneath at 253 acting as support. I pointed that out with the heavy blue lines and colored the top as support to show where it is in relation to current price action. The bull zone I posted earlier happens to be positioned in the top portion of that trendzone. This gives me even more confidence in that zone.
Also, the CDV indicator below is still bullish. it usually correlates within +/-5% so it's rare to see it out pacing price action by 2x. It has began to flatten out but we haven't confirmed any bearish trend on the indicator. This may show bulls are on the sidelines waiting for their sign.
Aside from my bull zone prediction, there is strong confluent support at 253. I would not short into this zone.
None of this is a recommendation. All of your trades should be considered with your own personal analysis. NYSE:BABA
