Alibaba

ALIBABA Technical AnalysisIt looks like a bullish Market.
Wait that the trendline will be tested before buying (following the trend direction)

BABA Analysis (ALIBABA GROUP HOLDINGS LTD)When NYSE:BABA closes significantly above the green rectangle area (Significantly above the 201.5) , I think it would very likely to continue up to around the 209-210 area (Around first blue line) , with a potential to reach the 219-220 level (second blue line) , depending on how price would act around the 209-210 area .

ALIBABA - BABA Technical AnalysisFundamental Analysis:
Alibaba sees China retail volume growing near pre-pandemic levels but stock falls amid U.S.-China tensions
Technical Analysis:
Option A - 45% - Prices Will follow the bullish Market -upward trendline
Option B - 45% - Prices Will find the next support before jumping up again below the upward trendline
Option C - 10% - Target Price 180.00 usd - If Tension between USA and china will keep growing
The Idea is to wait the right time before going long.

CNBC: "BABA stock could forecast the global economy's next move"CNBC news: www.cnbc.com
One Chinese stock could forecast the global economy’s next move.
Key points:
Alibaba “stock started rolling over in very early January before the Chinese stock market did and certainly before the global economy started to slow down.
So in other words, its weakness was a good leading indicator to tell us that the coronavirus was going to have a bigger impact than a lot of people thought,” Maley said Tuesday on CNBC’s “Trading Nation.”
Alibaba stock executed a double top pattern before the first crash and is now heading replicate the pattern again. I personally wouldn't take this as any kind of clear sign as I'm doubtful of how good of a leading indicator Alibaba stock is for the global and U.S. economy. However it's interesting to wait and see how things play out for both, the S&P 500 and Alibaba.

Is this King of Tech a Prince of Thieves? | ALIBABA ($BABA)🗺️ Despite strong earnings for Alibaba and an epic recovery since the COVID dump, BABA is in real danger due to new legislation in the US that essentially targets Chinese companies. The legislation won't necessarily lead to anything like a BABA delisting, but fear, uncertainty, and doubt (better known as FUD) surrounding the news makes it hard to see new all time highs for this Chinese giant. Given the uncertainty, what we have now is more of a sell / no trade zone than a clear long or short.
While we typically short downtrends on retests of bearish orderblocks and bearish S/R levels (maroon lines), we have no clear trade at the moment. So instead let's look at some levels of interest.
Below we have S1 - S3 for support. S1 would work well for a dead cat bounce, because it would appear to keep the bullish structure of the trend in place. Meanwhile, any level on the trend line starts to erode the uptrend and is likely to only act as gradual support on the way down.
If the bulls can somehow keep BABA afloat, even if just temporarily, resistance levels above include a retest of R1 and the R2 swing highs, both of which could set us up for a nice short.
Resource: www.bbc.com + www.marketwatch.com
✨ Drop a comment asking for an update, we do NEW setups every day! ✨
Like, Comment & Follow to help the community grow 🎉🎉

ALI $BABA Prediction for Investors | Best Chart by BABAThe Market is really low but $BABA can be a big deal if only you are patient.
When the market is disconnected to reality be fake as well and take profit.

ALIBABA TRADE IDEA Alibaba Stock trade opportunity 194,00 reasonable price to have . TARGET is 240. This is my opinion .Dont take that as financial advice.


BABA Looks Extremely Attractive Before EarningsEarnings are this Friday, and this e-commerce giant is bound to report some really solid numbers due to COVID. The stock recently moved above its 50-day moving average and has been trading in a rising channel. Fuel from earnings could provide the catalyst for the next big move up. Any weakness should be considered a buying opportunity - BABA has a bright future ahead.

BABA double bounce Long (possible head and shoulders)NYSE:BABA Retested its R2 resistence now support line and bounce. Looking to form a slight head and shoulders pattern before heading to R3 / R4 higher highs.
BABA just got added to HONG KONGS index today so we should be looking for an upgrade in price target soon.
Option A- We re test R2 again forming a head and shoulder pattern before we go test R3
Option B- We continue to follow up trend from the double bounce for R3 / R4
Like if found helpful

Alibaba - Another Tech Giant in 2020sLaziness is for the weak !!!🤣 Although I don't have some great ideas to code indicators or strategies today (actually I got plenty under my belt) , I must share with you this simple chart I have come across with. 😘
Alibaba - a household stock almost every trader has traded on , debuted in Hong Kong last year, which stimulated its share price significantly. And I just found a great pattern with it - inverse head-and-shoulder pattern.👍
The recent selloff due to the issues with Soft Bank just stopped at its left shoulder ($187) and regained its strength again. I will put my target at $ 225-227 , and keep some for breakout after buyers realize it is an inverse H&S.
Just a short update for today. Happy trading. Don't forget Likes and shares!!! 👈

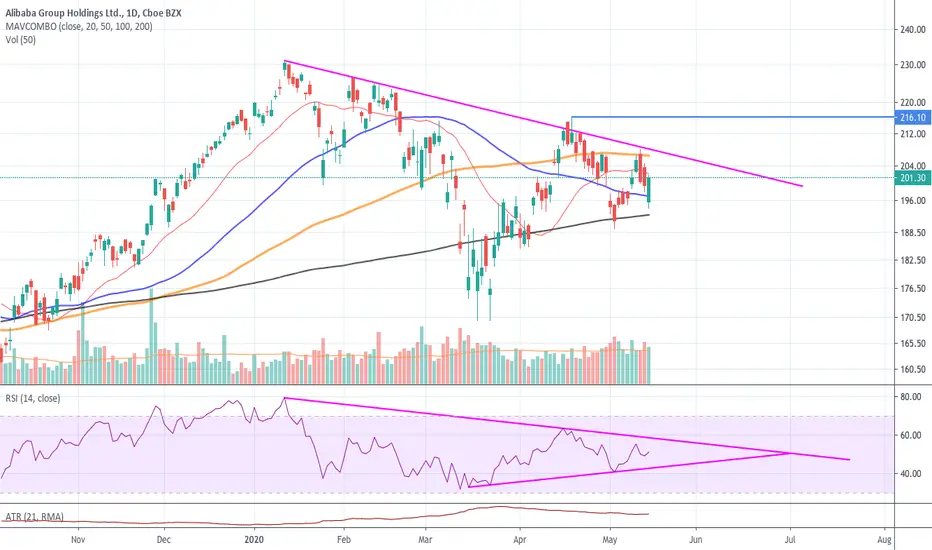
Ali BABA Group $BABAIt needs to break out the trendline and i would wait to get above $216.21 for bullish action. 50 and 200 SMA are the support. Watch for RSI trendline as well.
If you find my charts useful, please leave me "like"
thx
JD.COM ($JD): China's COVID Numbers are Down; is it Time to See ✨ New charts every day ✨
Like, Comment & Follow to help the community grow 🎉🎉
---
JD.com specializes in online shopping, and it has been showing real strength during COVID. Despite annual earnings being dismal, revenue has been growing.
JD.com is likely a good long play for a few reasons: 1. JD is competitively valued based on its growth compared to Alibaba and Amazon, 2. JD.com is seeking a listing in the Hong Kong market, 3. JD.com has likely done well in terms of earnings under COVID, and 4. ultimately, because the chart is bullish.
Despite all of that positivity, there is cause to look for a pullback. JD just tested resistance and there could be room for some pre-earnings / earnings volatility. The idea here then is to buy any pullback from earnings and take a long position.
Resources: www.marketwatch.com + finance.yahoo.com + www.earningswhispers.com
---
1. Fractal Trend is showing an uptrend (Aqua bar color) on the 4 hour chart.
2. With this strategy, we we want to enter long on bullish order blocks plotted by Orderblock Mapping (Blue) and bullish S/R levels plotted by Directional Bias (Blue).
3. Our goal is to buy a pullback to S1 either before earnings or during volatility caused by earnings.
4. Our target is currently unknown and such this may be a buy and hold situation with Fractal Trend indicating a changing of trend(bar color) being the exiting factor if we soar past those all time highs.
5. Other areas of interest include S2 and S3. These levels may act as support if for any reason the current uptrend can't continue.

#BABA ANALYSIS.. POSSIBLE PATTERN FOR LONG TERM.. I think that the pandemic disaster we are in will continue for a long time and there will be a collapse in the markets on a global scale, in this context, I expect a structure in the stock as I stated in the chart.. The pattern I draw in the chart can be seen in many stocks, I think the second wave of sales will be more devastating, we will wait and see..
Disclaimer: Please do your own due diligence when it comes to investing.. Invest at your own risk..
I wish you all the best..

Alibbab Technical AnalysisWait the right signal to go long.
The trendline has been broken, perhaps it can be tested (return move) before going up.


Alibaba - Trading ChannelPrice strongly rebounded Monday on the lower end of the pitchfork, validating the upward trading channel.

ALIBABA GROUP HOLDINGS LTD Analysis .I think NYSE:BABA needs to provide much more confirmation before one considers buying this stock .
I can think of these scenarios :
First scenario :Price doesn't go any lower than 192.9 after the opening and price goes up to test the blue resistance line and then closes considerably above the blue line /200 area , in this case I think it's a confirmation to buy and set a target at around 208.5 .We could even break above the green line and that would be an even stronger buy signal with a first target at around 216 and a good potential to hit the 230 (second target)
Another scenario : Price drops considerably below the 192.9 which would make the blue line almost useless , and continues droping to around the black line at around 186.5 , that would be a level with high probability of a bounce up and winning a buy entry with a target set at around 193.
In case price closes considerably below the blackline , it would be a rather sell signal with a target set at around 178 .

Alibaba - BABA- H1Alibaba - BABA- H1
Sell @ Pullback 0.50 Fibonaci
Entry: 200.00 | Stoploss: 204.00 | Takeprofit1: 193.00 | Takeprofit2: 188.00
■■■■■■■■■■■■■■■■■■■■■■■■■■■■■■■■■■■■■
If you like this idea please click the like button to support this channel, thanks.
■■■■■■■■■■■■■■■■■■■■■■■■■■■■■■■■■■■■■
Disclaimer: All information and ideas i provide is for educational purposes only. It is not a recommendation to buy or sell.
■■■■■■■■■■■■■■■■■■■■■■■■■■■■■■■■■■■■■


Ali Baba - Very Short Term - Breakout LikelyHigh selling volume + Long Tail Candlestick + Rising RSI => Breakout Likely

SHORT TERM ONLY BABA IS BEARISH SHORT TERM ON 6 M AND 1 MONTH CHART IT IS VERY BEARISH
on the one year it just touch the cloud but can rebound from there
I love Baba so will so sell it but good if goes lower so can add to my holdings
